. 2020 Jul 9;9(7):1658.
doi: 10.3390/cells9071658.

Identifying the Structural Adaptations that Drive the Mechanical Load-Induced Growth of Skeletal Muscle: A Scoping Review

Affiliations

Identifying the Structural Adaptations that Drive the Mechanical Load-Induced Growth of Skeletal Muscle: A Scoping Review

Kent W Jorgenson et al. Cells. .

Abstract

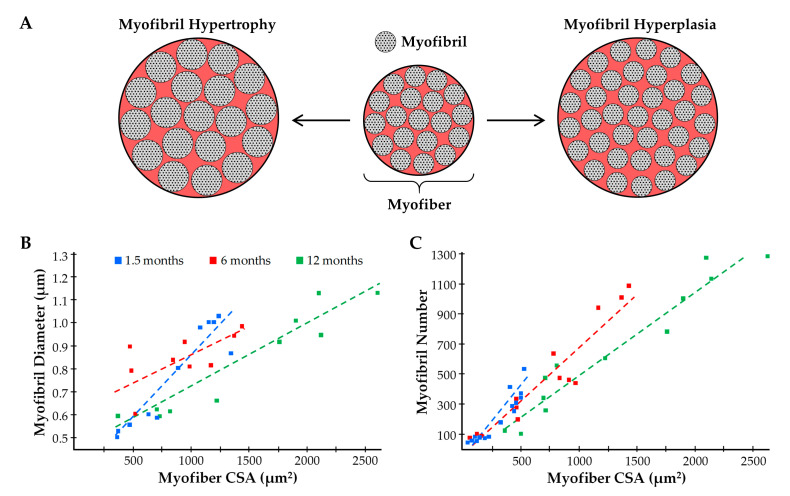
The maintenance of skeletal muscle mass plays a critical role in health and quality of life. One of the most potent regulators of skeletal muscle mass is mechanical loading, and numerous studies have led to a reasonably clear understanding of the macroscopic and microscopic changes that occur when the mechanical environment is altered. For instance, an increase in mechanical loading induces a growth response that is mediated, at least in part, by an increase in the cross-sectional area of the myofibers (i.e., myofiber hypertrophy). However, very little is known about the ultrastructural adaptations that drive this response. Even the most basic questions, such as whether mechanical load-induced myofiber hypertrophy is mediated by an increase in the size of the pre-existing myofibrils and/or an increase in the number myofibrils, have not been resolved. In this review, we thoroughly summarize what is currently known about the macroscopic, microscopic and ultrastructural changes that drive mechanical load-induced growth and highlight the critical gaps in knowledge that need to be filled.

Keywords: exercise; fascicle; hyperplasia; hypertrophy; longitudinal growth; myofiber; myofibril; radial growth; sarcomere; splitting.


Conflict of interest statement

The authors declare no conflict of interest.

Figures

Figure 1
Figure 1
(A) Illustration of skeletal muscle structure copied with permission under the Creative Commons Attribution 4.0 International license and adapted for this review, available online: https://openstax.org/books/anatomy-and-physiology/pages/10-2-skeletal-muscle (accessed on 6 January 2020) [28]. (B) Cross-section of a mouse plantaris muscle that was subjected to immunohistochemistry for the identification of Type IIA (cyan), and Type IIB (magenta) myofibers as well as laminin to identify the endomysium (white). (C) Cross-section of a mouse plantaris muscle that was subjected to immunohistochemistry for the identification of dystrophin to identify the inner boundary of the sarcolemma (white) and nuclei (green). (D) Cross-section of a mouse plantaris muscle that was subjected to electron microscopy to highlight the sarcoplasmic reticulum (SR) that surrounds individual myofibrils as well as the mitochondria (Mito) that run between the myofibrils. (E) Higher magnification of the boxed region in D reveals the presence of the thick and thin myofilaments.
Figure 2
Figure 2
Various pennation angle arrangements of the fascicles/myofibers in skeletal muscle: (A) fusiform, (B) unipennate, (C) bipennante, (D) multipennate. Blue lines indicate the plane for the anatomical cross-sectional area (CSA) (i.e., the CSA that runs perpendicular to the longitudinal axis of the muscle), and green lines indicate the plane for physiological CSA (i.e., the CSA that runs perpendicular to the longitudinal axis of the fascicles/myofibers). Adapted under the Creative Commons Attribution-Share Alike 3.0 Unported license from original work by Uwe Gille (Available online: https://creativecommons.org/licenses/by-sa/3.0/deed.en (accessed on 6 January 2020).
Figure 3
Figure 3
Illustration of how the longitudinal and radial growth of fascicles can lead to changes in muscle cross-sectional area (CSA). (A) Key elements of a geometric model that can be used to predict the architectural properties of skeletal muscle [75]. (B) Illustration of how an 11% increase in fascicle length would result in 30% increase in CSA, as well as a 30% increase in the number of fascicles per cross-section. (C) Illustration of how a 14% in fascicle diameter would lead to a 15% increase in the pennation angle and a 30% increase in the CSA, but essentially no change in the number of fascicles per cross-section.
Figure 4
Figure 4
Illustration of how the radial growth of muscles fascicles could result from (A) myofiber hypertrophy, (B) myofiber splitting or hyperplasia, or (C) longitudinal growth of myofibers that exhibit intrafascicular terminations, such as those observed in the long sartorius and gracilis muscles of humans [90].
Figure 5
Figure 5
(Top) Schematic illustration of the soleus muscle and its basic architectural properties [142]. (Bottom) Summary of the data provided by Williams and Goldspink (1973) [135]. Values are presented as the means ± SEM and were analyzed with 2-way repeated measures ANOVA. p-values for the main effects (i.e., Treatment and Region) and interaction are provided. * Significantly different from the region-matched control condition.
Figure 6
Figure 6
(A) Electron micrograph (EM) image that shows a group of myofibrils along with sarcomeres embedded within these myofibrils that possess a transverse split (red arrow) at the H-zone. The image was copied with permission under a Creative Commons License Attribution–Noncommercial–Share Alike 4.0 Unported license, and is available online at https://www.ncbi.nlm.nih.gov/pmc/articles/PMC2110374/ (accessed on 6/20/2020) [143]. (B) EM image of myofibrils from a muscle that was subjected to synergist ablation and appears to possess a transverse split at the H-zone (copied with permission from [118]). (C,D) EM image (C) and immunohistochemical image (D) of regions with “supernumerary sarcomeres” that are found in human skeletal muscles several days after being subjected to a bout of eccentric contractions (copied with permission from [147,148]). (E) Depiction of a “sphenode” region as detailed by Heidenhain (1919) [151]. (F) Illustration describing a mechanism for the in-series addition of new sarcomeres via transverse splitting at the Z-disc (copied with permission from [150]).
Figure 7
Figure 7
(A) Illustration of how an increase in the CSA of the pre-existing myofibrils (myofibril hypertrophy) and an increase in the number of myofibrils (myofibril hyperplasia) can contribute to the radial growth of myofibers. (B,C) Summary of the data from Goldspink (1970) which highlights the relationship that exists between myofiber CSA and myofibril diameter (B), as well as myofiber CSA and myofibril number (C), in mice of various ages [185].
Figure 8
Figure 8
(A) Electron micrographs of longitudinal sections from mouse skeletal muscle. Red arrows highlight myofibrils that appear to split into two smaller daughter myofibrils (copied with permission from [186]). (B) Illustration from Goldspink (1983) which describes how the oblique angle of the thin myofilaments could exert outward radial forces on the Z-disc when the sarcomeres contract (copied with permission from [140]).
Figure 9
Figure 9
Illustration of where new myofilaments might be added during myofibril hypertrophy. The described possibilities include: (A) the periphery of the pre-existing myofibril, (B) the center of the pre-existing myofibril, or (C) throughout the pre-existing myofibril.
Figure 10
Figure 10
(A) Electron microscope autoradiograph from Morkin (1970) which shows the large electron dense grains that were used to identify the location of newly synthesized proteins in the rat diaphragm. (B) Bars represent the frequency distribution of the grains relative to the periphery of the myofibril, and the green shaded curve illustrates the theoretical distribution that would be expected if the newly synthesized proteins were located exclusively at the periphery of the myofibril. The images in both A and B were copied with permission from [192]. (C) Electron micrograph of the levator ani muscle from an adult rat which reveals the presence of ribosomes in the intermyofibrillar space. Please note that many of the ribosomes appear in different polysomal configurations (P1, P2 and P3) (copied with permission from [193]). (D,E) Illustration of how well the data from Morkin 1970 fit with the theoretical distribution that would be expected if the newly synthesized proteins were located exclusively at the periphery of the myofibril (D) versus being located exclusively within the intermyofibrillar space (E). (F) A graph illustrating the theoretical radial distribution of the signal obtained with electron microscope autoradiography versus with immunoelectron microscopy that employed a primary antibody (15 nm diameter) conjugated to a 10 nm gold-particle [195,196,197].
Figure 11
Figure 11
Illustration of the proposed “Myofibril Expansion Cycle”.

References

    1. McLeod M., Breen L., Hamilton D.L., Philp A. Live strong and prosper: The importance of skeletal muscle strength for healthy ageing. Biogerontology. 2016;17:497–510. doi: 10.1007/s10522-015-9631-7. - DOI - PMC - PubMed
    1. Doherty T.J. Invited Review: Aging and sarcopenia. J. Appl. Physiol. 2003;95:1717–1727. doi: 10.1152/japplphysiol.00347.2003. - DOI - PubMed
    1. Mitchell W.K., Williams J., Atherton P., Larvin M., Lund J., Narici M. Sarcopenia, dynapenia, and the impact of advancing age on human skeletal muscle size and strength; A quantitative review. Front. Physiol. 2012;3:260. doi: 10.3389/fphys.2012.00260. - DOI - PMC - PubMed
    1. Kalyani R.R., Corriere M., Ferrucci L. Age-related and disease-related muscle loss: The effect of diabetes, obesity, and other diseases. Lancet Diabetes Endocrinol. 2014;2:819–829. doi: 10.1016/S2213-8587(14)70034-8. - DOI - PMC - PubMed
    1. Shou J., Chen P.-J., Xiao W.-H. Mechanism of increased risk of insulin resistance in aging skeletal muscle. Diabetol. Metab. Syndr. 2020;12:14. doi: 10.1186/s13098-020-0523-x. - DOI - PMC - PubMed

Publication types

LinkOut - more resources