. 2020 Jul 13;13(1):77.
doi: 10.1186/s13048-020-00683-y.

Bioinformatic analysis reveals MIR502 as a potential tumour suppressor in ovarian cancer

Affiliations

Bioinformatic analysis reveals MIR502 as a potential tumour suppressor in ovarian cancer

Yan Li et al. J Ovarian Res. .

Abstract

Background: Ovarian cancer (OC) is a major cause of death among women due to the lack of early screening methods and its complex pathological progression. Increasing evidence has indicated that microRNAs regulate gene expression in tumours by interacting with mRNAs. Although the research regarding OC and microRNAs is extensive, the vital role of MIR502 in OC remains unclear.

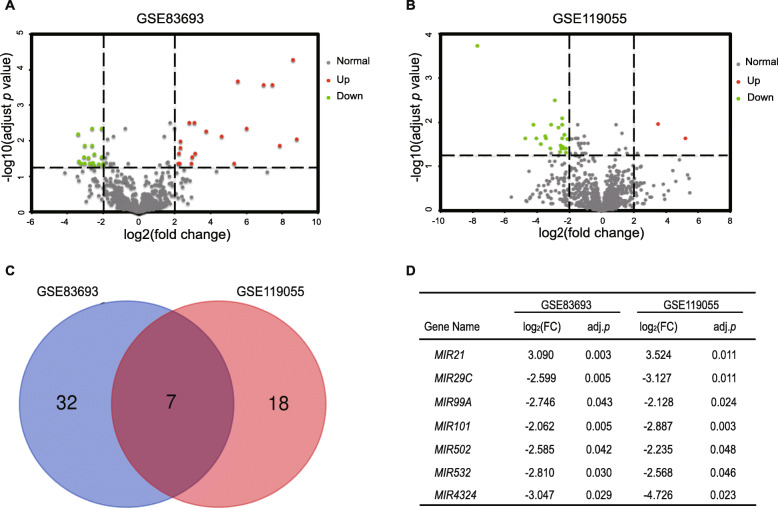
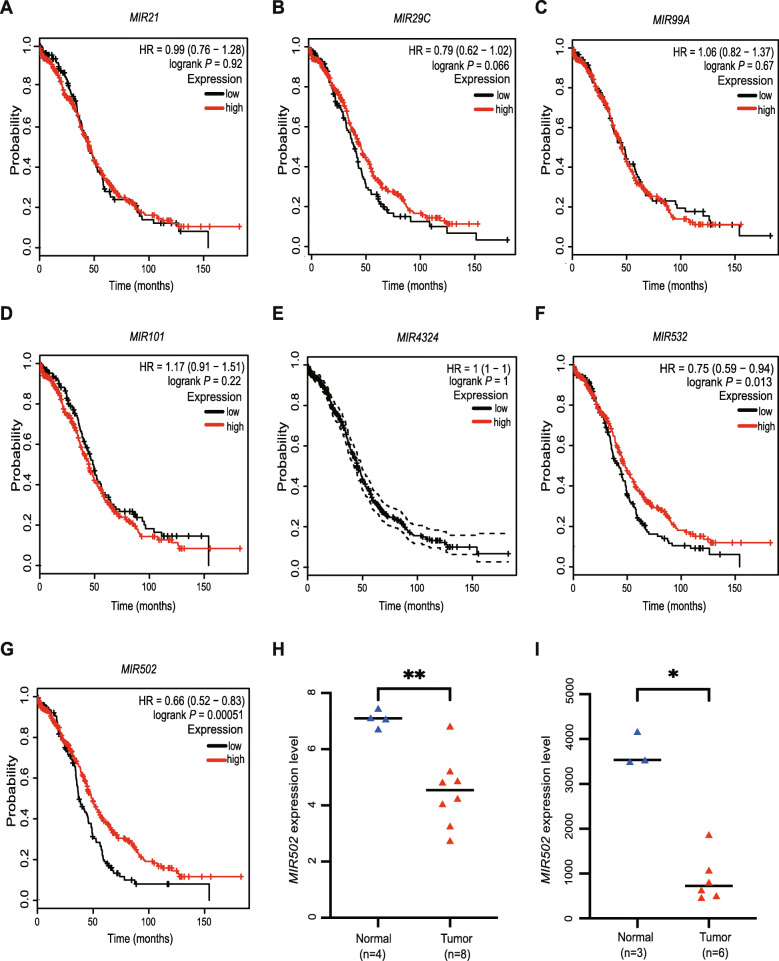
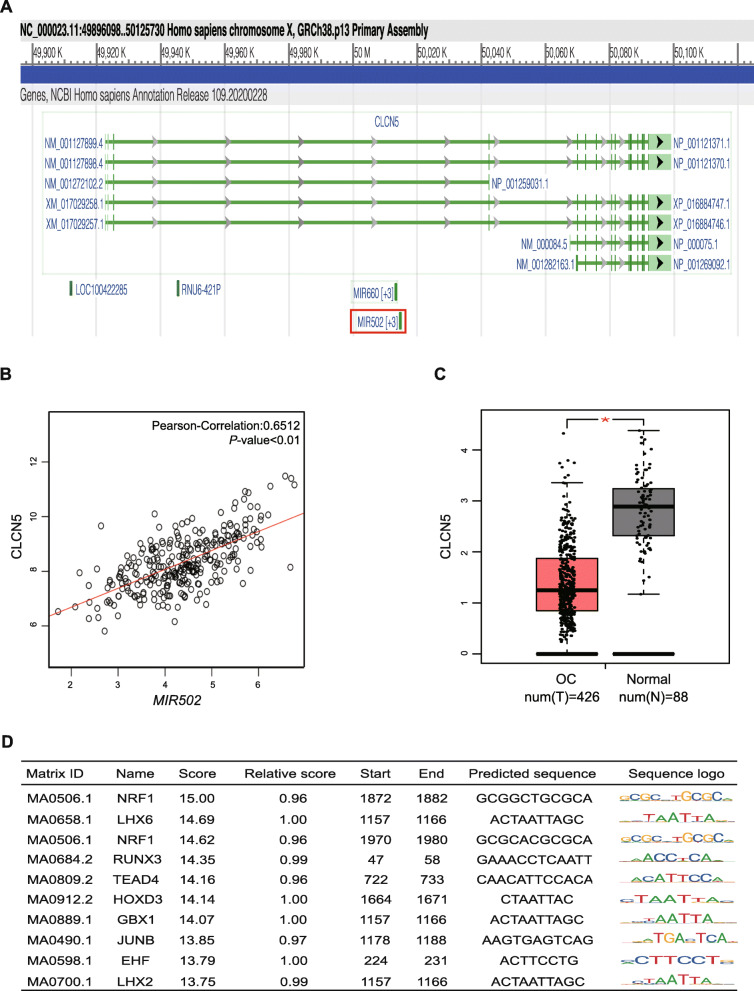
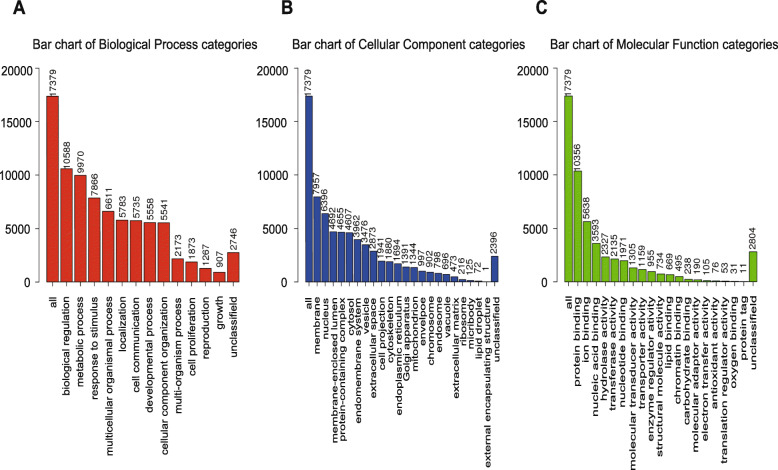
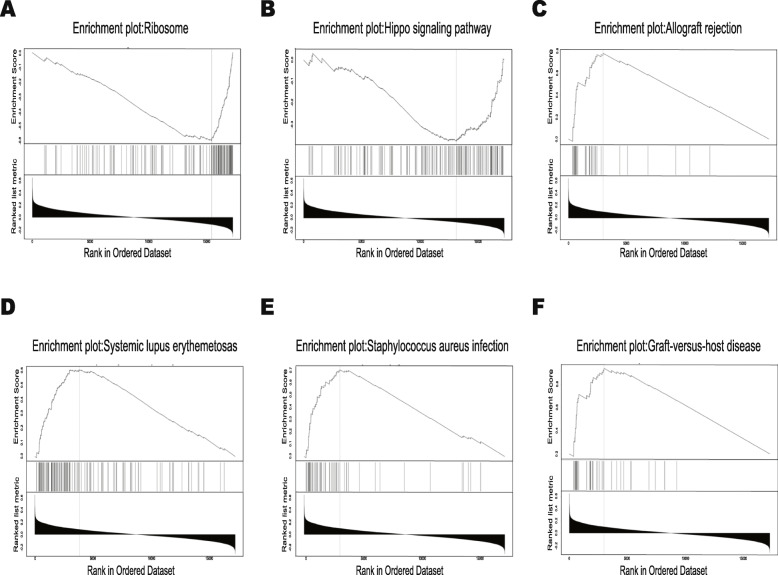
Methods: We integrated two microRNA expression arrays from GEO to identify differentially expressed genes. The Kaplan-Meier method was used to screen for miRNAs that had an influence on survival outcome. Upstream regulators of MIR502 were predicted by JASPAR and verified by ChIP-seq data. The LinkedOmics database was used to study genes that were correlated with MIR502. Gene Set Enrichment Analysis (GSEA) was conducted for functional annotation with GO and KEGG pathway enrichment analyses by using the open access WebGestalt tool. We constructed a PPI network by using STRING to further explore the core proteins.

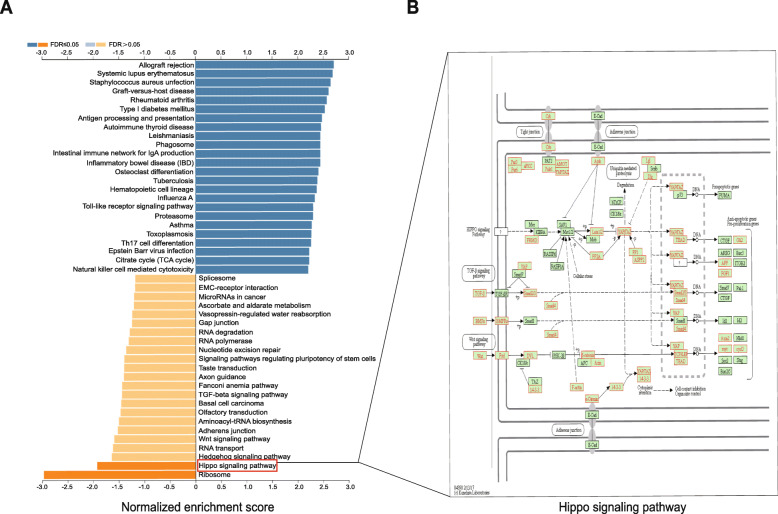
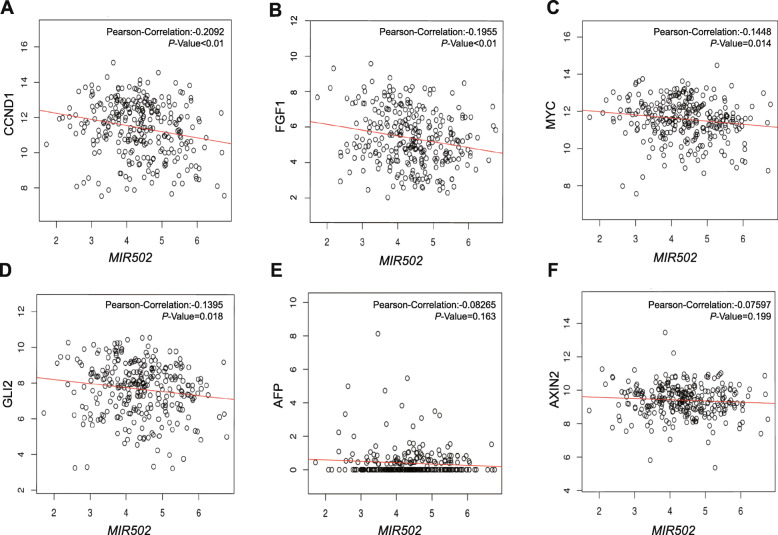
Results: We found that the expression level of MIR502 was significantly downregulated in OC, which was related to poor overall survival. NRF1, as an upstream regulator of MIR502, was predicted by JASPAR and verified by ChIP-seq data. In addition, anti-apoptosis and pro-proliferation genes in the Hippo signalling pathway, including CCND1, MYC, FGF1 and GLI2, were negatively regulated by MIR502, as shown in the GO and KEGG pathway enrichment results. The PPI network further demonstrated that CCND1 and MYCN were at core positions in the development of ovarian cancer.

Conclusions: MIR502, which is regulated by NRF1, acts as a tumour suppressor gene to accelerate apoptosis and suppress proliferation by targeting the Hippo signalling pathway in ovarian cancer.

Keywords: Hippo signalling pathway; MIR502; NRF1; Ovarian cancer.


Conflict of interest statement

The authors declare that they have no competing interests.

Figures

Fig. 1
Fig. 1
The expression level of MIR502 is lower in ovarian cancer tissue comparing with normal ovary tissue. a-b Volcano plots of detectable genome-wide miRNA profiles in ovarian cancer tissue and normal ovarian tissue samples from GSE83693 and GSE119055, respectively. Green and red plots represent aberrantly expressed miRNAs with P < 0.05 and |log2(FC)| > 2. Green plots indicate downregulated genes, red plots indicate upregulated genes, and grey plots indicate normally expressed miRNAs. c Venn diagram of GSE83693 and GSE119055, d Detailed information of seven common different expression miRNAs are listed
Fig. 2
Fig. 2
Expression of MIR502 affected the overall survival of OC patients. Kaplan-Meier analysis of overall survival (OS) in OC patients based on the K-M plotter dataset. a-eMIR21, MIR29c, MIR99a, MIR101 and MIR4324 expression is not correlated with OS in OC patients. fMIR532 is positively correlated with OS in OC patients, P < 0.05. gMIR502 is positively correlated with OS in OC patients, P < 0.01. h The expression level of MIR502 in normal and ovarian cancer tissues from GSE83693 (normal tissues, n = 4; OC tissues, n = 8, P < 0.01). I The expression level of MIR502 in normal and ovarian cancer tissues from GSE119055 (normal tissues, n = 3; OC tissues, n = 6, P < 0.05). **P < 0.01, *P < 0.05
Fig. 3
Fig. 3
Genes correlated with MIR502 in ovarian cancer. a Pearson test was used to analyse correlations between MIR502 and genes differentially expressed in ovarian cancer. b-c Heat maps showing genes positively and negatively correlated with MIR502 in ovarian cancer (TOP 50). Red indicates positively correlated genes and blue indicates negatively correlated genes
Fig. 4
Fig. 4
MIR502 was closely related to CLCN5. aMIR502 hosted in the CLCN5 gene. b Correlation of the expression levels of MIR502 and CLCN5. c Expression level of CLCN5 in ovarian cancer (number = 426) and normal ovary tissues (number = 88), P < 0.05. D Predicted transcription factors of CLCN5
Fig. 5
Fig. 5
NRF1 acted as a transcription factor of CLCN5. a The upper part of the picture shows the NRF1 binding sequence, and the lower table shows the prediction of NRF1 binding sites within the promoter region of CLCN5 provided by the JASPAR database. b Positive correlation of the expression levels of CLCN5 and NRF1. c Analysis of CLCN5 ChIP-seq data from K562, T47D, HepG2, HCC1954 and HeLa cells at the CLCN5 promoter from Cistrome Data Browser databases
Fig. 6
Fig. 6
GO term analysis of correlated genes with MIR502 in ovarian cancer. a For biological process categories. b For cellular component categories. c For molecular function categories
Fig. 7
Fig. 7
KEGG pathway analysis and Hippo signalling pathway. a Bar of KEGG analysis of MIR502 correlated genes-associated pathways. b Hippo signalling pathway diagram
Fig. 8
Fig. 8
GSEA analysis of MIR502 correlated expressed genes. a Ribosome, NSE = -2.728, P = 0. b Hippo signalling pathway, NSE = -1.7788, P = 0. c Allograft rejection, NSE = 2.188, P = 0. d Systemic lupus erythematosus, NSE = 2.255, P = 0. e Staphylococcus aureus infection, NSE = 2.208, P = 0. f Graft-versus-host disease, NSE = 2.149, P = 0
Fig. 9
Fig. 9
MIR502 regulated CCND1, FGF1, MYC and GLI2. Correlation of the expression levels of MIR502 and Hippo signalling pathway downstream genes, including CCND1, FGF1, MYC, GLI2, AFP and AXIN2. Data were analysed using Pearson’s R correlation. *, P < 0.05; **, P < 0.01; ***, P < 0.001
Fig. 10
Fig. 10
CCND1 and MYCN were at the core position in the PPI network. a Venn diagram of predicted target genes of MIR502 by using miRanda, miRWalk, PICTAR5, Targetscan and DIANAmT, 860 common genes were selected. b Venn diagram of 860 common predicted target genes and 1501 overexpression genes in ovarian cancer obtained from GEPIA, 44 common genes were selected as hub genes. c The protein–protein interaction networks of 44 hub genes of MIR502 in ovarian cancer. Nodes represent gene-encoded proteins. Connections between nodes represent the relationship between proteins. A bolder line implies a higher confidence level

References

    1. La Vecchia C. Ovarian cancer: epidemiology and risk factors. Eur J Cancer Prev. 2017;26:55–62. - PubMed
    1. Smith RA, Andrews KS, Brooks D, Fedewa SA, Manassaram‐Baptiste D, Saslow D, et al. Cancer screening in the United States, 2018: a review of current American Cancer Society guidelines and current issues in cancer screening. CA Cancer J Clin. 2018;68:297–316. - PubMed
    1. Han CY, Patten DA, Richardson RB, Harper ME, Tsang BK. Tumor metabolism regulating chemosensitivity in ovarian cancer. Genes Cancer. 2018;9:155–175. - PMC - PubMed
    1. Bartel DP. MicroRNAs: target recognition and regulatory functions. Cell. 2009;136:215–233. - PMC - PubMed
    1. Pasquinelli AE. MicroRNAs and their targets: recognition, regulation and an emerging reciprocal relationship. Nat Rev Genet. 2012;13:271–282. - PubMed

MeSH terms