. 2020 Aug 19;40(34):6503-6521.
doi: 10.1523/JNEUROSCI.3006-19.2020. Epub 2020 Jul 13.

A Developmental Analysis of Juxtavascular Microglia Dynamics and Interactions with the Vasculature

Affiliations

A Developmental Analysis of Juxtavascular Microglia Dynamics and Interactions with the Vasculature

Erica Mondo et al. J Neurosci. .

Abstract

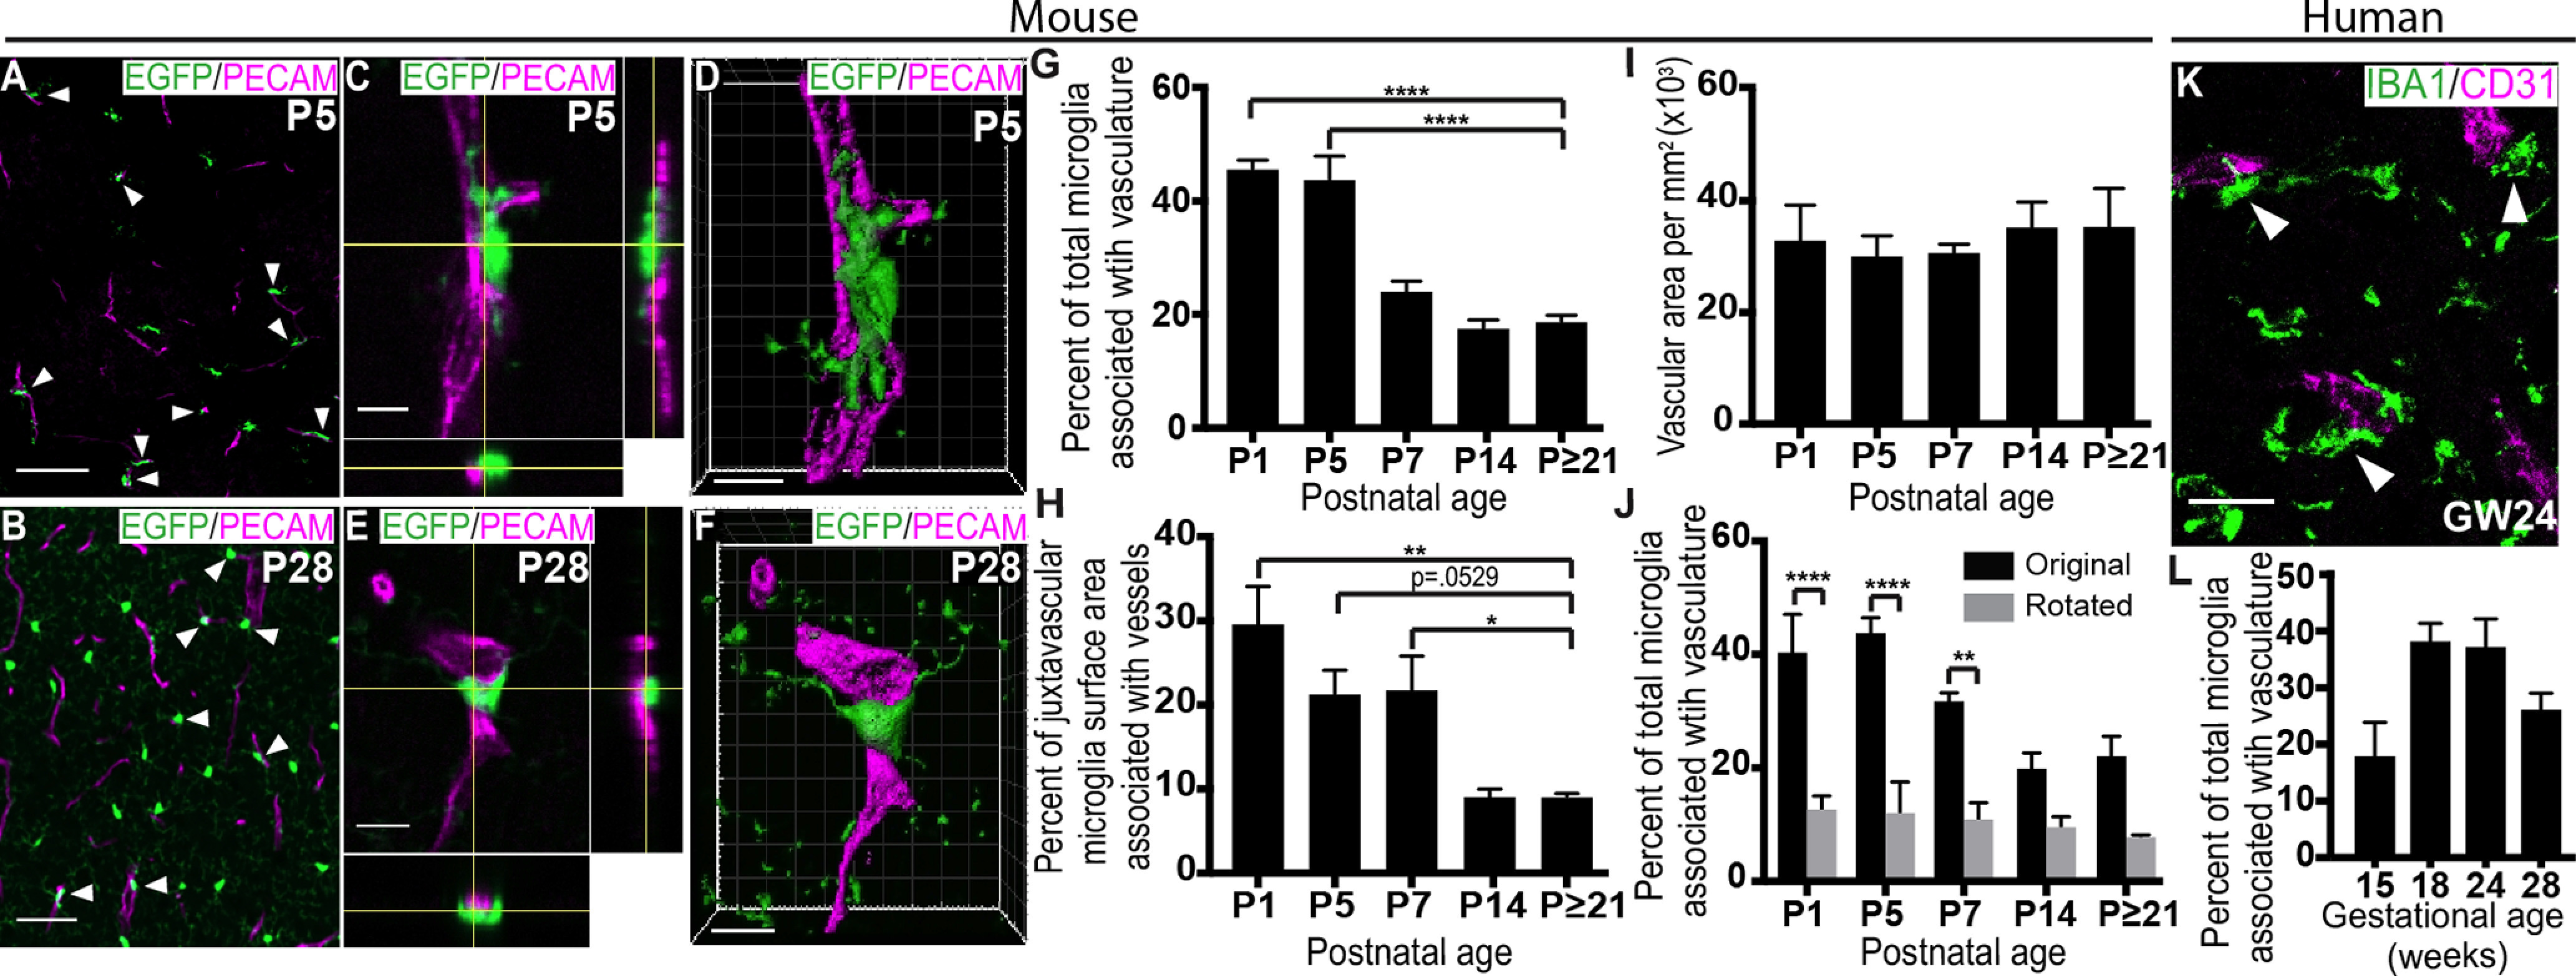
Microglia, a resident CNS macrophage, are dynamic cells, constantly extending and retracting their processes as they contact and functionally regulate neurons and other glial cells. There is far less known about microglia-vascular interactions, particularly under healthy steady-state conditions. Here, we use the male and female mouse cerebral cortex to show that a higher percentage of microglia associate with the vasculature during the first week of postnatal development compared with older ages and that the timing of these associations is dependent on the fractalkine receptor (CX3CR1). Similar developmental microglia-vascular associations were detected in the human brain. Using live imaging in mice, we found that juxtavascular microglia migrated when microglia are actively colonizing the cortex and became stationary by adulthood to occupy the same vascular space for nearly 2 months. Further, juxtavascular microglia at all ages associate with vascular areas void of astrocyte endfeet, and the developmental shift in microglial migratory behavior along vessels corresponded to when astrocyte endfeet more fully ensheath vessels. Together, our data provide a comprehensive assessment of microglia-vascular interactions. They support a mechanism by which microglia use the vasculature to migrate within the developing brain parenchyma. This migration becomes restricted on the arrival of astrocyte endfeet such that juxtavascular microglia become highly stationary and stable in the mature cortex.SIGNIFICANCE STATEMENT We report the first extensive analysis of juxtavascular microglia in the healthy, developing, and adult brain. Live imaging revealed that juxtavascular microglia within the cortex are highly motile and migrate along vessels as they are colonizing cortical regions. Using confocal, expansion, super-resolution, and electron microscopy, we determined that microglia associate with the vasculature at all ages in areas lacking full astrocyte endfoot coverage and motility of juxtavascular microglia ceases as astrocyte endfeet more fully ensheath the vasculature. Our data lay the fundamental groundwork to investigate microglia-astrocyte cross talk and juxtavascular microglial function in the healthy and diseased brain. They further provide a potential mechanism by which vascular interactions facilitate microglial colonization of the brain to later regulate neural circuit development.

Keywords: astrocytes; development; microglia; neural-immune; vasculature.


Figures

Figure 1.
Figure 1.
A high percentage of microglia is juxtavascular during early postnatal development. A, B, Representative low-magnification tiled images of microglia (green, EGFP) associated with vasculature (magenta, anti-PECAM) in the P5 (A) and P28 (B) frontal cortex. Filled arrowheads denote juxtavascular microglia. Scale bars: A, 100 μm; B, 50 μm. C, D, High-magnification, orthogonal view (C) and 3D reconstruction and surface rendering (D) of juxtavascular microglia in the P5 frontal cortex (Movie 1). Scale bars, 10 μm. E, F, Orthogonal (E) and 3D reconstruction and surface rendering (F) of a juxtavascular microglia in the P28 frontal cortex (Movie 2). Scale bars, 10 μm. G, The percentage of the total microglia population associated with vasculature over development in the frontal cortex. One-way ANOVA with Dunnett's post hoc test; comparison with P21 or greater, n = 4 littermates per developmental time point, ****p < 0.0001. H, Quantification of the percentage of juxtavascular microglia surface area associating with vessels over development in the frontal cortex in 3D reconstructed confocal images. One-way ANOVA with Dunnett's post hoc test; comparison with P21 or greater, n = 3 littermates per developmental time point, *p = 0.0445, **p = .0025. I, Vascular density over development in the frontal cortex. One-way ANOVA with Dunnett's post hoc test; comparison with P21 or greater, n = 4 littermates per developmental time point. J, The percentage of total microglia associated with vasculature that occurs by chance in the frontal cortex over development. Two-way ANOVA with a Sidak's post hoc test; n = 4 littermates per developmental time point, **p = 0.0022, ****p < .0001. K, Representative image of microglia (green, anti-IBA1) associated with vasculature (magenta, anti-CD31) in GW 24 in the ventricular zone (VZ) and subventricular zone (SVZ) at the level of the human frontal cortex. Filled arrowheads denote juxtavascular microglia. Scale bar, 20 μm. L, Quantification of the percentage of total microglia associated with vasculature in the human brain. One-way ANOVA across all ages, p = 0.0544, n = 3–6 fields of view per gestational age (1 individual specimen per gestational age). All error bars represent ±SEM.
Figure 2.
Figure 2.
Juxtavascular microglia predominantly associate with capillaries in the postnatal cortex. Ai–Aiii, A representative image of a juxtavascular microglia (filled arrowhead) in the P5 frontal cortex. Microglia are labeled using the Cx3cr1EGFP/+ reporter mouse (green; Ai) and immunolabeling for a microglia-specific marker anti-P2RY12 (red; Aii). The vasculature is labeled with anti-PECAM (magenta) in the merged image (Aiii). Scale bar, 10 μm. B, A representative image of LYVE1-negative microglia (green, EGFP; filled arrowheads; Bi) and LYVE1-positive perivascular macrophages (gray, anti-LYVE1; unfilled arrowheads; Bii) associated with vasculature (magenta, anti-PECAM; Biii) in the P5 frontal cortex. Scale bar, 10 μm. C, Quantification of juxtavascular microglia across development labeled either with EGFP in Cx3cr1 EGFP/+ mice (black bars) or anti-P2RY12 in wild-type (WT) mice (white bars) frontal cortices. Two-way ANOVA with a Sidak's post hoc test; n = 3–4 littermates per genotype per developmental time point. D, Quantification of vascular density in Cx3cr1 EGFP/+ (black bars) and WT (white bars) frontal cortices over development. Two-way ANOVA with a Sidak's post hoc test; n = 3–4 littermates per genotype per developmental time point. E, Quantification of the percentage of juxtavascular microglia associated with branched (black bars) or unsegmented (gray bars) vessels. Two-way ANOVA with a Sidak's post hoc test; n = 3–4 littermates per developmental time point, *p = 0.0118, ***p = 0.0003, ****p < 0.0001. F, A representative image of a juxtavascular microglia (green, EGFP; filled arrowhead) associated with smooth muscle cell actin-negative (gray, SMA) capillaries (magenta, PDGFRβ) in the P5 frontal cortex. Scale bar, 10 μm. G, Quantification of the percentage of juxtavascular microglia associated with SMA+ or SMA vessels at P5 and P21 or greater in the frontal cortex. Two-way ANOVA with a Sidak's post hoc test; n = 3 littermates per genotype per developmental time point, ****p < 0.0001. H, Quantification of the percentage of juxtavascular microglia associated with vessels ≤8 and >8 μm at P5 and P21 or greater in the frontal cortex. Two-way ANOVA with a Sidak's post hoc test; n = 4 littermates per genotype per developmental time point, ****p < 0.0001. All error bars represent ±SEM.
Figure 3.
Figure 3.
Microglia associate and align with vasculature as they colonize the cortex in a rostral-to-caudal gradient. Ai–Aiii, Tiled sagittal sections of a P1 (Ai), P7 (Aii), and P14 (Aiii) Cx3cr1EGFP/+ brain. The dotted yellow and red lines outline the frontal and somatosensory cortex, respectively. Scale bars, 400 μm. B, C, Left, y-Axis and gray bars: quantification of microglial density over development in the frontal cortex (B) and somatosensory cortex (C). One-way ANOVA with Dunnett's post hoc test; comparison with P21 or greater, n = 4 littermates per developmental time point, *p = 0.0182, **p = 0.0062, ****p < 0.0001. Right, y-Axis and black line graphs: the percentage of the total microglia population associated with vasculature over development in the frontal cortex (B) and somatosensory cortex (C). Note, data corresponding to the percentage of juxtavascular microglia in the frontal cortex (C, line graph) are the same as presented in Figure 1G. One-way ANOVA with Dunnett's post hoc test; comparison with P21 or greater, n = 4 littermates per developmental time point, ++++p < 0.0001. Di–Eii, Representative images of juxtavascular microglia (EGFP; Di, Ei, green, Dii, Eii, black) primary processes aligned parallel with vessels (Di, Dii, magenta, anti-PECAM) in the P5 frontal cortex, which were largely not aligned at P28 (Ei, Eii). Filled arrowheads denote processes aligned parallel to the vessel and unfilled arrowheads denote those microglial processes that are not aligned with the vessel. The dotted magenta line in Dii and Eii outline the vessel in Di and Ei. Scale bars, 10 μm. F, G, Quantification of the percentage of juxtavascular primary processes that are aligned parallel with vessels in the frontal (F) and somatosensory (G) cortices over development. One-way ANOVA with Dunnett's post hoc test; comparison with P21 or greater, n = 4 littermates per developmental time point; frontal cortex: **p = 0.0021 (P1), **p = 0.0033 (P5), somatosensory cortex: ***p = 0.0003, ****p < 0.0001). All error bars represent ±SEM.
Figure 4.
Figure 4.
A high percentage of microglia associates with vasculature as they are recruited to synapses in the cortex and the timing is regulated by CX3CR1. Ai, Aii, Layer IV of the barrel cortex contains thalamocortical synapses, which form a highly precise synaptic map of the vibrissae (whiskers) on the snout. Aiii, A low-magnification representative image of a tangential section through layer IV of the barrel cortex shows that layer IV thalamocortical presynaptic terminals (red, anti-VGluT2) form discrete barrel structures corresponding to each whisker, which are separated by septa where thalamocortical terminals are largely absent. Microglia are labeled by EGFP (green) and the vasculature is labeled with anti-PECAM (gray). White box denotes a single barrel. Scale bar, 100 μm. B, Quantification of the number of microglia per mm2 within the barrel centers in developing Cx3cr1+/− mice (black bars) and Cx3cr1−/− mice (gray bars). Two-way ANOVA with a Sidak's post hoc test; n = 4 littermates per genotype per developmental time point; **p = 0.0049, ***p = 0.0004. Ci–Div, Representative images of quantification in B. Images are zoomed in to show single barrels within tangential sections of layer IV of the barrel cortex (Aiii, white box) where microglia (green) are recruited to barrel centers in Cx3cr1+/− by P7 (Ci–Civ) and in Cx3cr1−/− by P8 (Di–Div). Asterisks denote microglia located within barrel centers. The dotted yellow lines denote the perimeters of the VGluT2+ thalamocortical inputs (red), which define the barrels versus the septa. Scale bars, 30 μm. Ei–Fiv, The same representative fields of view as in Ci–Div but lacking the anti-VGluT2 channel and, instead, including the channel with anti-PECAM immunostaining (magenta) to label the vessels. Microglia are still labeled with EGFP (green). Dotted yellow lines still denote the perimeters of the VGluT2+ barrels (Ci–Div, red). Juxtavascular microglia in Cx3cr1+/− mice (Ei–Eiv) and Cx3cr1−/− mice (Fi–Fiv) are denoted by filled arrowheads. Scale bar, 30 μm. G, Quantification of the percentage of microglia associated with the vasculature in Cx3cr1+/− animals (black lines) and Cx3cr1–/– animals (gray lines) over development in layer IV of the barrel cortex demonstrates a peak of vascular association in Cx3cr1+/− mice at P5–P6, which is delayed to P7–P8 in Cx3cr1−/− mice coincident with delayed microglial recruitment to barrel centers. Two-way ANOVA with a Tukey's post hoc test; n = 4–5 littermates per genotype per developmental time point; *p = 0.0173 (P7), *p = 0.0187 (P8), **p = 0.0027, ****p < 0.0001, compared with P9 Cx3cr1+/− mice. H, I, Quantification of microglial density (H) and vascular density (I) in Cx3cr1+/− animals (black bars) and Cx3cr1−/− animals (gray bars) over development in layer IV of the barrel cortex. Two-way ANOVA with a Sidak's post hoc test; n = 4 littermates per genotype per developmental time point. All error bars represent ±SEM.
Figure 5.
Figure 5.
Juxtavascular microglia migrate along blood vessels as they colonize the developing brain and are largely stationary in adulthood. A, A schematic of the live-imaging experiment. Cx3cr1EGFP/+ mice received a retro-orbital injection of Texas red-labeled dextran to label the vasculature 10 min before acute slice preparation. Coronal somatosensory cortices were then imaged every 5 min over 6 h immediately following slice preparation. Bi–Cvii, Representative fluorescent images from a 6 h live-imaging session from a P7 (Bi–Bvii) and P120 or greater (Ci–Cvii) slice. Filled arrowheads indicate microglial soma position at t = 0. Unfilled arrowheads indicate the location of the same microglial soma at 0 h (Bi, Ci), 1 h (Bii, Cii), 2 h (Biii, Ciii), 3 h (Biv, Civ), 4 h (Bv, Cv), 5 h (Bvi, Cvi), and 6 h (Bvii, Cvii; Movies 3, 4, 5, 6). Scale bars, 30 μm. D, Quantification of juxtavascular (black bars) and vascular-unassociated (gray bars) microglia soma motility speed/velocity. Two-way ANOVA with a Sidak's post hoc test; n = 4 mice per time point; **p = 0.0081 (stationary), **p = 0.0013 (0–3 μm/h), **p = 0.0015 (5–7.5 μm/h), ***p = 0.0005 (3–5 μm/h). E, Quantification of the distance traveled of juxtavascular (black bars) and vascular-unassociated (gray bars) microglia somas in the P7 somatosensory cortex. Two-way ANOVA with a Sidak's post hoc test; n = 4 mice; **p = 0.0041, ****p < 0.0001. F, Quantification of migratory juxtavascular microglia trajectory angles in the P7 somatosensory cortex. Unpaired Student's t test; n = 4 mice per time point; ****p < 0.0001. G, A schematic of a short-term two-photon live-imaging experiment in adult cortex of awake, behaving mice. Cx3cr1EGFP/+ mice received a retro-orbital injection of Texas Red-labeled dextran to label the vasculature 10 min before each imaging session. EGFP+ juxtavascular microglia were then imaged every 5 min for 2 h through a cranial window (Movie 7). H, Quantification of the percentage of juxtavascular (black bars) and vascular-unassociated (gray bars) microglia that remain stationary for 2 h. Unpaired Student's t test; n = 3 mice per developmental time point. I, A schematic of the long-term two-photon live-imaging experiment in adult visual cortex. Cx3cr1EGFP/+ mice received a retro-orbital injection of Texas Red-labeled dextran to visualize the vasculature 10 min before each imaging session. EGFP+ juxtavascular microglia were then imaged for 6 weeks through a cranial window. J, Quantification of the percentage of juxtavascular microglia on vessels on day 0 that remain on vessels through 6 weeks of imaging. Data are representative of n = 3 mice. Ki–Kvii, Representative fluorescent images acquired during a 6-week live-imaging session from a single mouse. Filled arrowheads indicate juxtavascular microglia that remain on vessels for 6 weeks. Unfilled arrowhead, A juxtavascular microglia that changes position, but remains on the vasculature, for over 6 weeks. L, Quantification of the nearest neighbor distance between juxtavascular and vascular-unassociated microglia in static confocal images. Paired Student's t test; n = 4 littermates, *p = 0.0239. All error bars represent ±SEM.
Figure 6.
Figure 6.
Juxtavascular microglia associate with the cortical vasculature in areas lacking full astrocytic endfoot coverage. Ai–Civ, Representative single-optical plane images and 3D rendering (Aiv–Civ; Movies 8, 9, 10) of juxtavascular microglia (green, EGFP) and blood vessels (magenta, anti-PDGFRβ) in areas void of astrocytic endfoot labeling (gray, anti-AQP4) in the frontal cortex at P5 (Ai–Aiv), P7 (Bi–Biv), and P28 (Ci–Civ). Filled arrowheads denote vascular areas that lack astrocyte endfeet where juxtavascular microglia are associated with the vessel. Scale bars, 10 μm. D, Left, y-axis, Gray bars: quantification of the percentage of blood vessels covered by astrocyte endfeet over development in the frontal cortex. One-way ANOVA with Dunnett's post hoc test; comparison with P21 or greater, n = 3 littermates per developmental time point, ***p = 0.0005, ****p < 0.0001. Right, y-axis, Black line: the percentage of the total microglia population that are juxtavascular over development in the frontal cortex (data are the same as presented in Fig. 1G). One-way ANOVA with Dunnett's post hoc test; comparison with P21 or greater, n = 4 littermates per developmental time point, ++++p < 0.0001. E, Quantification of the percentage of juxtavascular microglia associated with vessels only, vessels and astrocyte endfeet (representative images in Aiv–Civ), and astrocyte endfeet only from 3D-rendered images. F, Quantification of the percentage of blood vessel area associated with astrocyte endfeet (black bars), juxtavascular microglia (gray bars), or uncovered vessels (white bars) in the frontal cortex over development. Gi–Jiii, Representative ExM (GiHiii) and SIM (IiJiii) images of juxtavascular microglia (green, EGFP) in vascular areas lacking anti-AQP4 (gray) astrocytic endfoot labeling (filled arrowheads) in the P5 (GiIiii) and P28 (HiJiii) frontal cortex. Scale bars, 10 μm. All error bars represent ±SEM.
Figure 7.
Figure 7.
Ultrastructural analysis by EM reveals that juxtavascular microglia directly contact the basal lamina of the vasculature. Ai–Biii, EM of juxtavascular microglia (green pseudocoloring) contacting the basal lamina (purple line) of a blood vessel in an area void of astrocyte endfeet (blue pseudocoloring) in the P5 (Ai–Aiii, left column) and P56 (BiBiii, right column) frontal cortex. Pink pseudocoloring denotes pericytes and yellow pseudocoloring dentoes endothelial cells. Asterisks denote microglia nuclei. Scale bar, 5 μm. The black box denotes the magnified inset in the bottom right corner where microglia (green pseudocoloring) directly contact the basal lamina (unlabeled in the inset) and only partially contacts the astrocyte endfoot (blue pseudocoloring). Scale bar, 1 μm. Ci, Cii, 3D reconstruction of serial EM of P5 juxtavascular microglia (green pseudocoloring) in Aiii (Ci) and P56 juxtavascular microglia in Biii (Cii) contacting a blood vessel in an area void of astrocyte endfeet (blue pseudocoloring; Movies 11, 12). Red and tan pseudocoloring denotes a pericyte and vessel lumen, respectively. D, Quantification of the percentage of juxtavascular microglia contacting the basal lamina in single-optical plane images. Unpaired student's t test; n = 29 cells (P5) and n = 11 cells (P56); *p = 0.0155. All error bars represent ±SEM.

References

    1. Abbott NJ, Rönnbäck L, Hansson E (2006) Astrocyte–endothelial interactions at the blood–brain barrier. Nat Rev Neurosci 7:41–53. 10.1038/nrn1824 - DOI - PubMed
    1. Abdel-Haq R, Schlachetzki JCM, Glass CK, Mazmanian SK (2019) Microbiome–microglia connections via the gut–brain axis. J Exp Med 216:41–59. 10.1084/jem.20180794 - DOI - PMC - PubMed
    1. Adams RA, Bauer J, Flick MJ, Sikorski SL, Nuriel T, Lassmann H, Degen JL, Akassoglou K (2007) The fibrin-derived γ 377-395 peptide inhibits microglia activation and suppresses relapsing paralysis in central nervous system autoimmune disease. J Exp Med 204:571–582. 10.1084/jem.20061931 - DOI - PMC - PubMed
    1. Alliot F, Godin I, Pessac B (1999) Microglia derive from progenitors, originating from the yolk sac, and which proliferate in the brain. Brain Res Dev Brain Res 117:145–152. 10.1016/S0165-3806(99)00113-3 - DOI - PubMed
    1. Armulik A, Genové G, Mäe M, Nisancioglu MH, Wallgard E, Niaudet C, He L, Norlin J, Lindblom P, Strittmatter K, Johansson BR, Betsholtz C (2010) Pericytes regulate the blood–brain barrier. nature 468:557–561. 10.1038/nature09522 - DOI - PubMed

Publication types

Substances