. 2020 Sep 18;88(10):e00133-20.
doi: 10.1128/IAI.00133-20. Print 2020 Sep 18.

A Role of Epithelial Cells and Virulence Factors in Biofilm Formation by Streptococcus pyogenes In Vitro

Affiliations

A Role of Epithelial Cells and Virulence Factors in Biofilm Formation by Streptococcus pyogenes In Vitro

Feiruz Alamiri et al. Infect Immun. .

Abstract

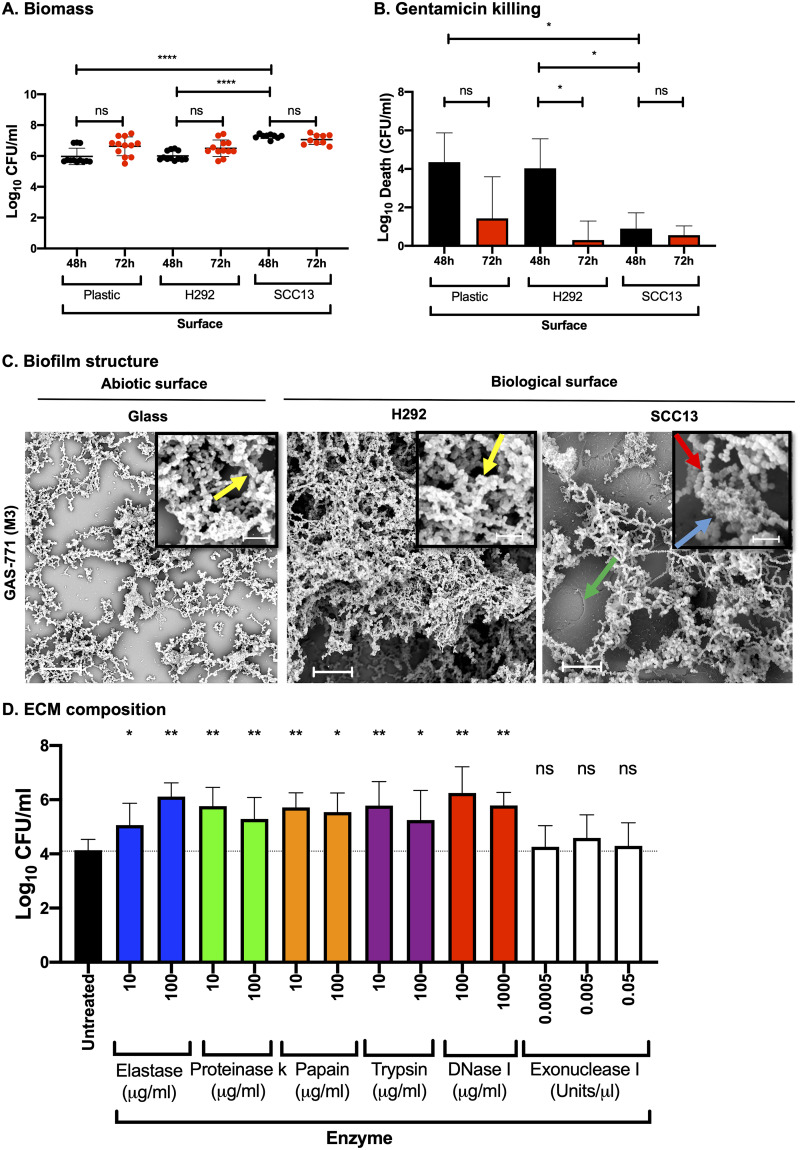
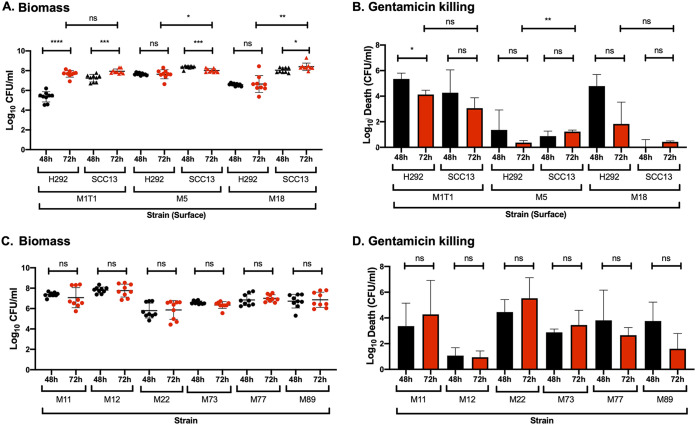
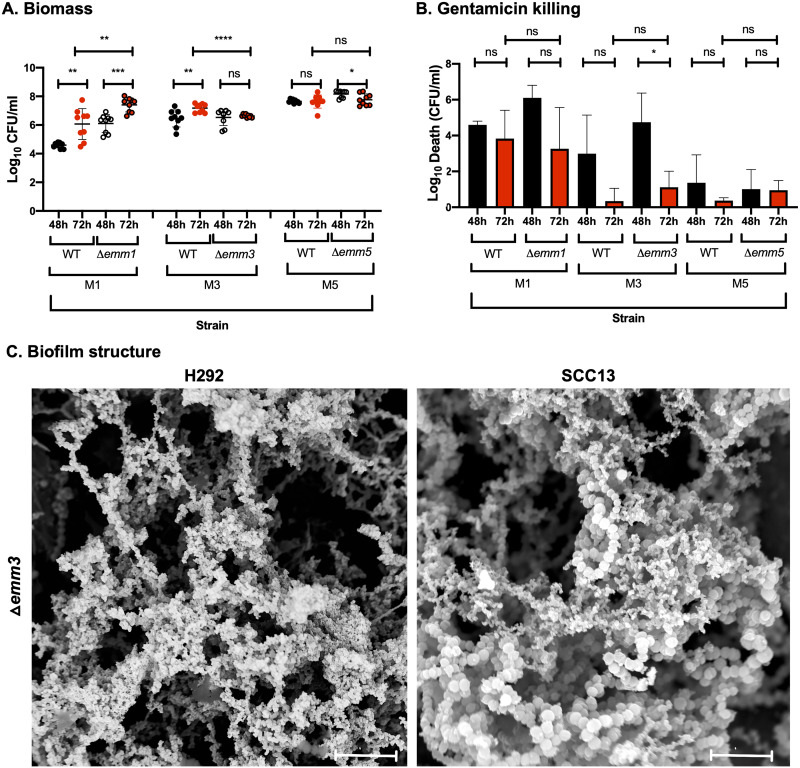
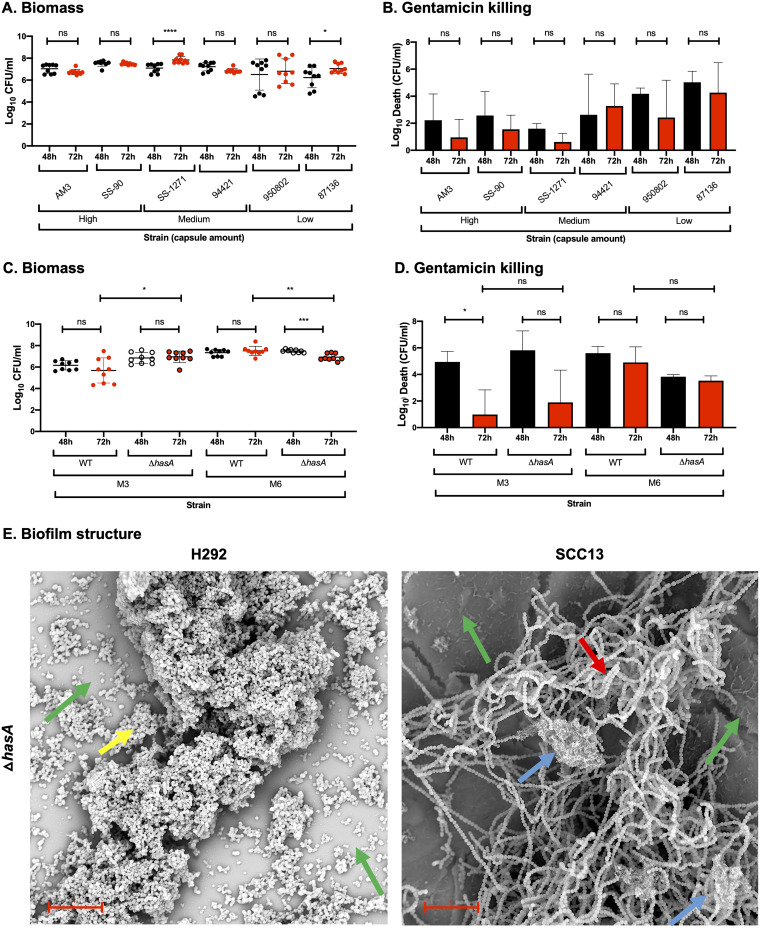
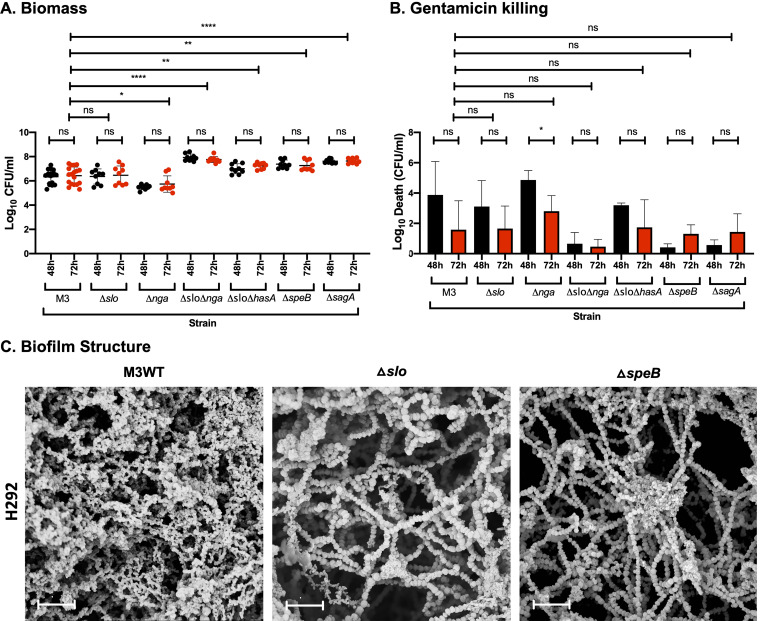
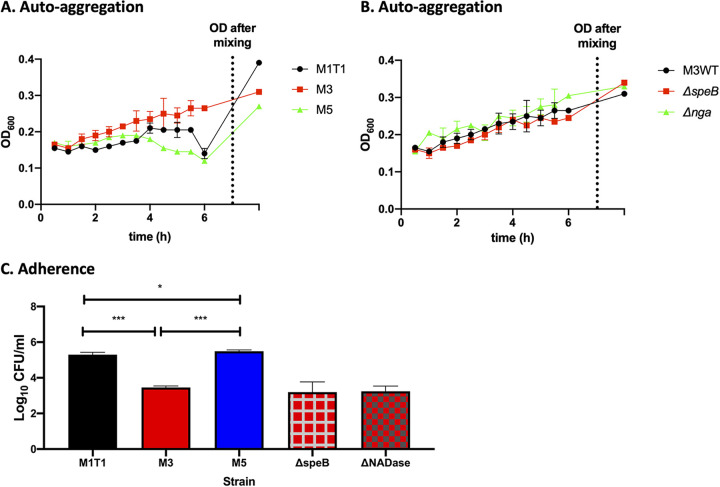
Biofilm formation by Streptococcus pyogenes (group A streptococcus [GAS]) in model systems mimicking the respiratory tract is poorly documented. Most studies have been conducted on abiotic surfaces, which poorly represent human tissues. We have previously shown that GAS forms mature and antibiotic-resistant biofilms on physiologically relevant epithelial cells. However, the roles of the substratum, extracellular matrix (ECM) components, and GAS virulence factors in biofilm formation and structure are unclear. In this study, biofilm formation was measured on respiratory epithelial cells and keratinocytes by determining biomass and antibiotic resistance, and biofilm morphology was visualized using scanning electron microscopy. All GAS isolates tested formed biofilms that had similar, albeit not identical, biomass and antibiotic resistance for both cell types. Interestingly, functionally mature biofilms formed more rapidly on keratinocytes but were structurally denser and coated with more ECM on respiratory epithelial cells. The ECM was crucial for biofilm integrity, as protein- and DNA-degrading enzymes induced bacterial release from biofilms. Abiotic surfaces supported biofilm formation, but these biofilms were structurally less dense and organized. No major role for M protein, capsule, or streptolysin O was observed in biofilm formation on epithelial cells, although some morphological differences were detected. NAD-glycohydrolase was required for optimal biofilm formation, whereas streptolysin S and cysteine protease SpeB impaired this process. Finally, no correlation was found between cell adherence or autoaggregation and GAS biofilm formation. Combined, these results provide a better understanding of the role of biofilm formation in GAS pathogenesis and can potentially provide novel targets for future treatments against GAS infections.

Keywords: Streptococcus pyogenes; adherence; aggregation; antibiotic resistance; biofilm formation; biofilm structure; biofilms; epithelial cells; extracellular matrix; keratinocytes; mucosal pathogens; respiratory tract; virulence factors.


Figures

FIG 1
FIG 1
Streptococcus pyogenes biofilm development, structure, and composition on abiotic versus biological surfaces. Biofilms were formed using S. pyogenes strain GAS-771 on abiotic (plastic) or biological (prefixed H292 cells or SCC13 keratinocytes) surfaces for various times at 34°C in CDM. (A) Biomass formation was evaluated by determining the log10 CFU per milliliter at 48 h (black dots) or 72 h (red dots). Data are from three separate experiments with three individual biofilms each (with standard deviations [SD]; n = 9), and data were compared using the Mann-Whitney U test. (B) Determination of gentamicin killing in GAS-771 biofilms was measured by calculating death in log10 CFU per milliliter (i.e., total biomass [CFU/ml] − biofilm biomass [CFU/ml] after treatment with 500 μg/ml gentamicin for 3 h) after 48 h (black bars) or 72 h (red bars). The results are means from three separate experiments of three individual biofilms each (with SD; n = 9), and data were compared using Student's t test. (C) The structure of GAS-771 biofilms formed on abiotic (glass) or biological (prefixed H292 epithelial cells or SCC13 keratinocytes) for 72 h was inspected using SEM (bar = 5 μm). Where visible, underlying cells are indicated by a green arrow. (Insets) Higher magnification (bar = 2 μm) of the biofilms, with arrows highlighting bacterial chains (red), ECM aggregates (blue), or bacterial chains coated with ECM (yellow). (D) To identify components present in the ECM, GAS-771 biofilms formed over 72 h at 34°C on prefixed epithelial H292 cells were treated with a set of proteases (elastase, proteinase K, papain, and trypsin) and DNases (DNase I and exonuclease I) at the indicated concentrations. After incubation, the log10 CFU/ml of bacteria released into the supernatant was determined. The results represent data from three separate experiments of two individual biofilms each (with SD; n = 6), and data were compared using the Mann-Whitney U test. *, P < 0.05; **, P < 0.01; ****, P < 0.0001; ns, nonsignificant difference.
FIG 2
FIG 2
Biofilm growth and antibiotic resistance of different GAS serotypes on prefixed H292 epithelial cells or SCC13 keratinocytes. (A and B) Biofilms were formed over 48 h (black) and 72 h (red) at 34°C for the isolates M1T1 (941079), M5 (Manfredo), and M18 (87-282) on prefixed respiratory H292 cells or SCC13 keratinocytes, and biomass (A) and gentamicin killing (B) were measured by determining log10 CFU per milliliter and log10 death (i.e., the total biomass [CFU/ml] − biofilm biomass [CFU/ml] after treatment with 500 μg/ml gentamicin for 3 h), respectively. (C and D) Biofilms of the erythromycin-resistant clinical isolates M11 (GAS-53), M12 (GAS-6), M22 (GAS-8), M73 (GAS-138), M77 (GAS-125), and M89 (GAS-128) were formed over 48 h (black) and 72 h (red) at 34°C on prefixed epithelial H292 cells and evaluated for biomass (C) and gentamicin killing (D). Data are from three separate experiments with three individual biofilms each. Biomass (A and C) is plotted as individual data points (with SD; n = 9), and groups were compared using the Mann-Whitney U test. Gentamicin killing data are means (with SD; n = 3), and groups were compared using Student's t test. *, P < 0.05; **, P < 0.01; ***, P < 0.001; ****, P < 0.0001; ns, nonsignificant difference.
FIG 3
FIG 3
Role of the M protein in GAS biofilm biomass, antibiotic resistance, and structure in strains lacking or expressing M protein. (A and B) Biofilms of M1 (SF370), M3 (GAS-771), and M5 (Manfredo) strains expressing wild-type M protein (WT) or lacking the M protein (Δemm) were formed over 48 (black) and 72 h (red) at 34°C on prefixed epithelial H292 cells and evaluated for biomass (A) or gentamicin killing (B) by measuring the log10 CFU per milliliter or the log10 death (i.e., total biomass [CFU/ml] − biofilm biomass [CFU/ml] after treatment with 500 μg/ml gentamicin for 3 h), respectively. Data are from three separate experiments with three individual biofilms each. Biomass is plotted as individual data points (with SD; n = 9), and groups were compared using the Mann-Whitney U test. Gentamicin killing data are means (with SD; n = 3), and groups were compared using Student's t test. *, P < 0.05; **, P < 0.01; ***, P < 0.001; ****, P < 0.0001; ns, nonsignificant difference. (C) The structure of biofilms formed by the Δemm3 mutant on different epithelial cells (respiratory H292 cells or SCC13 keratinocytes) for 72 h was viewed using SEM (bar = 5 μm). The cell substratum is not visible in the image due to the focus on capturing the biofilm structures.
FIG 4
FIG 4
Role of capsule in biofilm structure, biomass, and antibiotic resistance in strains lacking or expressing different capsule levels. (A and B) Biofilms of M3 strains expressing various capsule amounts, i.e., high (AM3 and SS-90), medium (SS-1271 and 94421), or low (950802 and 87-136), were formed over 48 (black) and 72 h (red) at 34°C on prefixed epithelial H292 cells and evaluated for biomass (A) or gentamicin killing (B) by measuring the log10 CFU per ml or the log10 death (i.e., the total biomass [CFU/ml] − biofilm biomass [CFU/ml] after treatment with 500 μg/ml gentamicin for 3 h), respectively. (C and D) Biofilms of M3 and M6 strains expressing wild-type capsule (WT) or lacking capsule (ΔhasA) were formed over 48 and 72 h at 34°C on prefixed epithelial H292 cells and evaluated for biomass (C) and gentamicin killing (D), as described above. Data are from three separate experiments with three individual biofilms each. Biomass (A and C) is plotted as individual data points (with SD; n = 9), and groups were compared using the Mann-Whitney U test. Gentamicin killing data (B and D) are means (with SD; n = 3), and groups were compared using Student's t test. *, P < 0.05; **, P < 0.01; ***, P < 0.001; ****, P < 0.0001; ns, nonsignificant difference. (E) Structure of biofilms formed by the M3ΔhasA mutant on different epithelial cells (respiratory H292 cells or SCC13 keratinocytes) for 72 h, viewed using SEM (bar = 10 μm). The underlying cell substratum is indicated by a green arrow, the red arrow highlights bacterial chains, and blue and yellow arrows indicate ECM aggregates alone and cells coated with ECM, respectively.
FIG 5
FIG 5
Role of virulence factors in biofilm formation, structure, and antibiotic resistance on prefixed H292 cells. (A and B) Biofilms of GAS-771 expressing or lacking SLO (Δslo), NADase (Δnga), both SLO and NADase (Δslo Δnga), capsule and SLO (Δslo ΔhasA), SpeB (ΔspeB), or SLS (ΔsagA) were formed over 48 (black) and 72 h (red) and evaluated for biomass (A) or gentamicin killing (B) by measuring the log10 CFU per ml or the log10 death (i.e., total biomass [CFU/ml] − biofilm biomass [CFU/ml] after treatment with 500 μg/ml gentamicin for 3 h), respectively. Data are from three separate experiments with three individual biofilms each. Biomass is plotted as individual data points (with SD; n = 9, except for M3, where n = 18), and groups were compared using the Mann-Whitney U test. Gentamicin killing data are means (with SD; n = 3, except for M3, where n = 6), and groups were compared using Student's t test. *, P < 0.05; **, P < 0.01; ****, P < 0.0001; ns, nonsignificant difference. (C) Biofilms of the GAS-771 strain and its isogenic mutants (Δslo or ΔspeB) were formed on prefixed H292 cells and visualized by SEM (bar = 5 μm). The cell substratum is not visible in the image due to the focus on capturing the biofilm structures.
FIG 6
FIG 6
Correlation between autoaggregation and adhesion of broth-grown planktonic bacteria and biofilm formation in GAS. Aggregation (as determined by sedimentation rate during growth) was monitored by measuring the OD600 of actively growing planktonic bacteria in CDM over time for the M1, M3, and M5 serotypes (A) or the M3 WT (GAS-771) strain and its isogenic ΔspeB and Δnga mutants (B). The final OD600 data point represents the OD600 reading after inversion of each tube at the 6-h time point to produce a homogenous suspension, which provides a measure of the extent of aggregation. (C) To determine the cell adherence properties of these strains, actively growing planktonic bacteria resuspended in RPMI with 2% fetal bovine serum were used to infect live respiratory H292 cells for 1 h at 34°C. Adherence to cells was determined by assessing the log10 CFU per milliliter after plating cell lysates on blood agar plates and determining viable plate counts after growth at 37°C for 48 h. Data are from two separate experiments; n = 2 (A and B), n = 4 (C). One-way ANOVA using Tukey’s multiple-comparison test was used to compare the data sets in panel C, and only significant differences between the wild-type strains are presented. There were no significant changes between M3 and its mutant strains. *, P < 0.05; **, P < 0.01; ***, P < 0.001.

References

    1. Carapetis JR, Steer AC, Mulholland EK, Weber M. 2005. The global burden of group A streptococcal diseases. Lancet Infect Dis 5:685–694. doi: 10.1016/S1473-3099(05)70267-X. - DOI - PubMed
    1. Tan LK, Eccersley LR, Sriskandan S. 2014. Current views of haemolytic streptococcal pathogenesis. Curr Opin Infect Dis 27:155–164. doi: 10.1097/QCO.0000000000000047. - DOI - PubMed
    1. Brouwer S, Barnett TC, Rivera-Hernandez T, Rohde M, Walker MJ. 2016. Streptococcus pyogenes adhesion and colonization. FEBS Lett 590:3739–3757. doi: 10.1002/1873-3468.12254. - DOI - PubMed
    1. Muotiala A, Seppälä H, Huovinen P, Vuopio-Varkila J. 1997. Molecular comparison of group A streptococci of T1M1 serotype from invasive and noninvasive infections in Finland. J Infect Dis 175:392–399. doi: 10.1093/infdis/175.2.392. - DOI - PubMed
    1. Roberts AL, Connolly KL, Kirse DJ, Evans AK, Poehling KA, Peters TR, Reid SD. 2012. Detection of group A Streptococcus in tonsils from pediatric patients reveals high rate of asymptomatic streptococcal carriage. BMC Pediatr 12:3. doi: 10.1186/1471-2431-12-3. - DOI - PMC - PubMed

Publication types

MeSH terms

LinkOut - more resources