. 2020 Jul 13;11(7):528.
doi: 10.1038/s41419-020-2733-4.

Depletion of microglia exacerbates injury and impairs function recovery after spinal cord injury in mice

Affiliations

Depletion of microglia exacerbates injury and impairs function recovery after spinal cord injury in mice

Haitao Fu et al. Cell Death Dis. .

Abstract

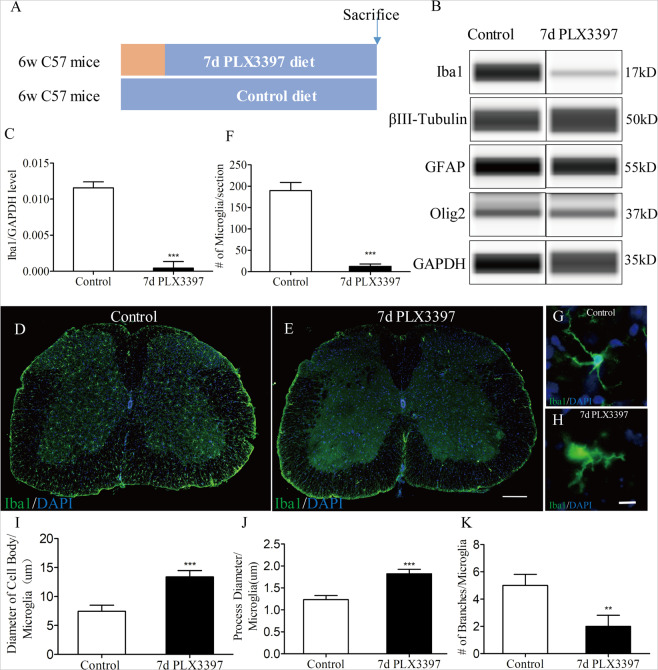
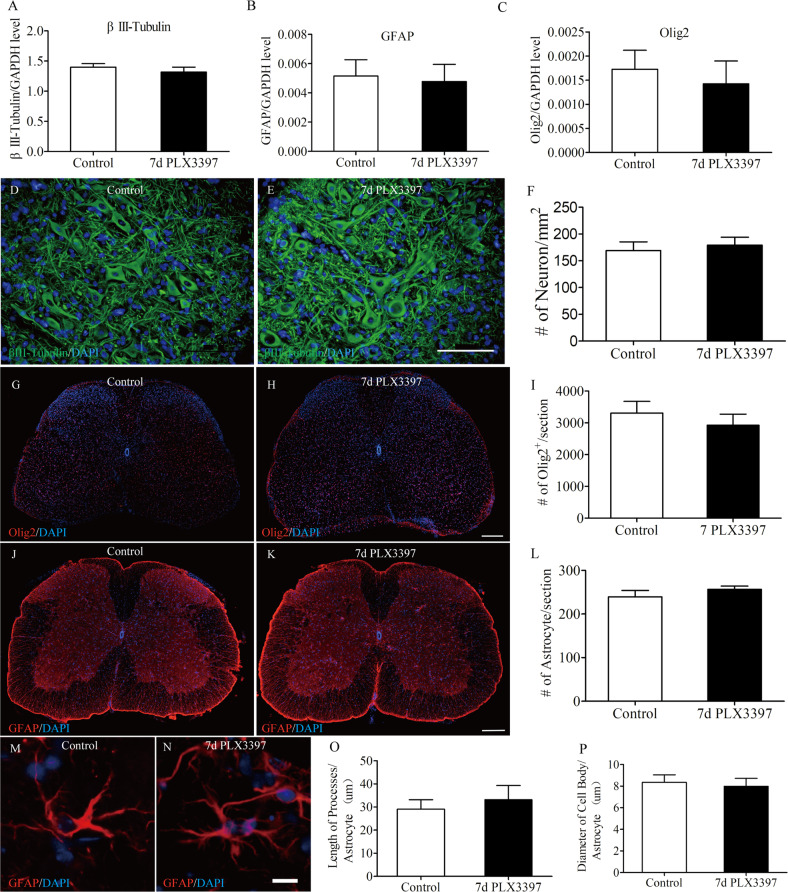
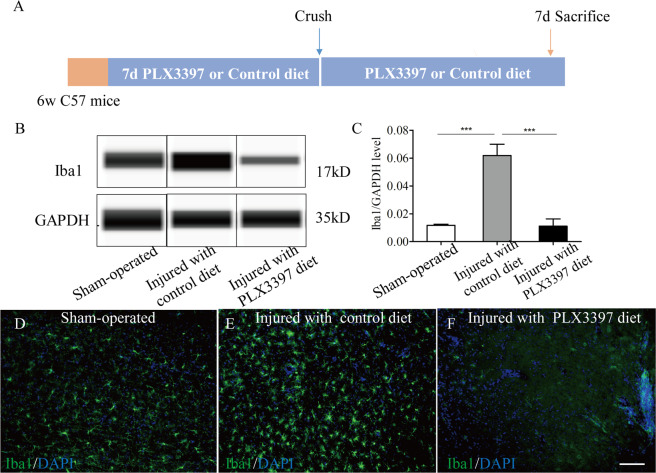
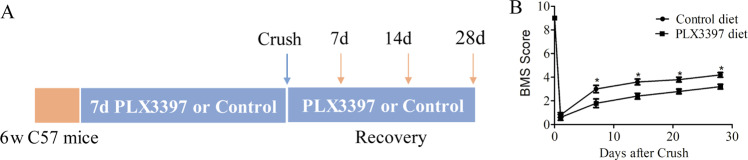
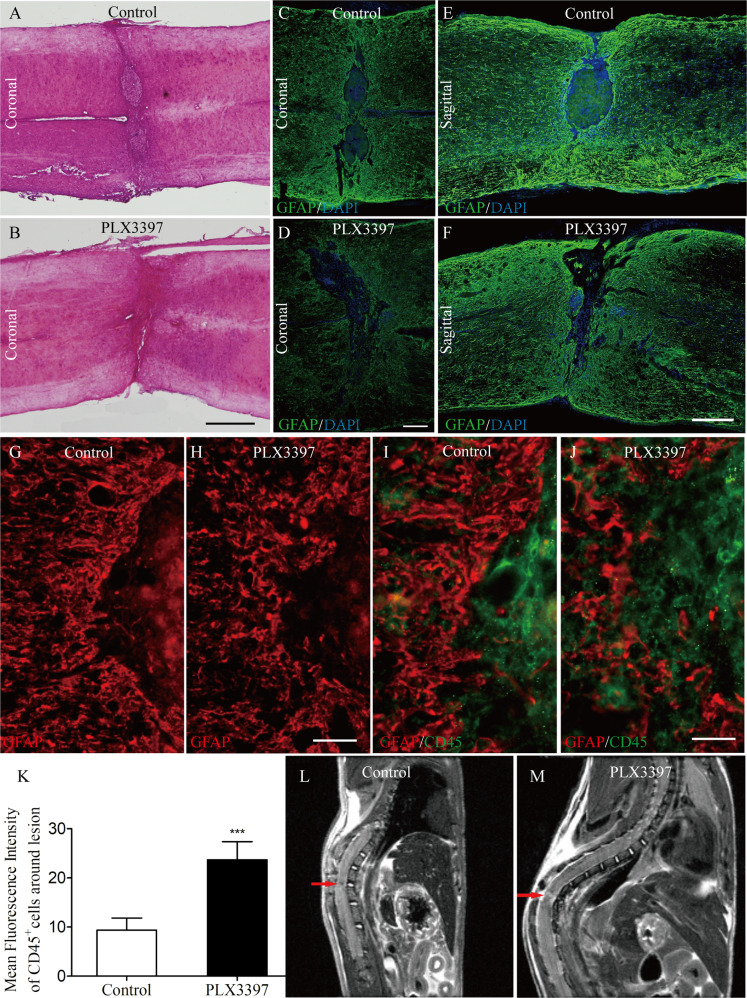
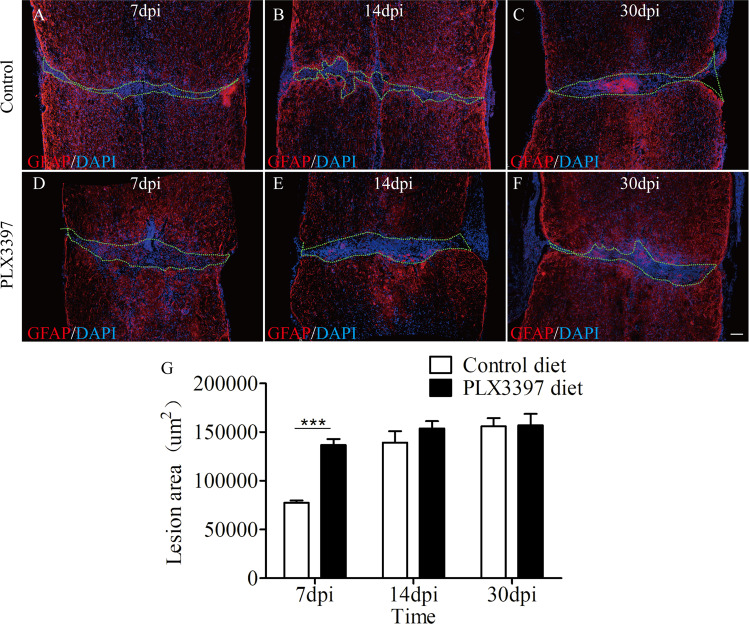
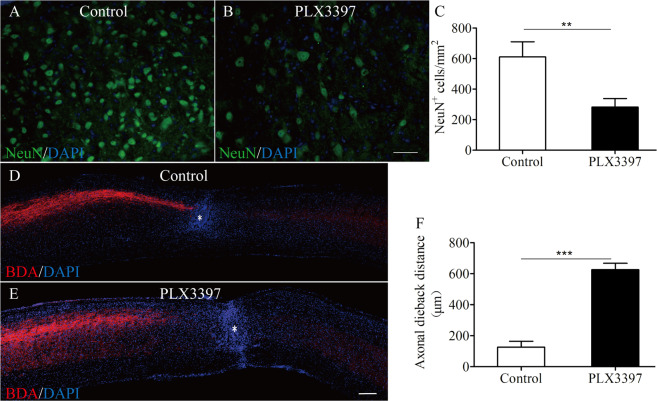
The role of microglia in spinal cord injury (SCI) remains ambiguous, partially due to the paucity of efficient methods to discriminate these resident microglia with blood-derived monocytes/macrophages. Here, we used pharmacological treatments to specifically eliminate microglia and subsequently to investigate the response of microglia after SCI in mice. We showed that treatment with colony stimulating factor 1 receptor (CSF1R) inhibitor PLX3397 eliminated ~90% microglia and did not affect other cell types in mouse spinal cord. PLX3397 treatment also induced a strong decrease in microglial proliferation induced by SCI. Depletion of microglia after SCI disrupted glial scar formation, enhanced immune cell infiltrates, reduced neuronal survival, delayed astrocyte repopulation, exacerbated axonal dieback, and impaired locomotor recovery. Therefore, our findings suggest microglia may play a protective role after SCI in mice.


Conflict of interest statement

The authors declare that they have no conflict of interest.

Figures

Fig. 1
Fig. 1. Efficient depletion of microglia in the adult spinal cord via pharmacologic inhibition of CSF1R.
a Schematic of the experimental design: 6-week-old C57BL/6 mice were fed either PLX3397 or control chow for 7 days. On day 7, mice were euthanized for western blots or Immunostaining. b Western blot analysis of spinal cord homogenates for steady state levels of the microglia marker Iba1, neuronal markers βIII Tubulin, the oligodendrocyte marker Olig2, and the astrocyte markers GFAP. c Quantification of Iba1 in (B) showing CSF1R inhibition decreased Iba1 protein levels (n = 4 per group). d, e Representative immunofluorescence images of mouse spinal cord sections showing Iba1+ ramified microglia (green). Almost no Iba1+ cells were detected in mice that were fed a PLX3397 diet for 7d. f Quantification of the number of IBA1+ cell in the spinal cord from control and PLX3397-treated mice (n = 4 per group) as shown in (D) and (E). g, h Iba1 immunostaining shows changes in microglia morphology with representative microglia shown from control and 7-day PLX3397-treated mice. I-K Microglial morphology were assessed by the diameter of cell body per microglia (i), the process diameter per microglia (j) and the number of branches per microglia (k) (n = 4 per group). Data are expressed as mean ± SD. Scale bars: d, e, in e 200 µm; g, h, in h 10 µm.
Fig. 2
Fig. 2. Microglia elimination does not affect other cell types in spinal cord.
Six-week-old wild-type C57BL/6 mice were treated with PLX3397 or vehicle or 7 days to eliminate microglia. Western blots were performed on spinal cord homogenates for the neuronal markers βIII Tubulin, the oligodendrocyte marker Olig2, and the astrocyte markers GFAP (Fig. 1b). ac Quantification of βIII Tubulin, Olig2, and GFAP in Fig. 1b shows no significant changes in the expression of the three markers between two groups (n = 4 per group). d, e Representative images taken from mouse spinal cord ventral horn immunostained for βIII-Tubulin (green) and DAPI (blue). f Quantification of the number of βIII-Tubulin+ cells in the spinal cord from control and PLX3397-treated mice (n = 4 per group) as shown in d and e. g, h Representative immunofluorescence images of mouse spinal cord sections showing Olig2+ cells. i Quantification of the number of Olig2+ cells in the spinal cord from control and PLX3397-treated mice (n = 4 per group) as shown in g and h. j, k Representative immunofluorescence images of mouse spinal cord sections (the same sections with Fig. 1d, e, respectively) showing GFAP+ cells. l Quantification of the number of GFAP+ cells in the spinal cord from control and PLX3397-treated mice (n = 4 per group) as shown in j and k. m, n GFAP immunostaining shows the morphology of astrocytes from control and 7-day PLX3397-treated mice. o, p Astrocyte morphology were assessed by the length of processes per astrocyte and the diameter of cell body per astrocyte (n = 4 per group). Data are expressed as mean ± SD. Scale bars: d, e in e 100 µm; g, h in h 200 µm; j, k in k 200 µm; m, n in n 10 µm.
Fig. 3
Fig. 3. CSF1R inhibition reduces microglial accumulation induced by SCI.
a Schematics of experimental design showing the timeline of microglia depletion, spinal cord crush injury, and sacrifice. b Western blot analysis of spinal cord homogenates from sham-operated, injured with control or PLX3397-treated mice (n = 4 per group) for steady state levels of the microglia marker Iba1. c Quantification of b showing a robust increase in levels of Iba1 expression at 7 days following SCI. CSF1R inhibition reverses the increase induced by SCI. df Representative immunofluorescence images of mouse spinal cord sections showing Iba1+ microglia. The changes in number of Iba1+ microglia consist with the changes of Iba1 expression levels. Data are expressed as mean ± SD. Scale bars: e, f in f 100 µm.
Fig. 4
Fig. 4. Microglial depletion reduces locomotor recovery after SCI.
a Schematics of experimental design showing the timeline of microglia depletion, spinal cord crush injury, behavioral testing using the BMS score. b Locomotor function was assessed using the BMS score over a 28-day period after SCI (n = 4 per group). Data are expressed as mean ± SD. *p < 0.05.
Fig. 5
Fig. 5. The elimination of microglia results in a disorganized astrocytic scar at the lesion border.
af Representative HE (a, b) or immunofluorescence (cf) images of coronal (ad) or sagittal (e, f) sections of mouse spinal cord taken at 30 dpi. In control mice (a, c, e), astrocytes adjacent to the lesion form a compact scar. This astrocytic scar was compromised in mice depleted of microglia using PLX3397 (b, d, f). gj Representative immunofluorescence images of spinal cord sections taken at the lesion epicenter at 21 dpi. In mice fed with the control diet (g, i), astrocytes exhibit elongated processes oriented parallel to the lesion border. This orientation was disorganized in PLX3397-treated mice (h, j) and associated with clusters of CD45+ immune cells spreading outside of the lesion epicenter. k Quantification of the infiltration degree of CD45+ cells spreading outside of the lesion epicenter in the spinal cord from control and PLX3397-treated mice (n = 4 per group) as shown in i and j. l, m In vivo T2W-MRI assessment of the lesion in control and PLX3397-treated mice after SCI. In vivo sagittal sections of mouse spinal cord taken at 21 dpi. Red arrows represent abnormal signals in the spinal cord. Scale bars: a, b, in b 1 mm; c, d, in d 200 µm; e, f, in f 200 µm; g, h, in h 50 µm; i, j, in j 25 µm.
Fig. 6
Fig. 6. Delayed repopulation of the spinal cord lesion site by astrocytes upon microglia depletion.
af Representative photographs of coronal sections of mouse spinal cord taken from mice on either control diet or PLX3397at 7, 14, and 30 dpi. The area circled by green dashed line represent lesion area. g Quantification of the lesion size of the spinal cord from control and PLX3397-treated mice (n = 4 per group) as shown in af. Data are expressed as mean ± SD. **p < 0.01. Scale bars: af, in f 100 µm.
Fig. 7
Fig. 7. Microglial depletion reduces neuronal survival and exacerbates axonal dieback.
a, b Representative images taken around the lesion epicenter at 30 dpi immunostained for NeuN (green) and DAPI (blue). c Quantification of the number of NeuN+ cells in the spinal cord from control and PLX3397-treated mice (n = 4 per group) as shown in a and b. d, e Representative sagittal sections of the spinal cord from control and PLX3397-treated mice at 8 weeks after injury. BDA-labeled CST axons are shown in red. Blue represents DAPI immunostaining. White asterisk represents lesion epicenter. f Quantification of axonal dieback distance at 8 weeks post SCI as shown in d and e (n = 4 per group). Data are expressed as mean ± SD. **p < 0.01, ***p < 0.001. Scale bars: a, b, in b 50 µm; d, e, in e 200 µm.

References

    1. Ginhoux, F. et al. Fate mapping analysis reveals that adult microglia derive from primitive macrophages. Science(N. Y., N. Y.)330, 841–845 (2010). - PMC - PubMed
    1. David, S. & Kroner, A. Repertoire of microglial and macrophage responses after spinal cord injury. Nat. Rev. Neurosci.12, 388–399 (2011). - PubMed
    1. Nimmerjahn, A., Kirchhoff, F. & Helmchen, F. Resting microglial cells are highly dynamic surveillants of brain parenchyma in vivo. Science(N. Y., N. Y.)308, 1314–1318 (2005). - PubMed
    1. Davalos, D. et al. ATP mediates rapid microglial response to local brain injury in vivo. Nat. Neurosci.8, 752–758 (2005). - PubMed
    1. Liddelow, S. A. et al. Neurotoxic reactive astrocytes are induced by activated microglia. Nature541, 481–487 (2017). - PMC - PubMed

Publication types