. 2020 Jul 13;11(1):3479.
doi: 10.1038/s41467-020-17254-w.

The choline transporter Slc44a2 controls platelet activation and thrombosis by regulating mitochondrial function

Affiliations

The choline transporter Slc44a2 controls platelet activation and thrombosis by regulating mitochondrial function

J Allen Bennett et al. Nat Commun. .

Abstract

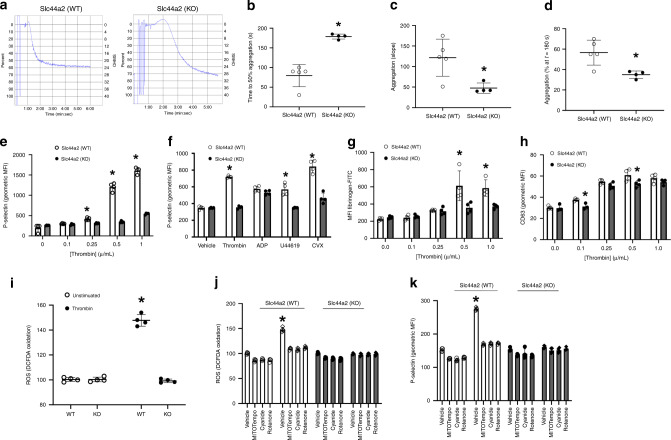
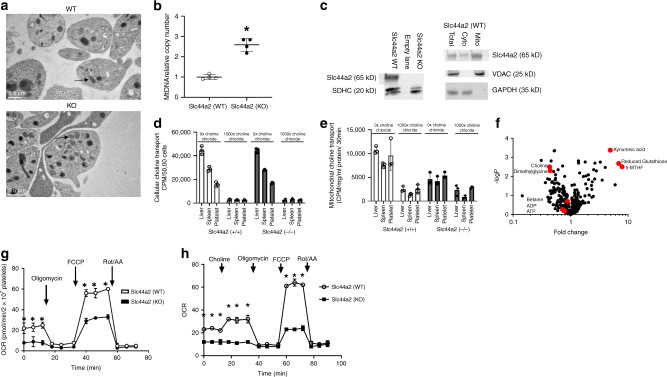
Genetic factors contribute to the risk of thrombotic diseases. Recent genome wide association studies have identified genetic loci including SLC44A2 which may regulate thrombosis. Here we show that Slc44a2 controls platelet activation and thrombosis by regulating mitochondrial energetics. We find that Slc44a2 null mice (Slc44a2(KO)) have increased bleeding times and delayed thrombosis compared to wild-type (Slc44a2(WT)) controls. Platelets from Slc44a2(KO) mice have impaired activation in response to thrombin. We discover that Slc44a2 mediates choline transport into mitochondria, where choline metabolism leads to an increase in mitochondrial oxygen consumption and ATP production. Platelets lacking Slc44a2 contain less ATP at rest, release less ATP when activated, and have an activation defect that can be rescued by exogenous ADP. Taken together, our data suggest that mitochondria require choline for maximum function, demonstrate the importance of mitochondrial metabolism to platelet activation, and reveal a mechanism by which Slc44a2 influences thrombosis.


Conflict of interest statement

The authors declare no competing interests.

Figures

Fig. 1
Fig. 1. Slc44a2 is expressed in platelets and regulates hemostasis and thrombosis in mice.
a RNA levels of Slc44a2 relative to ß-actin in murine organs were measured by qPCR (n = 3 ± biologically independent samples ±S.D.). b Protein levels of SLC44A2 in normal human platelets were measured by immunoblotting. c Protein levels of Slc44a2 in mouse platelets and mouse bone marrow were measured by immunoblotting. d The bleeding time of Slc44a2(WT) and Slc44a2(KO) mice was measured after tail transection (n = 6 WT and 8 KO mice ±S.D. and *P < 0.01 in a two-tailed Student’s t test). e The time for mesenteric arterial thrombosis after FeCl3 treatment was measured by intravital microscopy. *For WT vs. KO, the Fisher’s exact test statistic is 0.0001 and the result is significant at P < 0.05. f Representative image of inferior vena cava 6 h after IVC constriction, with WT above and KO below. g Quantification of IVC mass containing IVC segment and thrombus 6 h after IVC constriction (n = 13 WT and 15 KO mice ±S.D. and *P < 0.01 in a two-tailed Student’s t test). h Quantification of thrombus mass isolated from IVC 6 h after IVC constriction (n = 5 WT and 6 KO mice ±S.D. and *P < 0.01 in a two-tailed Student’s t test). i Bleeding times were repeated after bone marrow transplantation between Slc44a2(WT) and Slc44a2(KO) mice (n = 10, 7, 9, and 4 mice as shown in the chart ±S.D. and *P < 0.01 for WT–WT vs. KO–WT and *P < 0.01 for KO–KO vs. WT–KO in Tukey’s range test). Bone marrow from Slc44a2(KO) donor mice prolongs the bleeding time of recipient mice. j Percent maximal blood flow in carotid artery after treatment with FeCl3 was measured by ultrasound. k Quantitation of j. For WT–WT vs. KO–WT, the Fisher’s exact test statistic is 0.02 and the result is significant at P < 0.05. For WT–KO vs. KO–KO, the Fisher’s exact test statistic is 0.3 and the result is not significant at P < 0.05 Sample size includes: 10, 12, 7, 6, and 8 as shown in chart. l The bleeding time of Slc44a2(WT) and Slc44a2(KO) mice was measured after tail transection (WT and KO). (n = 6, 9, 9, and 8 mice as shown in the chart ±S.D. and *P < 0.01 for WT vs. KO). The bleeding time of Slc44a2(KO) mice after transfusion with platelets from Slc44a2(WT) or Slc44a2(KO) mice was measured after tail transection (WT to KO and also KO to KO). (n = 10 mice ±S.D. and *P < 0.01 for WT to KO vs. KO to KO compared in Tukey’s range test). Source data are provided as a Source Data file.
Fig. 2
Fig. 2. Slc44a2 regulates murine platelet activation ex vivo.
ad Platelet aggregation after treatment with 0.5 µ/mL thrombin was measured by light transmission aggregometry. n = 4 biologically independent samples ±S.D. *P < 0.05 in a two-tailed Student’s t test. e Platelet externalization of P-selectin after thrombin stimulation was measured by flow cytometry. n = 3 biologically independent samples ±S.D. *P < 0.05 in a two-tailed Student’s t test. f Platelet externalization of P-selectin after treatment with various agonists (0.5 µ/mL thrombin, 5 µM ADP or U46619, or 0.5 ng/mL convulxin). n = 3 biologically independent samples ±S.D. *P < 0.05 in a two-tailed Student’s t test. g Platelet activation of GPIIbIIIA after 0.5 µ/mL thrombin treatment was measured by flow cytometry of FITC-fibrinogen binding. n = 3 biologically independent samples ±S.D. *P < 0.05 in a two-tailed Student’s t test. h Platelet externalization of CD63 after 0.5 µ/mL thrombin treatment was measured by flow cytometry. n = 4 biologically independent samples ±S.D. *P < 0.05 in a two-tailed Student’s t test. i Platelet ROS production during stimulation with 0.5 µ/mL thrombin was measured by flow cytometry with DCF-DA. j Platelet ROS production was measured after treatment with mitochondrial inhibitors followed by 0.5 µ/mL thrombin treatment. n = 3 biologically independent samples ±S.D. *P < 0.05 in a two-tailed Student’s t test. k Platelet externalization of P-selectin was measured after mitochondrial inhibitor treatment followed by 0.5 µ/mL thrombin treatment. n = 3 biologically independent samples ±S.D. *P < 0.05 in a two-tailed Student’s t test. For j and k, all compounds tested at 5 µM with thrombin at 0.5 µ/mL. Source data are provided as a Source Data file.
Fig. 3
Fig. 3. Slc44a2 regulates mitochondrial number and function.
a Representative transmission electron microscopy images of platelets from Slc44a2(WT) and Slc44a2(KO) mice. Arrow indicates an individual mitochondrion. b Platelet mitochondria DNA copy number measured by qPCR. n = 4. *P < 0.05 in a two-tailed Student’s t test (c) Slc44a2 is present in lysate of mitochondria purified from platelets (left immunoblot) and Slc44a2 is enriched in the mitochondrial fraction of platelets but not in the cytosolic fraction of platelets (right immunoblot). d Slc44a2 does not regulate choline transport into whole cells, as measured by cellular uptake of radiolabeled choline competed with nonlabeled choline. (n = 3 biologically independent samples ±S.D. and *P < 0.05 for WT vs. KO). e Slc44a2 regulates transport of choline into isolated mitochondria, as measured by mitochondrial uptake of radiolabeled choline competed with nonlabeled choline. (n = 3 biologically independent samples ±S.D. and *P < 0.05 for WT vs. KO). f Metabolite profiles in platelets from Slc44a2(KO) mice relative to Slc44a2(WT) mice as measured by mass spectroscopy. (n = 2–3). g Mitochondrial oxygen consumption rate (OCR) of platelets from Slc44a2(KO) and Slc44a2(WT) mice: basal and uncoupled OCR are decreased in Slc44a2(KO) platelets (n = 4 biologically independent samples ±S.D.; *P < 0.05 WT vs. KO in a two-tailed Student’s t test). h Mitochondrial OCR during treatment with choline (n = 4 biologically independent samples ±S.D.; *P < 0.05 WT vs. KO in a two-tailed Student’s t test). For stress testing, Antimycin A = 1.0 µM, FCCP = 1.0 µM and Rotenone = 0.5 µM. Choline was added at 20 µM for all experiments. (For all panels, *P < 0.05 WT vs. KO in a two-tailed Student’s t test). Source data are provided as a Source Data file.
Fig. 4
Fig. 4. Slc44a2 and choline increase mitochondrial production of ATP and platelet ATP/ADP levels.
a Platelets from Slc44a2(KO) mice contain less ADP than platelets from Slc44a2(WT) mice. n = 7 biologically independent samples ±S.D. *P < 0.05 in a two-tailed Student’s t test. b Platelets from Slc44a2(KO) mice contain less ATP than platelets from Slc44a2(WT) mice. n = 7 biologically independent samples ±S.D. *P < 0.05 in a two-tailed Student’s t test. c Platelets from Slc44a2(KO) mice have an altered ADP/ATP ratio compared to platelets from Slc44a2(WT) mice. n = 7 biologically independent samples ± S.D. *P < 0.05 in a two-tailed Student’s t test. d Platelets from Slc44a2(KO) mice release less ATP in response to 0.5 µ/mL thrombin. n = 4 biologically independent samples ±S.D. *P < 0.05 in a two-tailed Student’s t test. e Choline increases ROS production in a manner that depends upon Slc44a2 in purified mitochondria. n = 3 biologically independent samples ±S.D. *P < 0.05 in a two-tailed Student’s t test. f Choline increases ATP production in a manner that depends upon Slc44a2 in isolated mitochondria. Choline was added at 20 µM. n = 6 biologically independent samples ±S.D. *P < 0.05 in a two-tailed Student’s t test. g Exogenous ADP rescues platelet activation defect in Slc44a2(KO) platelets. Platelets were treated with 0.5 µ/mL thrombin and 5 µM 2-MeSADP. n = 3 biologically independent samples ±S.D. *P < 0.05 in a two-tailed Student’s t test. h ADP increases platelet ROS production. i ADP increases mitochondrial ROS production. n = 3 biologically independent samples ±S.D. *P < 0.05 in a two-tailed Student’s t test. Source data are provided as a Source Data file.
Fig. 5
Fig. 5. Proposed model for choline transport and Slc44a2 regulation of platelet activation.
We propose that Slc44a2 transports choline into mitochondria, where it is metabolized and regulates the production of ATP and release of ROS. ATP is released from platelets and hydrolyzed to ADP which acts upon platelet purinergic receptors and drives further platelet activation.

References

    1. Heit JA. Epidemiology of venous thromboembolism. Nat. Rev. Cardiol. 2015;12:464–474. - PMC - PubMed
    1. Heit JA, et al. Familial segregation of venous thromboembolism. J. Thrombosis Haemost. 2004;2:731–736. - PubMed
    1. Germain M, et al. Meta-analysis of 65,734 individuals identifies TSPAN15 and SLC44A2 as two susceptibility loci for venous thromboembolism. Am. J. Hum. Genet. 2015;96:532–542. - PMC - PubMed
    1. Hinds DA, et al. Genome-wide association analysis of self-reported events in 6135 individuals and 252 827 controls identifies 8 loci associated with thrombosis. Hum. Mol. Genet. 2016;25:1867–1874. - PMC - PubMed
    1. Nair TS, et al. Identification and characterization of choline transporter-like protein 2, an inner ear glycoprotein of 68 and 72 kDa that is the target of antibody-induced hearing loss. J. Neurosci. 2004;24:1772–1779. - PMC - PubMed

Publication types

MeSH terms

Substances