. 2020 Jul 13;11(1):3495.
doi: 10.1038/s41467-020-17212-6.

Rab27a co-ordinates actin-dependent transport by controlling organelle-associated motors and track assembly proteins

Affiliations

Rab27a co-ordinates actin-dependent transport by controlling organelle-associated motors and track assembly proteins

Noura Alzahofi et al. Nat Commun. .

Abstract

Cell biologists generally consider that microtubules and actin play complementary roles in long- and short-distance transport in animal cells. On the contrary, using melanosomes of melanocytes as a model, we recently discovered that the motor protein myosin-Va works with dynamic actin tracks to drive long-range organelle dispersion in opposition to microtubules. This suggests that in animals, as in yeast and plants, myosin/actin can drive long-range transport. Here, we show that the SPIRE-type actin nucleators (predominantly SPIRE1) are Rab27a effectors that co-operate with formin-1 to generate actin tracks required for myosin-Va-dependent transport in melanocytes. Thus, in addition to melanophilin/myosin-Va, Rab27a can recruit SPIREs to melanosomes, thereby integrating motor and track assembly activity at the organelle membrane. Based on this, we suggest a model in which organelles and force generators (motors and track assemblers) are linked, forming an organelle-based, cell-wide network that allows their collective activity to rapidly disperse the population of organelles long-distance throughout the cytoplasm.


Conflict of interest statement

The authors declare no competing interests.

Figures
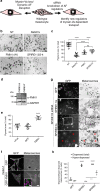
Fig. 1
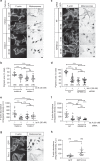
Fig. 1. FMN1- and SPIRE1/2-deficient melanocytes show perinuclear melanosome clustering.
a A schematic representation of the strategy used to identify regulators of myosin-Va/dynamic AF-dependent melanosome transport. In wild-type melanocytes melanosomes are dispersed throughout the cytoplasm. Loss of myosin-Va (or its regulatory proteins, e.g., Rab27a) or pharmacological disruption of dynamic AFs blocks melanosome dispersion, resulting in perinuclear melanosome clustering 15. To identify AF-associated proteins working with myosin-Va, we used siRNA to deplete known AF regulators and screened for targets whose depletion phenocopied the loss of myosin-Va/depletion of dynamic AFs, i.e., caused perinuclear clustering of melanosomes. b melan-a cells were transfected with the indicated siRNA fixed 72 h cells later and imaged using bright-field optics to observe melanosome distribution (see Experimental procedures). c A bee swarm plot showing the extent of melanosome dispersion in individual cells transfected with the indicated siRNA (n (cells) = 28 (NT), 18 (Rab27a), 20 (FMN1) and 22 (SPIRE1/2)). Horizontal bars indicate the populations that are being compared. n.s. indicates no significant difference between the populations as determined by one-way ANOVA. All other comparisons yielded highly statistically significant differences p = <0.0001. d A western blot showing the expression of FMN1 and GAPDH (loading control) in whole cell lysates of melan-a and melan-f melanocytes. e A bee swarm plot showing the extent of melanosome dispersion in adenovirus-infected melan-f cells expressing the indicated proteins (n (cells) = 14 for all conditions). **** indicates a statistically significant difference (p = <0.0001) between this population and the others. No other statistically significant differences were observed. f Confocal micrographs showing the distribution and effect of GFP-FMN1 expression on melanosome distribution in melan-f cells. White dotted boxes in images indicates the region shown in high-magnification overlay image (GFP-FMN1 in green and melanosomes in magenta). g melan-a cells were transfected with the indicated siRNA. After 72 h cells were infected with adenovirus expressing GFP or GFP-SPIRE1/2 (human), fixed 24 h later and processed for immunofluorescence. Cells were then imaged using bright-field and fluorescence optics to observe melanosome and GFP distribution. Asterisks indicate cells with hyper-dispersed melanosome distribution. h A bee swarm plot showing the percentage of SPIRE1/2-depleted/adenovirus-infected melan-a cells in low-magnification (10×) fields of view, in which melanosomes were dispersed and hyper-dispersed. Scale bars = 50 μm (b, g) and 21 μm (g magnified portion), 10 μm (f) and 4 μm (f magnified portion). c, e, h **** and *** indicates statistical significance of differences of p = <0.0001 and p = <0.001 as determined by one-way ANOVA. Significance indicators above datasets indicate differences compared with GFP control. The horizontal bar indicates the datasets that are being compared. No other significant differences were observed. Bars indicate the mean and 25th and 75th percentile of data. Source data for c, d, e and h are provided in the Supplementary Source data file.
Fig. 2
Fig. 2. FMN1 and SPIRE1/2 generate latrunculin-A-sensitive AFs essential for melanosome dispersion.
melan-a and melan-f cells were plated onto glass coverslips, and transfected with siRNA as indicated: c, d, f, infected with GFP-FMN1 expressing virus g, h and/or incubated with latrunculin-A (lat-A) for 60 min af as indicated. Cells were then fixed and stained with fluorescent phalloidin to reveal AFs (see Experimental procedures). a, c, g Fluorescent and bright-field images showing the distribution of AFs and melanosomes in melanocytes. Scale bar = 15 μm. b, d, e, f, h Bee swarm plots showing the extent of melanosome dispersion (b, d) and AF abundance (e, f, h) in melanocytes, in the presence and absence of latrunculin-A. b and e, and d and f show data from the same population of cells. The number of cells measured in each case is indicated in brackets in the bee swarm plot associated with that data (b, d, f, h). Numbers of cells in e and f are the same as in b and d. **** and *** indicate significant difference p = <0.0001 and p = <0.001 as determined by one-way ANOVA. n.s. indicates no significant difference. Data are from one of three independent experiments. Bars within each dataset indicate the mean and 25th and 75th percentile of data. Bars linking datasets indicate the pairs that are being compared for similarity. Source data for b, df, h are provided in the supplementary Source data file.
Fig. 3
Fig. 3. High-resolution electron microscopy reveals a reduction in melanosome-associated AFs in FMN1-deficient melanocytes compared with controls.
af Wild-type (melan-a, ac) and FMN1-deficient (melan-f, bf) cells were prepared for field emission scanning electron microscopy (FESEM; see Experimental procedures). Cells in a and d are shown with increased magnification, with high magnification of the insets (yellow) in c and f. The red line in d indicates the cell outline. Arrows in c point at a loose network of filaments around melanosomes; arrowheads show melanosomes on top of a dense filament network. g Colourised filaments in high-magnification FESEM images of melan-a melanosomes (pink) indicate filaments linking (blue), above (orange) and below (yellow) melanosomes. h, i Immuno-electron microscopy of melan-a cells viewed with FESEM/backscatter showing phalloidin labelling (10 nm gold particles) of actin filaments around and over melanosomes, as well as inter-melanosome filaments (arrowheads). Higher magnification in i shows colourised filaments (cyan) and gold particle labelling (yellow). j TEM of rapid freeze/freeze dry metal replica showing myosin S1 decoration of filaments (arrowheads) around melanosomes. g, k High-magnification FESEM showing melanosomes with multiple AFs emerging from them in melan-a cells (g, arrows) or AF stubs on melan-f melanosomes (l, arrowheads). m Bee swarm plot showing size distribution for AFs emanating from melanosomes, as measured on FESEM images. n (actin filaments) = 433 (melan-a) and 443 (melan-f). **** indicates significant difference p = <0.0001 between melan-a and melan-f cells as determined by Mann–Whitney test. Source data for i are provided in the supplementary Source data file. Bars indicate the mean and 25th and 75th percentile of data. Scale bars: a, b, d, 10 μm; c, eg, 1 μm; h, k, l, 200 nm; i, j, 100 nm.
Fig. 4
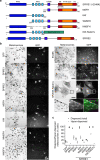
Fig. 4. The FMN interaction (KIND) and AF nucleation (WH2) domains of SPIRE1 are essential for melanosome dispersion.
a A schematic representation of the domain structure of human SPIRE1, and the correspondence with mutant and chimeric proteins used in functional studies (b, c). Numbers indicate amino acid boundaries. K KIND, W WH2, M GTBM globular tail domain binding motif, S SB SPIRE box, F FYVE-type zinc finger, H C-terminal flanking sequences similar to H2 of Slp/Slac-proteins. b melan-a cells were depleted of SPIRE1/2 by siRNA transfection and 72 h later infected with adenoviruses expressing the indicated proteins. Cells were fixed 24 h later, processed for immunofluorescence and imaged using bright-field and fluorescence optics to observe melanosome and protein distribution/expression (see Experimental procedures). Scale bars = 100, 20 and 3 μm in low, medium and high-magnification images. Boxes in KW-Rab27a images indicate the region shown below. For the merged image green = KW-Rab27a and magenta = melanosomes. c Is a bee swarm plot showing the percentage of human SPIRE1/2 expressing SPIRE1/2-depleted melan-a cells (50 cells for each condition in each experiment), in which melanosomes are classed as dispersed and/or hyper-dispersed. Results shown are from of three independent experiments. Source data for c are provided in the Supplementary Source data file.
Fig. 5
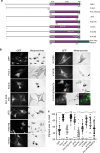
Fig. 5. The AF assembly (FH1-FH2) and SPIRE interaction (FSI) domains of FMN1 are essential for melanosome dispersion.
a A schematic representation of the domain structure of murine FMN1 and the composition of truncation mutants, and chimeric proteins used in functional studies (b, c). White asterisks indicates the site of point mutations. Numbers indicate amino acid boundaries. b melan-f cells were plated on glass coverslips and infected with adenoviruses expressing the indicated proteins. Cells were fixed 24 h later, processed for immunofluorescence and the intracellular distribution of expressed protein and melanosomes (bright-field) was observed using a fluorescence microscope (see Experimental procedures). Scale bars = 20 μm and 2 μm for magnified region. Dashed boxes in FH1-FH2-Rab27a images indicate the region of the image shown in high magnification below. The merged image show melanosomes and FH1-FH2-Rab27a coloured magenta and green. c A bee swarm plot showing the extent of pigment dispersion in cells expressing the indicated proteins. n = 30 (GFP), 59 (FMN1), 18 (N-term), 70 (FH1-FH2-FSI), 31 (ΔFSI), 20 (FH2-FSI), 37 (I1074A), 35 (K1229D), 28 (K1418E) and 51 (FH1-FH2-Rab27a). ****, **, * and n.s. indicate significant differences of p = <0.0001, 0.01, 0.05 and no significant difference as determined by one-way ANOVA. Significance indicators above and below each dataset indicate differences between that dataset and the positive (FMN1 wild type) and negative (GFP alone) controls. Results shown are representative of three independent experiments. Bars indicate the mean and 25th and 75th percentile of data. FH formin homology, FSI formin-SPIRE interaction sequence. Source data for c are provided in the Supplementary Source data file.
Fig. 6
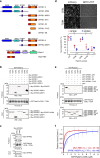
Fig. 6. SPIRE1/2 interact with active Rab27a via their membrane-binding C-termini.
a A schematic representation of the domain structure of SPIRE1/2, Mlph and truncations used in interaction studies (b, c, e, f). Interaction of SPIRE1/2 and Rab27a was investigated using GST pull-down (b, c, e, f) and BiFC (d) assays (see Experimental procedures). b, c, e Western blots and Ponceau S stained filters showing the results of pull-down assays measuring the interaction of GST-Rab27a (active Q78L and inactive T23N mutants) with SPIRE1/2 and the indicated truncations (Myc-tagged (b, c) and GFP-tagged (e) in vitro). c is a contrast enhanced version of the section of b showing interaction of SPIRE2 with Rab27a-Q78L and Rab27a-T23N. d Fluorescence images and a bee swarm plot (upper and lower panels) showing the results of the BiFC assay, reporting the interaction of Rab27a with SPIRE1 and SPIRE2 in HEK293a cells (see Experimental procedures). Images of mCherry indicate transfection efficiency and vYFP indicates BiFC, i.e., interaction. The bee swarm plot shows the BiFC signal for populations of cells expressing SPIRE1/2 with and without active and inactive Rab27a mutants. Data shown are from three independent experiments. ****, *** and ** indicate significant differences of p = <0.0001, p = <0.001 and p = <0.01 between the adjacent dataset and Rab27a wild-type/SPIRE1/2 expressing cells as determined by one-way ANOVA of data for SPIRE1 and SPIRE2 with different Rab27a proteins. No other significant differences were observed. Two-way ANOVA comparison of BiFC signal for the Rab27a proteins with different SPIREs revealed no significant differences. Bars indicate the mean and 25th and 75th percentile of data. Scale bar = 250 μm. f Line plots showing the extent of binding of GFP-SPIRE1-MSFH (n = 4) and GFP-Mlph-RBD (n = 3) as a function of increasing GST-Rab27a-Q78L concentrations. Data are presented as mean values ± SEM and the equilibrium dissociation constants (Kd) are provided. K KIND, W WH2, M GTBM globular tail domain binding motif, S SB SPIRE box, F FYVE-type zinc finger, H C-terminal flanking sequences similar to H2 of Slp/Slac-proteins, WB western blotting. Source data bf are provided in the Supplementary Source data file.
Fig. 7
Fig. 7. Rab27a recruits SPIRE1 to melanosomes in melanocytes.
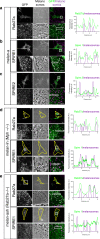
Melanocytes were transfected with plasmids allowing expression of the indicated proteins as fusions to the C-terminus of EGFP. Cells were fixed after 48 h, stained with GFP-specific antibodies to detect the expressed proteins, and the intracellular distribution of expressed protein and melanosomes was observed using a confocal microscope (see Experimental procedures). ae Single confocal z-sections of the distribution of each protein, pigmented melanosomes (transmitted light/phase contract images) and merge images (melanosomes pseudo-coloured magenta). Upper panels show whole cells. Boxes indicate regions shown in lower panels at high magnification allowing comparison of the distribution of melanosomes and fluorescent protein. Line plots are fluorescence intensity profile plots of the boxed regions in high-magnification images averaged along the vertical axis. ac, d and e are melan-a, melan-ln and melan-ash cells. d, e Yellow lines indicate the borders of transfected cells. Scale bars = 20 μm and 3 μm in main images and magnified portions. Source data are provided in the Supplementary Source data file.
Fig. 8
Fig. 8. Functional evidence that SPIRE1/2 interact with melanosome-associated Rab27a in melanocytes.
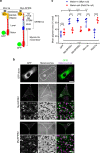
melan-ln (Mlph null) and melan-ash (Rab27a null) melanocytes were infected with viruses expressing the indicated proteins. Cells were fixed after 24 h, stained with GFP-specific antibodies, and the intracellular distribution of GFP-fusion proteins and melanosomes was observed using a confocal microscope (see Experimental procedures). a A schematic representation of the structure of mini-Va and myoSPIRE1/2 proteins, and their interaction with membrane-associated endogenous Rab27a. R27BD Rab27-binding domain, SB SPIRE box, GTBM globular tail binding domain. b Single confocal z-sections showing the distribution of expressed proteins, melanosomes and their colocalisation (from left to right). In merge images melanosomes are false-coloured magenta. For myoSPIRE1/2 upper and lower panels are low and high-magnification images. Boxes in low-magnification images indicate the area presented in the high-magnification images below. Scale bars = 10 μm in main images and 2 μm in magnified portions. Arrows indicate colocalisation of spots of myoSPIRE with melanosomes. Cell outlines are shown by white lines in phase contrast (melanosome) images. c A bee swarm plot showing the effect of expression of myoSPIRE and other proteins on melanosome distribution in melanocytes (melan-ln/Mlph null and melan-ash/Rab27a null). Data presented are mean pigment area measurements from four independent experiments. In each case, pigment area was measured for ten cells expressing each of the different proteins. ****, *** and n.s. indicate significant difference p = <0.0001, 0.001 and none between the datasets linked by horizontal bars as determined by one-way ANOVA. Bars within datasets indicate the mean and 25th and 75th percentile of data. Source data for c are provided in the supplementary Source data file.
Fig. 9
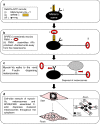
Fig. 9. A model indicating how Rab27a could regulate AF-driven melanosome transport by integrating the activity of myosin-Va, and SPIRE1/2 and FMN1.
See main text for details. In a, a model melanosome, myosin-Va, SPIRE and an actin filament are shown, Rab27a is not shown for clarity but is present on the melanosome membrane. In b, the activity of FMN1 in extending the +end of melanosomes from melanosomes is shown. In c, grey and black colours indicate AF and myosin-Va associated with melanosomes of the same colour. In d, grey and black colours indicate the position of numbered melanosomes at the start and finish of an episode of dispersive transport.

References

    1. Barlan K, Rossow MJ, Gelfand VI. The journey of the organelle: teamwork and regulation in intracellular transport. Curr. Opin. Cell Biol. 2013;25:483–488. - PMC - PubMed
    1. Goode, B. L., Drubin, D. G. & Barnes, G. Functional cooperation between the microtubule and actin cytoskeletons. Curr. Opin. Cell Biol.12, 63–71 (2000). - PubMed
    1. Langford GM. Actin- and microtubule-dependent organelle motors: interrelationships between the two motility systems. Curr. Opin. Cell Biol. 1995;7:82–88. - PubMed
    1. Ross JL, Ali MY, Warshaw DM. Cargo transport: molecular motors navigate a complex cytoskeleton. Curr. Opin. Cell Biol. 2008;20:41–47. - PMC - PubMed
    1. Woolner S, Bement WM. Unconventional myosins acting unconventionally. Trends Cell Biol. 2009;19:245–252. - PMC - PubMed

Publication types