Meta-Analysis
. 2020 Jul 13;11(1):3486.
doi: 10.1038/s41467-020-17171-y.

Meta-analysis of multidecadal biodiversity trends in Europe

Francesca Pilotto  1   2 Ingolf Kühn  3   4   5 Rita Adrian  6 Renate Alber  7 Audrey Alignier  8   9 Christopher Andrews  10 Jaana Bäck  11 Luc Barbaro  12 Deborah Beaumont  13 Natalie Beenaerts  14 Sue Benham  15 David S Boukal  16   17 Vincent Bretagnolle  18   19 Elisa Camatti  20 Roberto Canullo  21 Patricia G Cardoso  22 Bruno J Ens  23 Gert Everaert  24 Vesela Evtimova  25 Heidrun Feuchtmayr  26 Ricardo García-González  27 Daniel Gómez García  27 Ulf Grandin  28 Jerzy M Gutowski  29 Liat Hadar  30 Lubos Halada  31 Melinda Halassy  32 Herman Hummel  33 Kaisa-Leena Huttunen  34   35 Bogdan Jaroszewicz  36 Thomas C Jensen  37 Henrik Kalivoda  38 Inger Kappel Schmidt  39 Ingrid Kröncke  40 Reima Leinonen  41 Filipe Martinho  42 Henning Meesenburg  43 Julia Meyer  40 Stefano Minerbi  44 Don Monteith  26 Boris P Nikolov  25 Daniel Oro  45   46 Dāvis Ozoliņš  47 Bachisio M Padedda  48 Denise Pallett  49 Marco Pansera  20 Miguel Ângelo Pardal  42 Bruno Petriccione  50 Tanja Pipan  51 Juha Pöyry  52 Stefanie M Schäfer  49 Marcus Schaub  53 Susanne C Schneider  54 Agnija Skuja  47 Karline Soetaert  33 Gunta Spriņģe  47 Radoslav Stanchev  25 Jenni A Stockan  55 Stefan Stoll  56   57 Lisa Sundqvist  58 Anne Thimonier  53 Gert Van Hoey  59 Gunther Van Ryckegem  60 Marcel E Visser  61 Samuel Vorhauser  7 Peter Haase  62   63
Affiliations
Meta-Analysis

Meta-analysis of multidecadal biodiversity trends in Europe

Francesca Pilotto et al. Nat Commun. .

Abstract

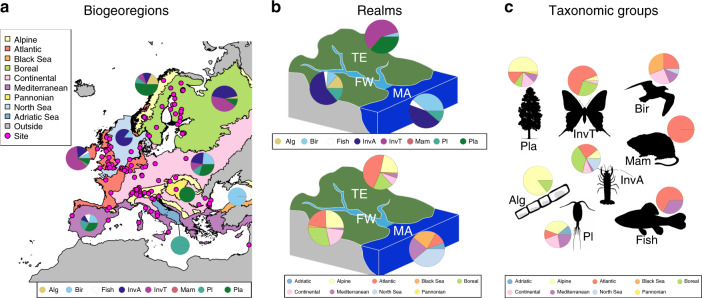
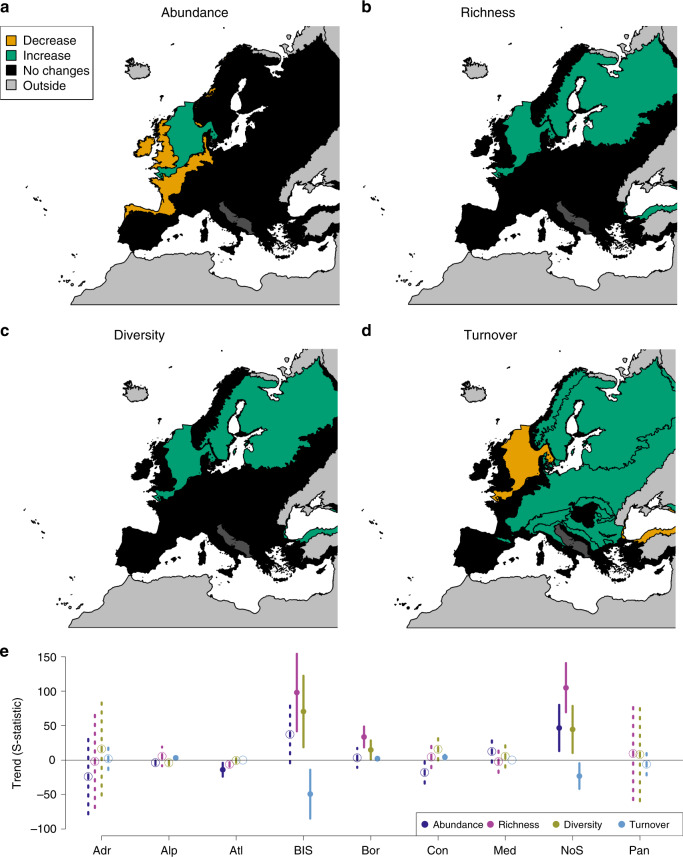
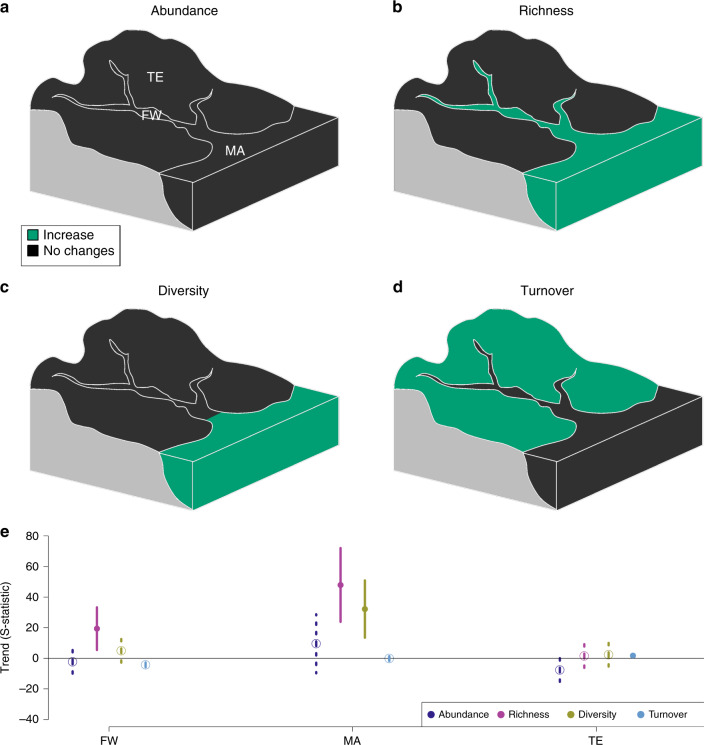
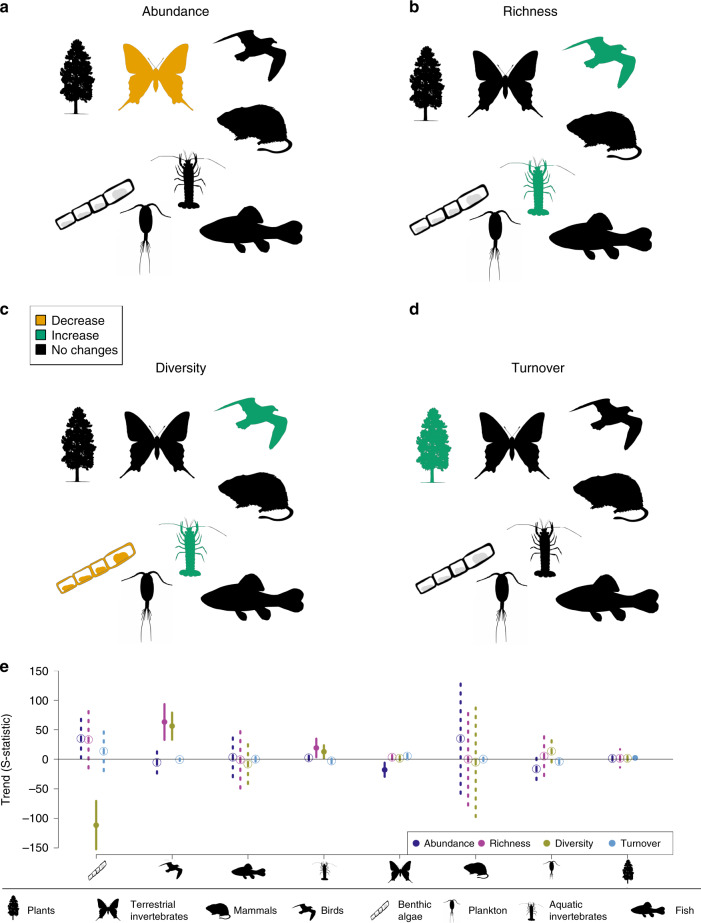
Local biodiversity trends over time are likely to be decoupled from global trends, as local processes may compensate or counteract global change. We analyze 161 long-term biological time series (15-91 years) collected across Europe, using a comprehensive dataset comprising ~6,200 marine, freshwater and terrestrial taxa. We test whether (i) local long-term biodiversity trends are consistent among biogeoregions, realms and taxonomic groups, and (ii) changes in biodiversity correlate with regional climate and local conditions. Our results reveal that local trends of abundance, richness and diversity differ among biogeoregions, realms and taxonomic groups, demonstrating that biodiversity changes at local scale are often complex and cannot be easily generalized. However, we find increases in richness and abundance with increasing temperature and naturalness as well as a clear spatial pattern in changes in community composition (i.e. temporal taxonomic turnover) in most biogeoregions of Northern and Eastern Europe.


Conflict of interest statement

The authors declare no competing interests.

Figures

Fig. 1
Fig. 1. Distribution of the time series across biogeoregions, realms and taxonomic groups.
a Relative distribution of studied taxonomic groups across biogeoregions (magenta dots: study sites). Note that the most south-eastern site (in Israel) belongs to the Mediterranean region. b Relative distribution of studied taxonomic groups and biogeoregions across realms. c Relative distribution of studied biogeoregions across taxonomic groups. FW freshwater, MA marine and transitional zone, TE terrestrial, Alg benthic algae, Bir birds, InvA aquatic invertebrates, InvT terrestrial invertebrates, Mam mammals, Pl plankton, Pla terrestrial plants. The pie charts show the proportion of taxonomic groups for each biogeoregion and realm, and the proportion of biogeoregions for each realm and taxonomic group. The shapefiles of the biogeographical regions and marine subregions were obtained from EEA. Drawings of taxonomic groups are from phylopic.org. Source data are provided as a Source Data file.
Fig. 2
Fig. 2. Biodiversity trends in the different biogeoregions.
The results of meta-analysis mixed models are shown for the four studied biodiversity metrics: abundance (a), richness (b), diversity (c) and turnover (d). Green: significant increasing trends (p ≤ 0.05); orange: significantly declining trends (p ≤ 0.05); black (dark grey for Adriatic Sea): no significant trends (p > 0.05). For biogeoregion identity see Fig. 1. e Values of S-statistics (model estimated mean, error bar: +/− C.I.). Adr: Adriatic (n = 1 time series), Alp: Alpine (n = 33 time series), Atl Atlantic (n = 56 time series), BlS Black Sea (n = 5 time series), Bor Boreal (n = 32 time series), Con Continental (n = 17 time series), Med Mediterranean (n = 9 time series), NoS North Sea (n = 7 time series), and Pan Pannonian (n = 1 time series). Dark blue: abundance, pink: richness, yellow: diversity, light blue: turnover. Solid line and dot: p ≤ 0.05; dashed line and open circle: p > 0.05. Source data are provided as a Source Data file.
Fig. 3
Fig. 3. Biodiversity trends in the three realms.
The results of meta-analysis mixed models are shown for the four studied biodiversity metrics: abundance (a), richness (b), diversity (c) and turnover (d). Green: significant increasing trends (p ≤ 0.05); black: no significant trends (p > 0.05). e Values of S-statistics (model estimated mean, error bar: +/−C.I.). Dark blue: abundance, pink: richness, yellow: diversity, light blue: turnover. Solid line and dot: p ≤ 0.05; dashed line and open circle: p > 0.05. FW freshwater (n = 51 time series); MA marine and transitional zones (n = 18 time series); TE terrestrial (n = 92 time series). Source data are provided as a Source Data file.
Fig. 4
Fig. 4. Biodiversity trends for the studied taxonomic groups.
The results of meta-analysis mixed models are shown for the four studied biodiversity metrics: abundance (a), richness (b), diversity (c) and turnover (d). Green: significant increasing trends (p ≤ 0.05); orange: significant declining trends (p ≤ 0.05); black: no significant trends (p > 0.05). Drawings from phylopic.org. e values of S-statistics (model estimated mean, error bar: +/−C.I.). Dark blue: abundance, pink: richness, yellow: diversity, light blue: turnover. Solid line and dot: p ≤ 0.05; dashed line and open circle: p > 0.05. Number of time series (n): Plants: 34, terrestrial invertebrates: 53, mammals: 1, birds: 16, benthic algae: 7, plankton: 9, aquatic invertebrates: 38, fish: 3. Source data are provided as a Source Data file.

References

    1. WWF. Living Planet Report 2016. Risk and Resilience in a New Era. (Gland, Switzerland: WWW International, 2016).
    1. Johnson CN, et al. Biodiversity losses and conservation responses in the Anthropocene. Science. 2017;356:270–275. - PubMed
    1. Dirzo R, et al. Defaunation in the Anthropocene. Science. 2014;345:401–406. - PubMed
    1. IPBES. Summary for policymakers of the global assessment report on biodiversity and ecosystem services of the Intergovernmental Science-Policy Platform on Biodiversity and Ecosystem Services. (IPBES secretariat, 2019).
    1. Sax DF, Gaines SD. Species diversity: from global decreases to local increases. Trends Ecol. Evol. 2003;18:561–566.

Publication types

LinkOut - more resources