. 2020 Sep;26(9):1452-1458.
doi: 10.1038/s41591-020-0964-7. Epub 2020 Jul 13.

Myocardial infarction accelerates breast cancer via innate immune reprogramming

Affiliations

Myocardial infarction accelerates breast cancer via innate immune reprogramming

Graeme J Koelwyn et al. Nat Med. 2020 Sep.

Abstract

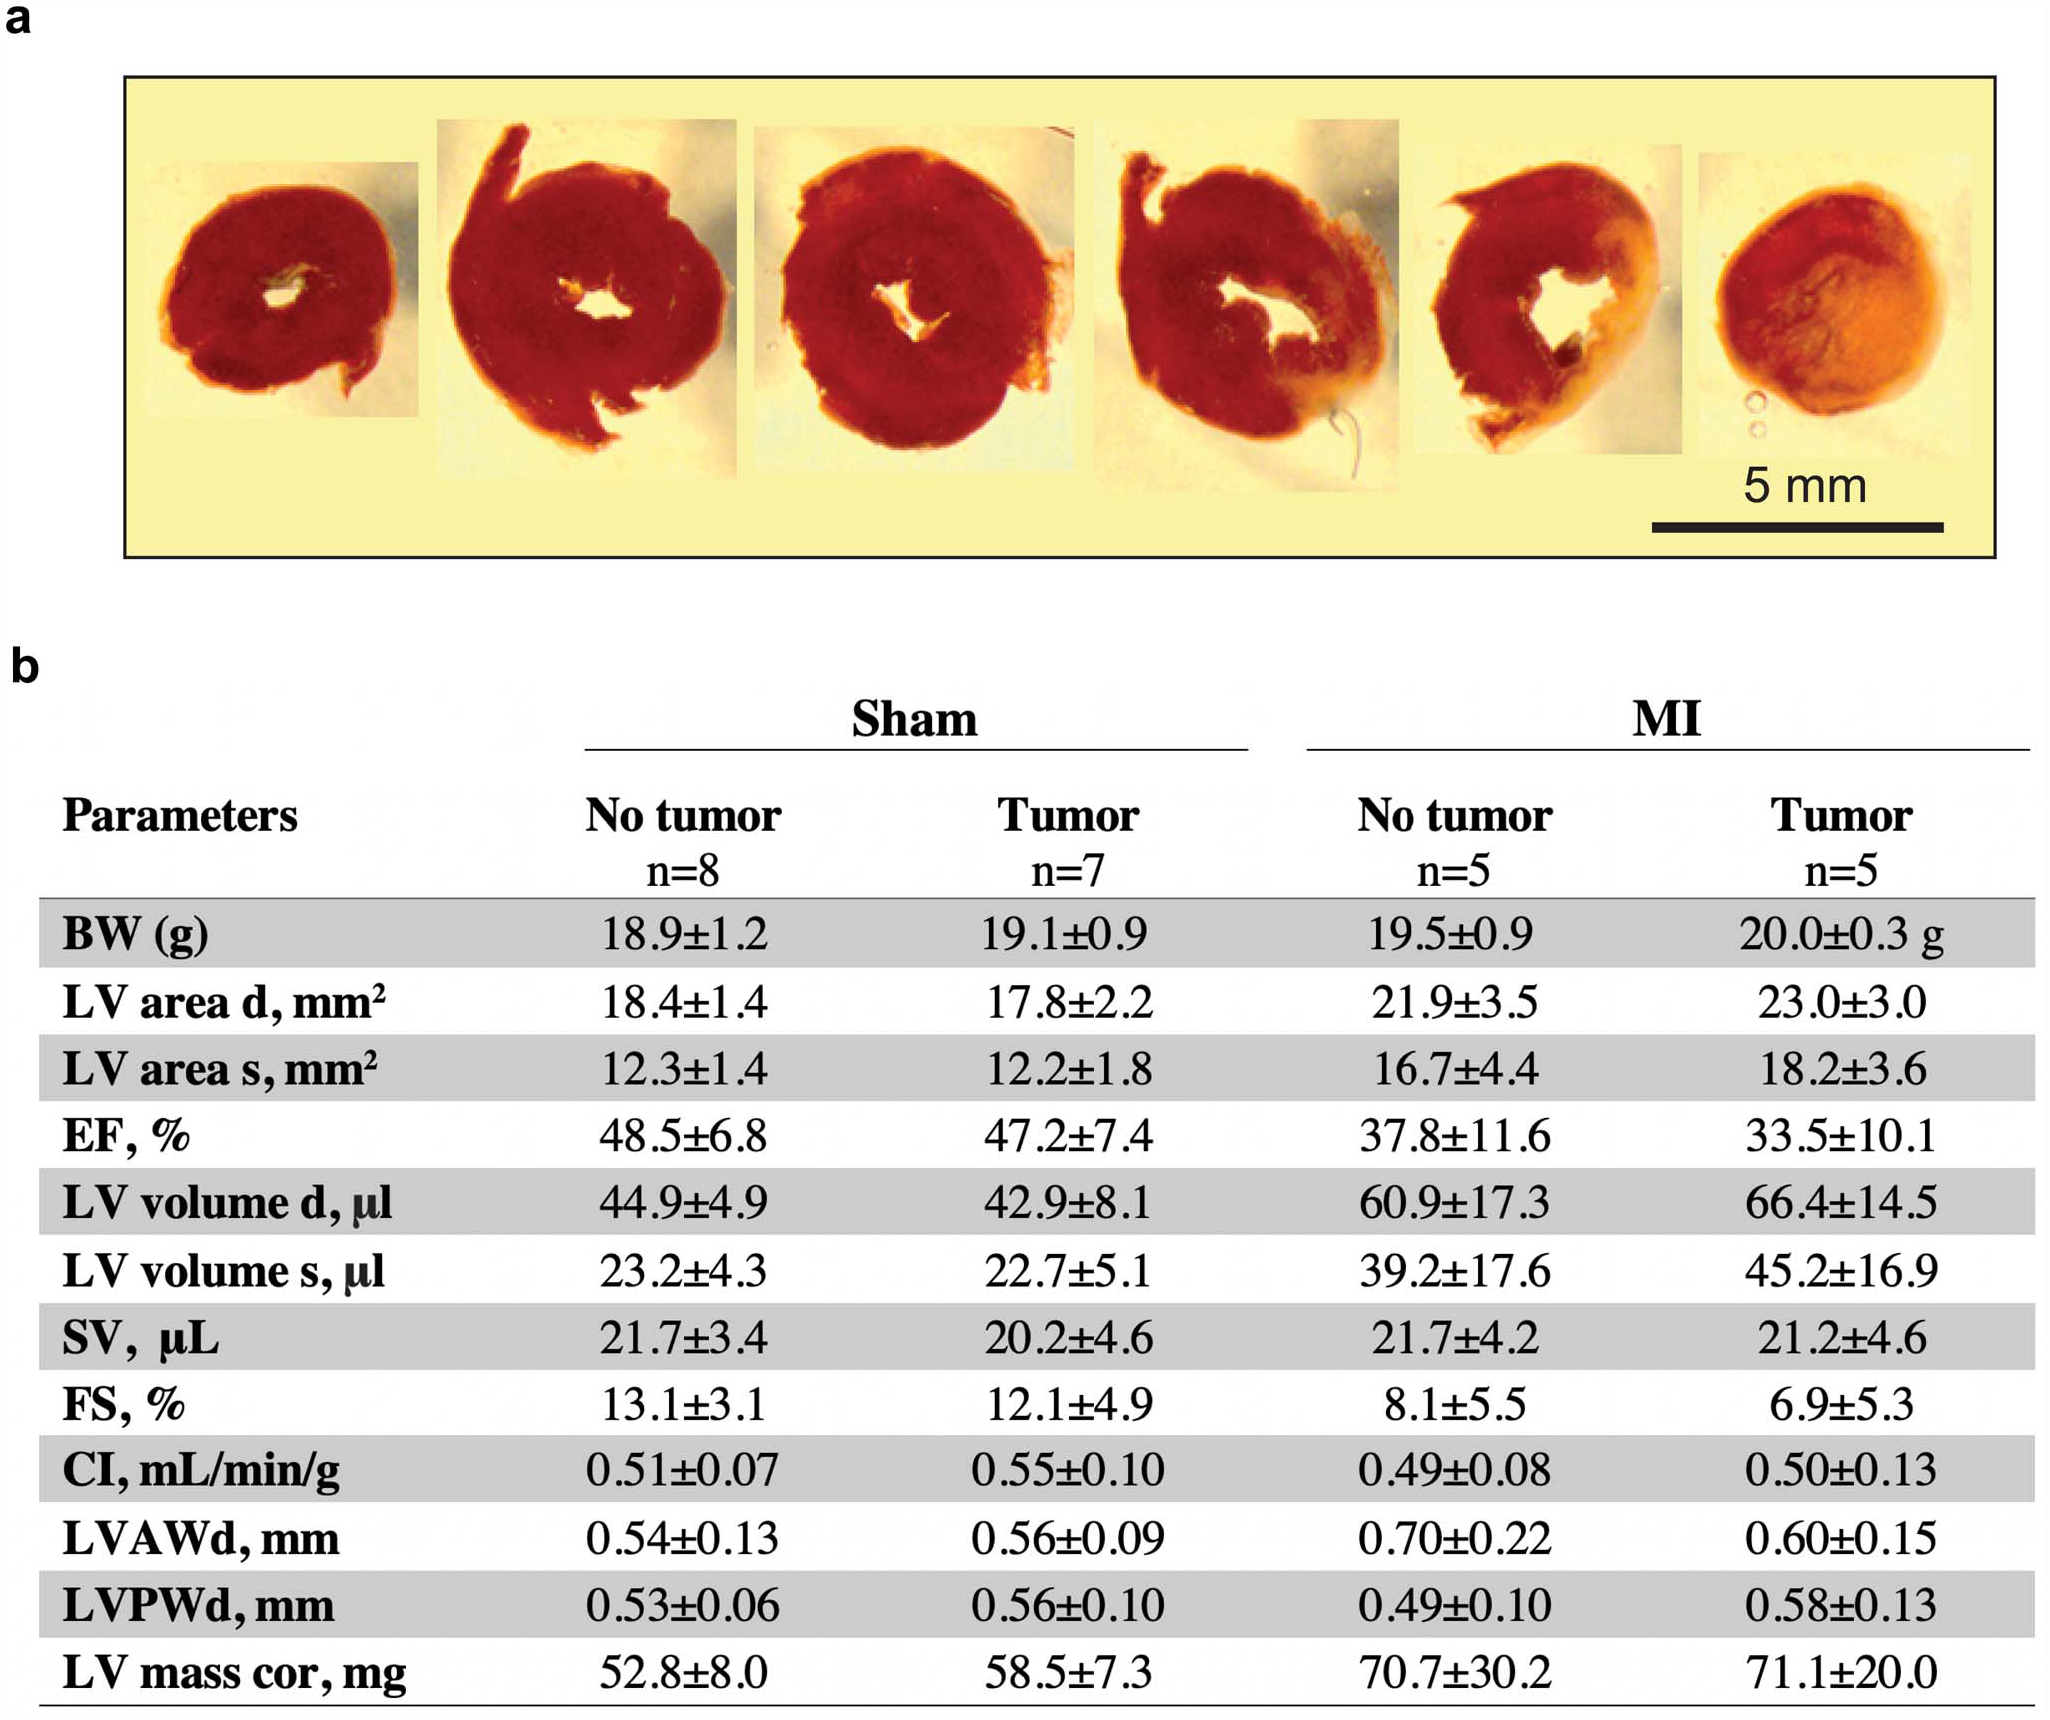
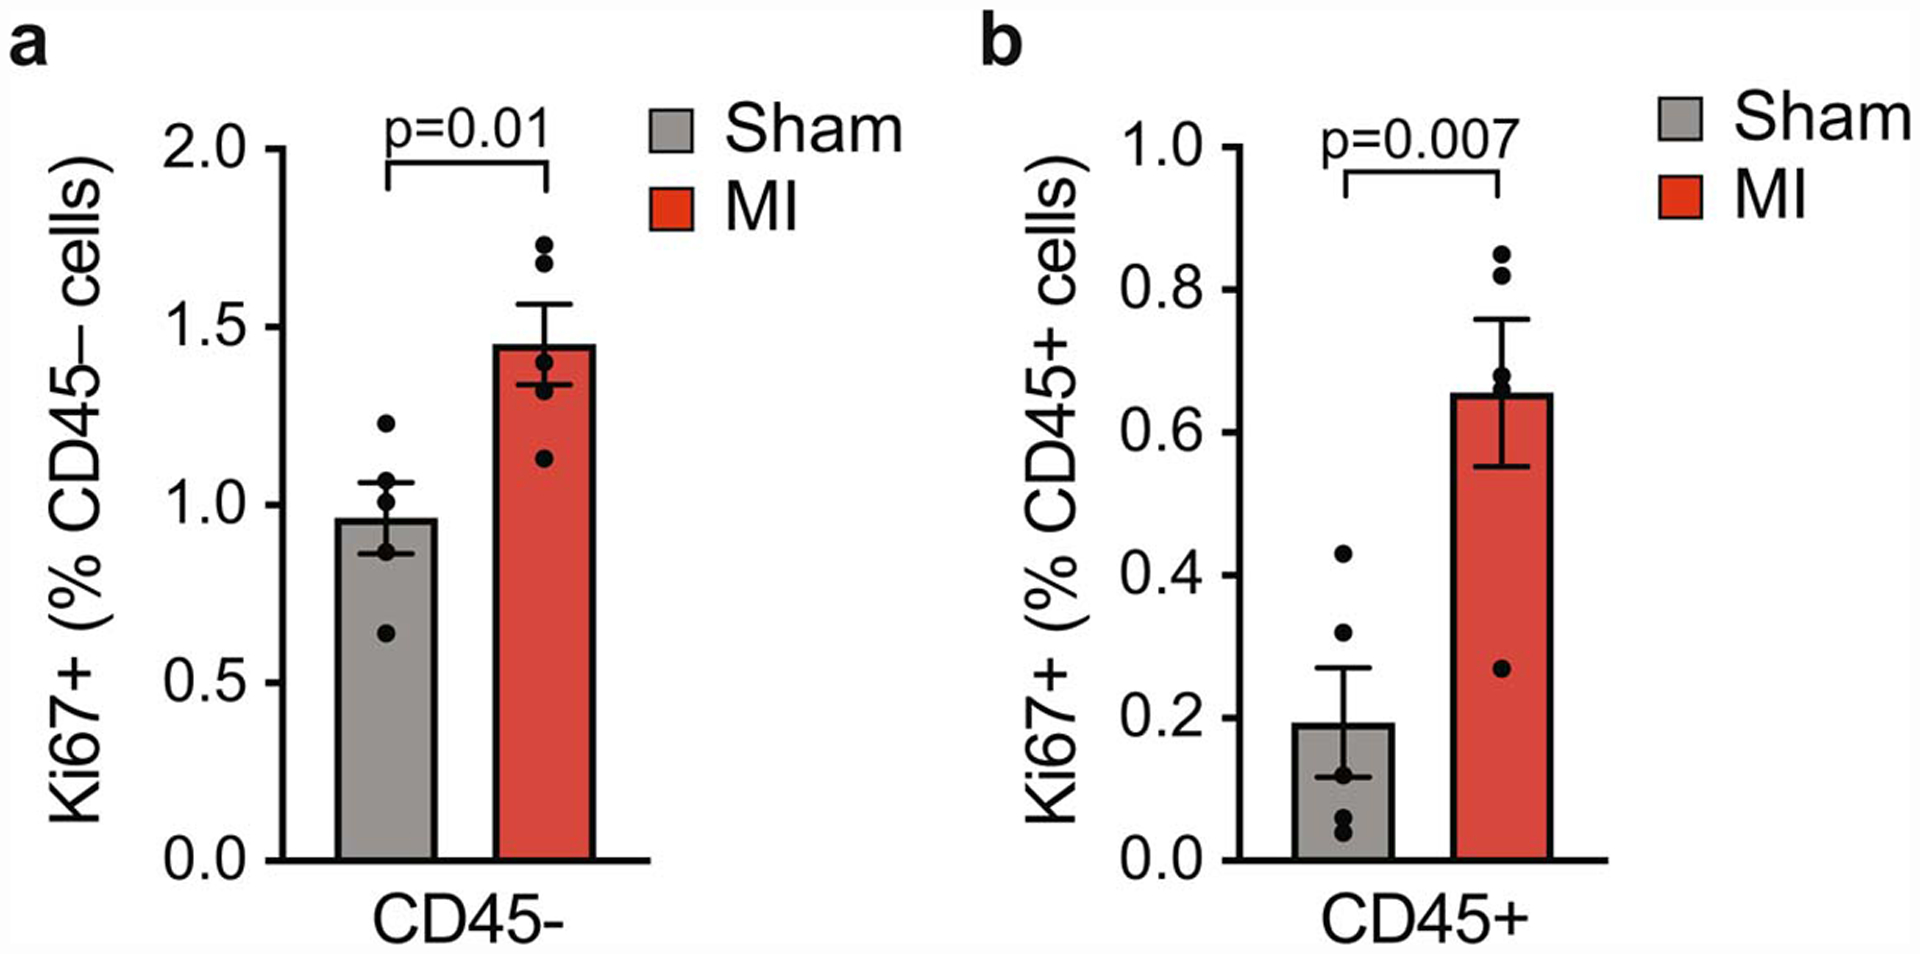
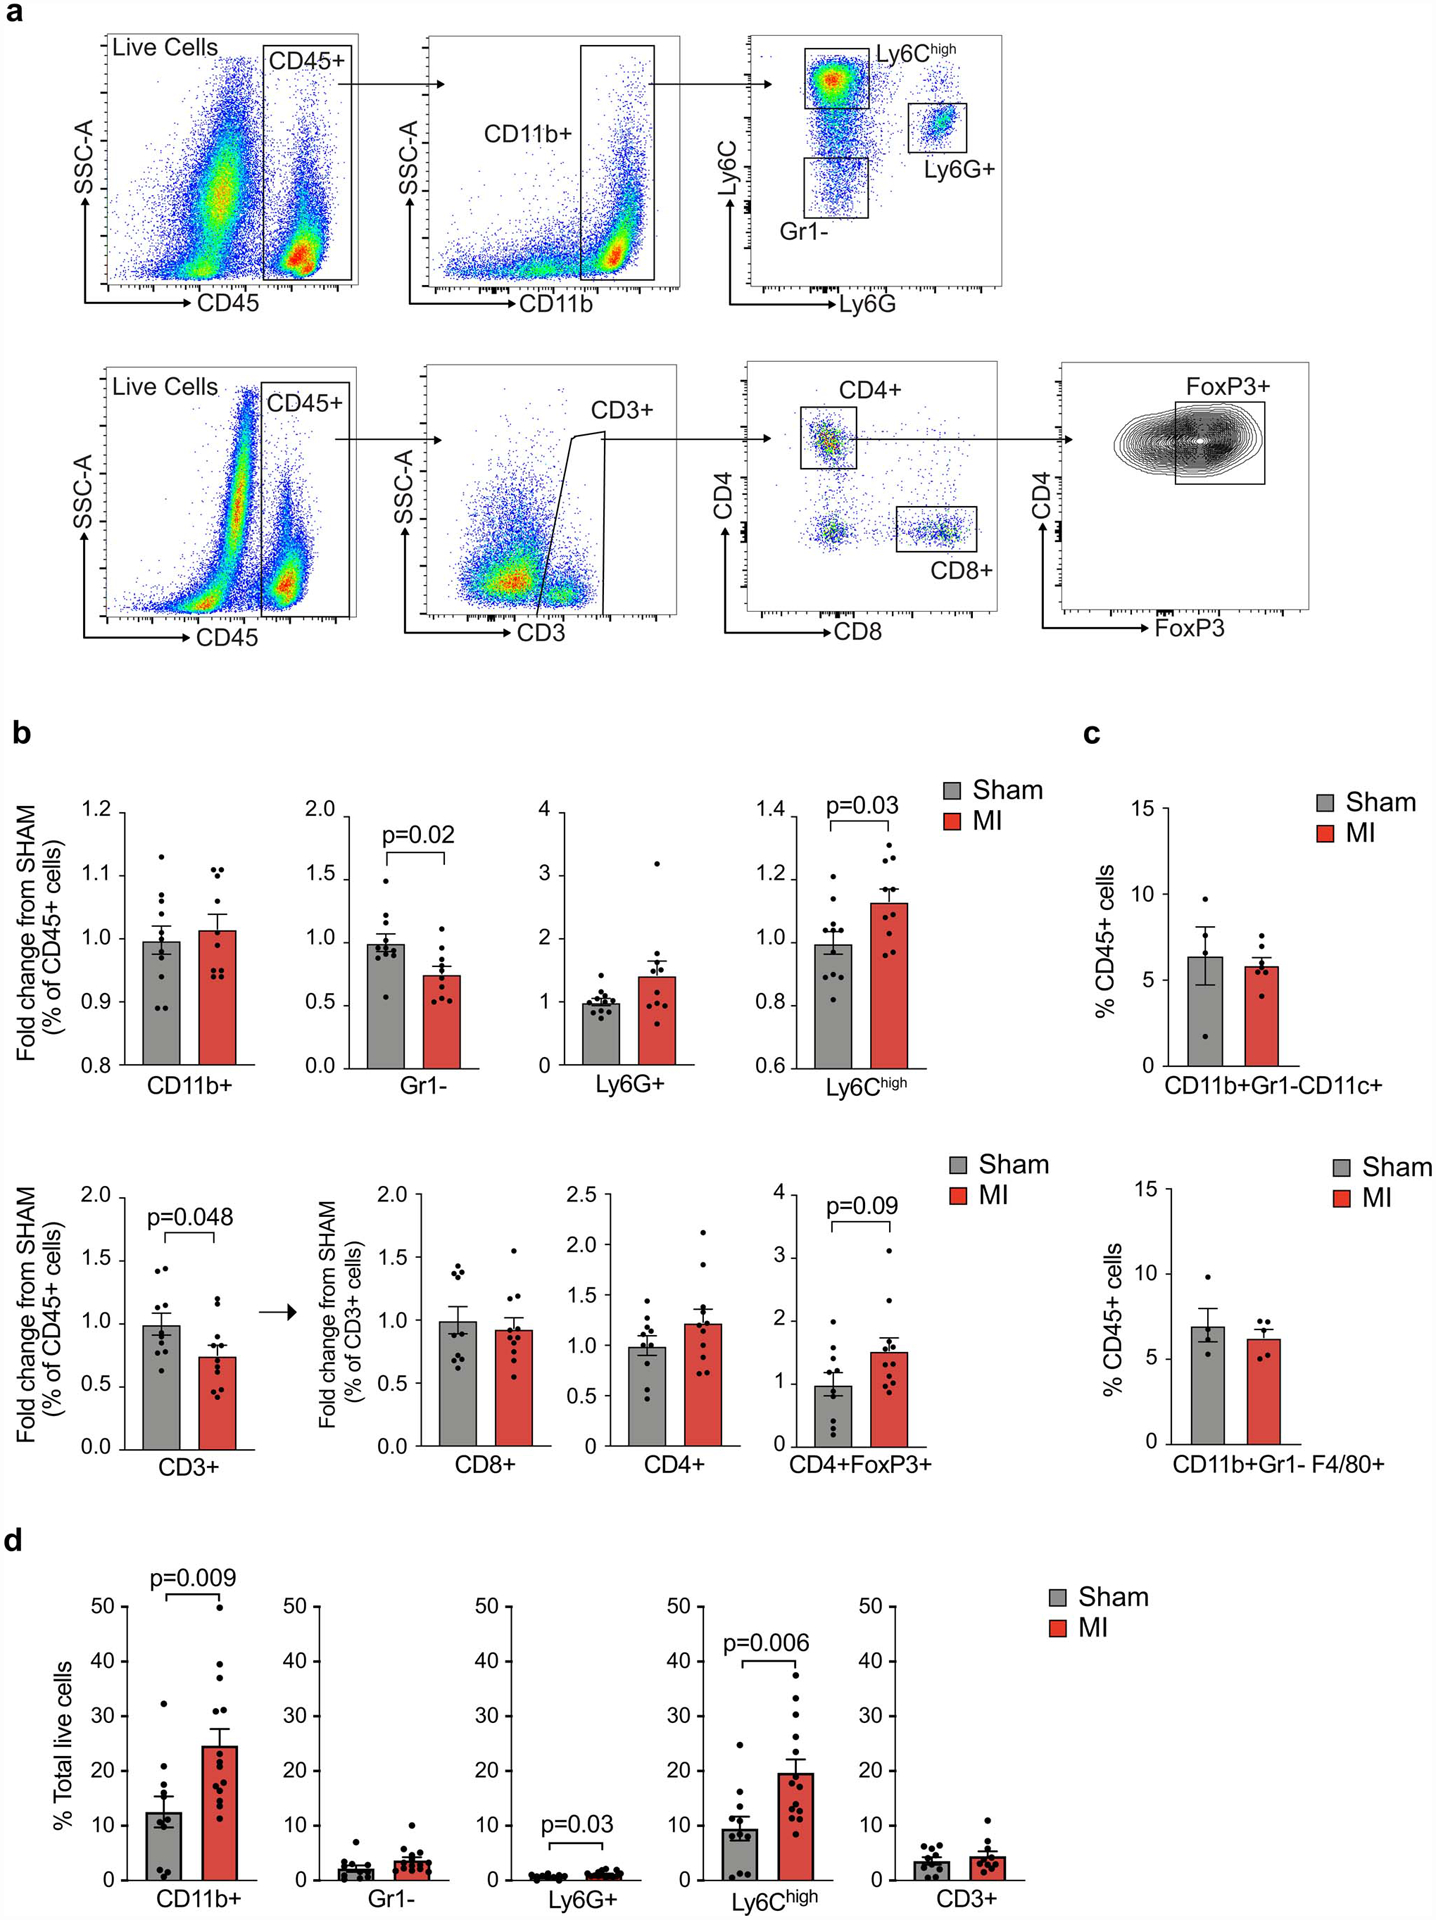
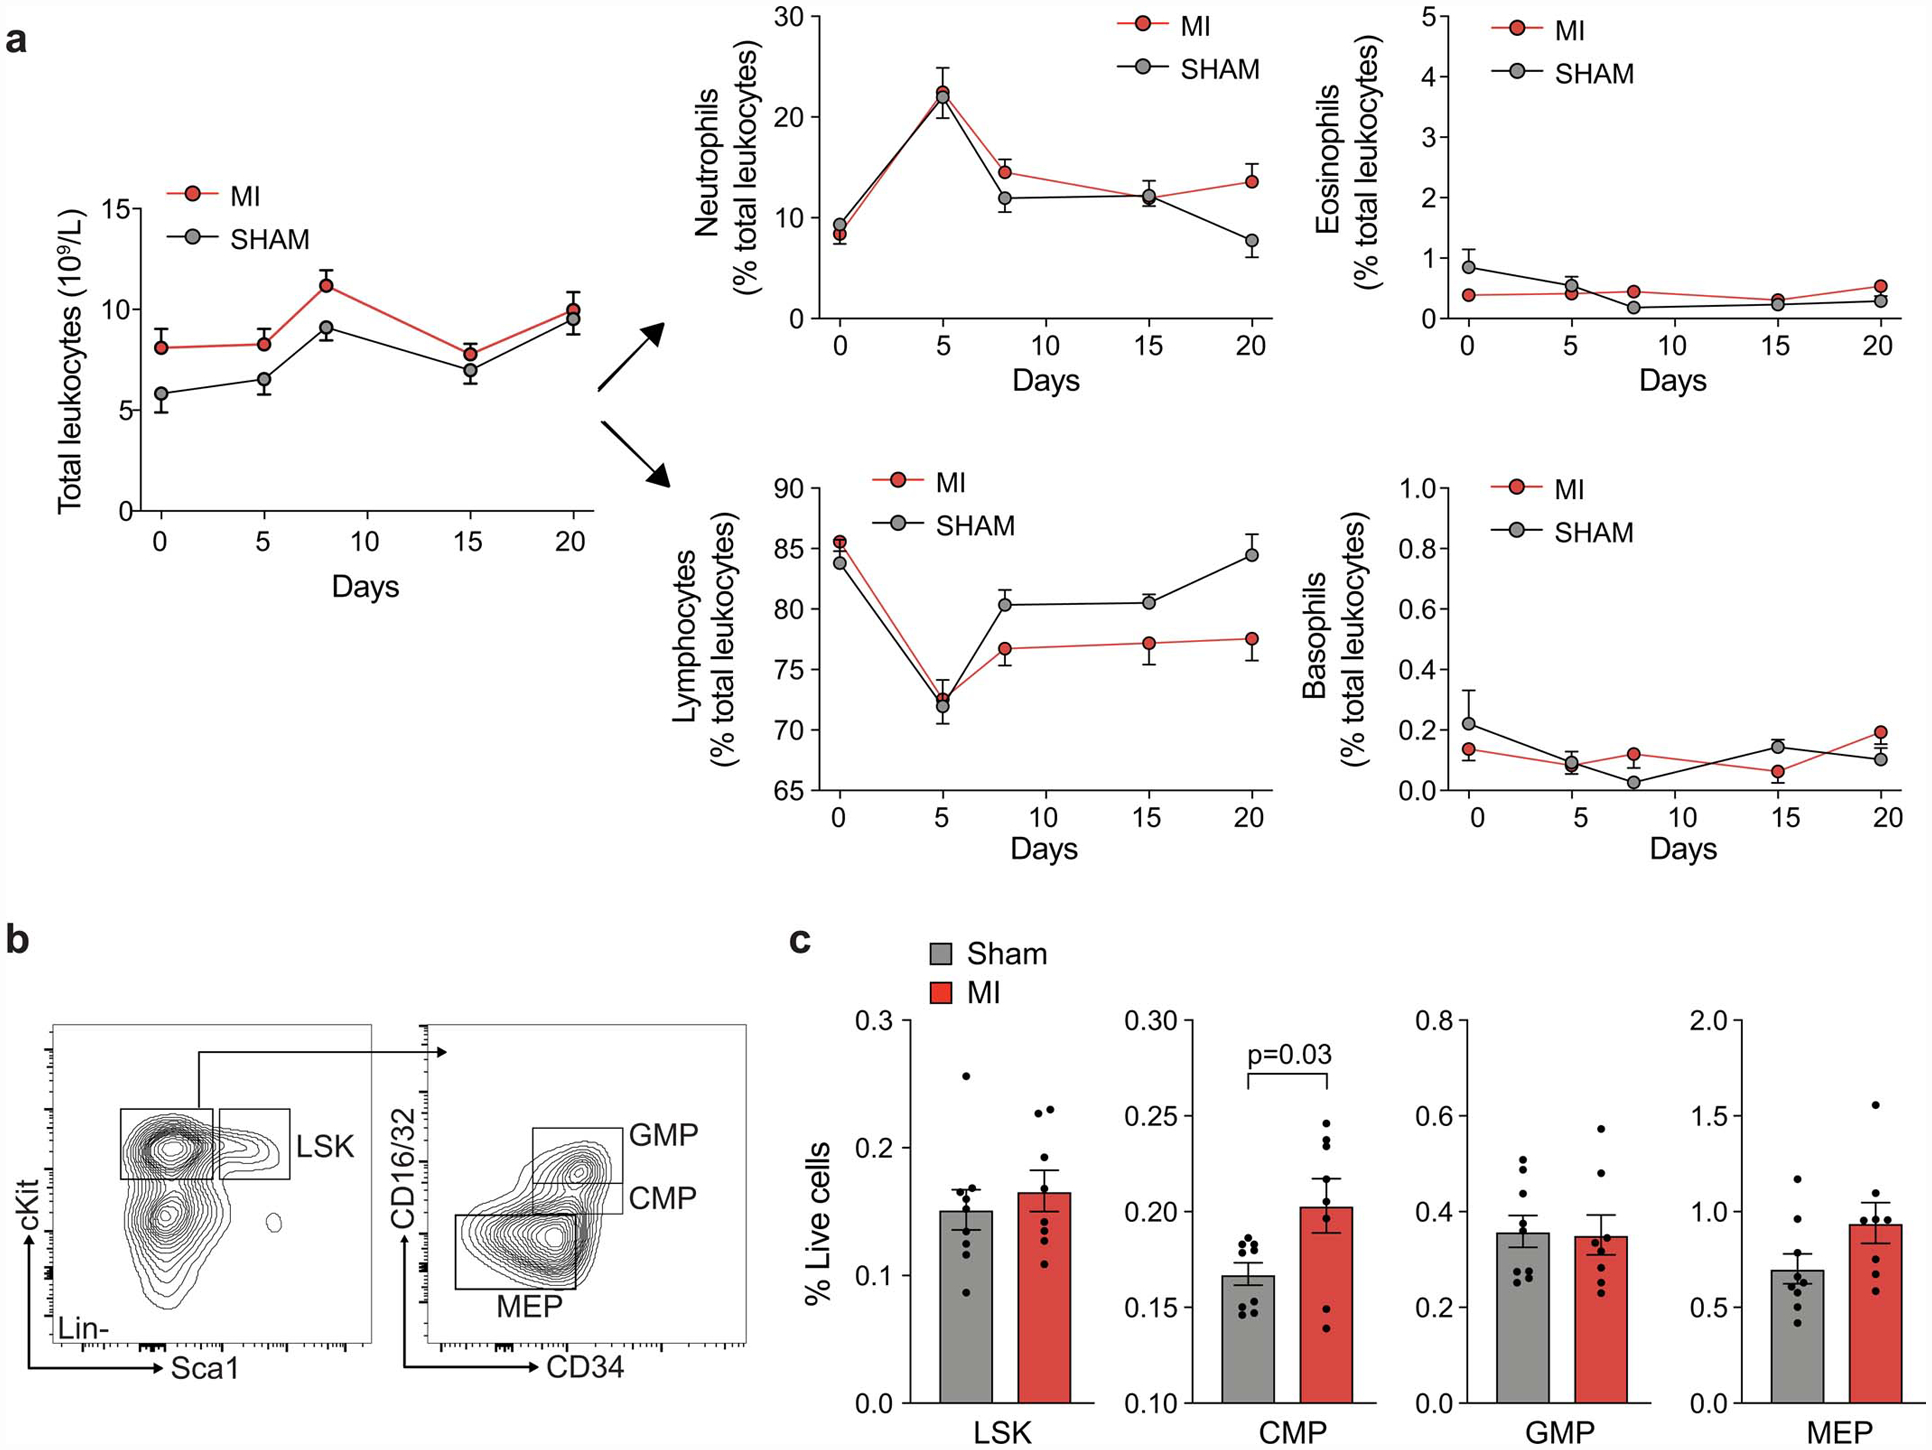
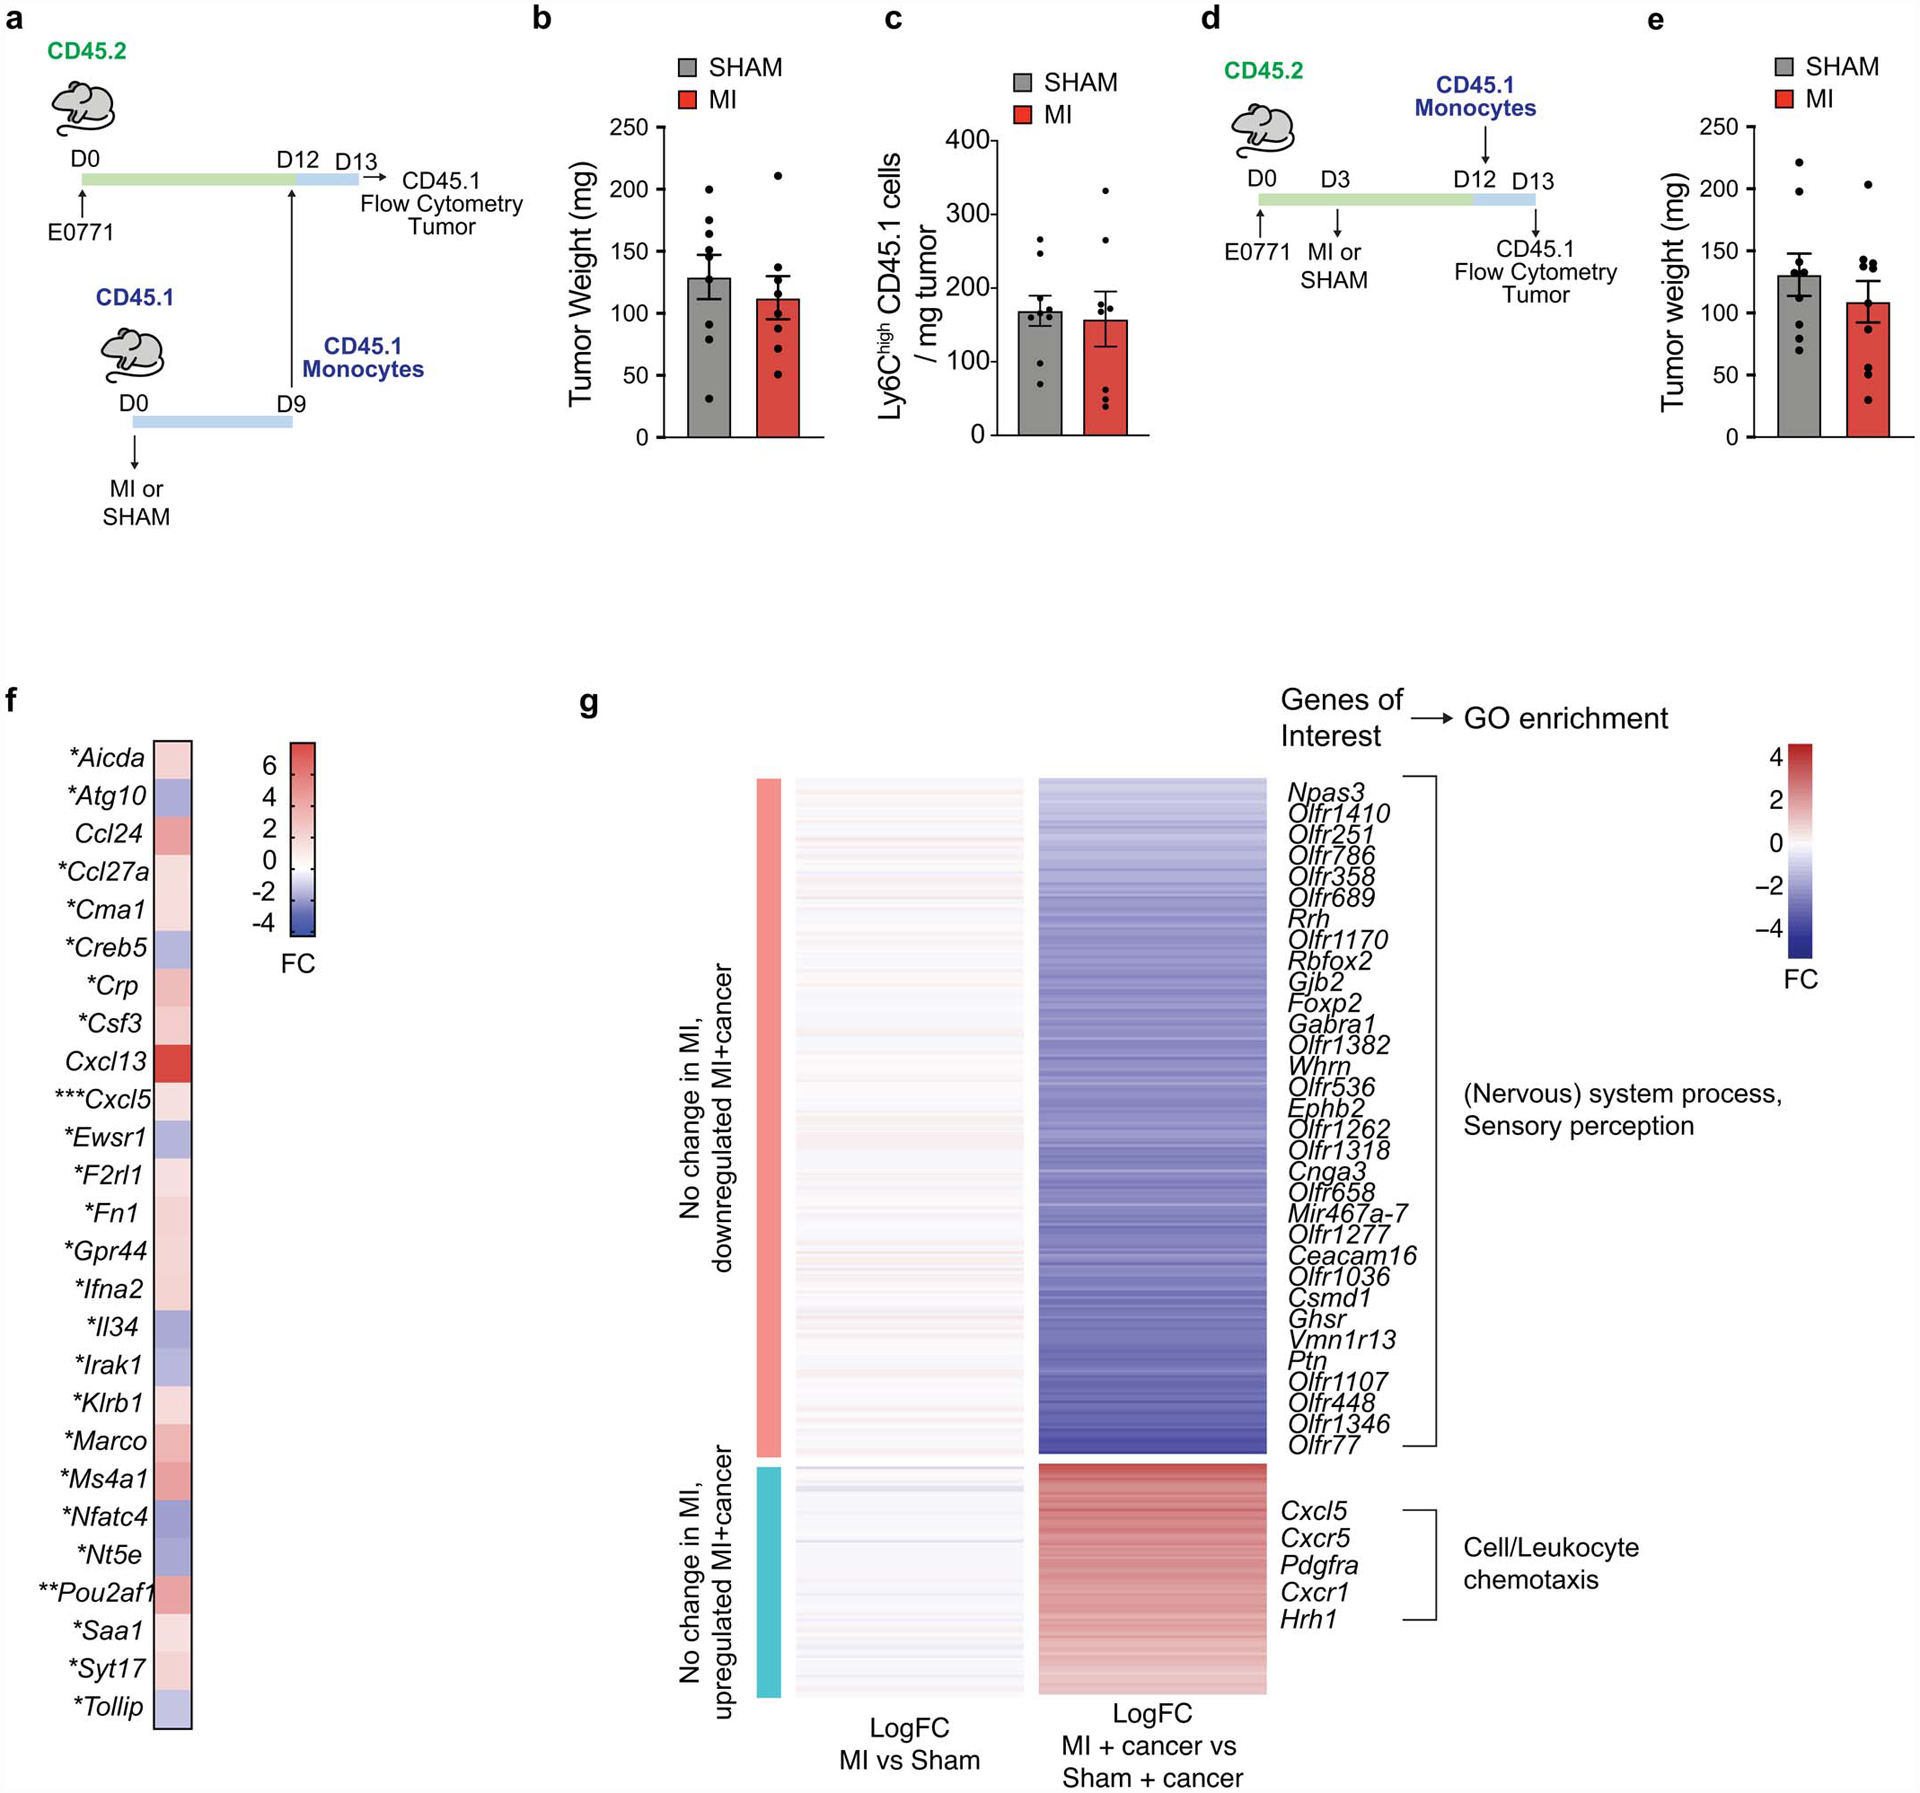
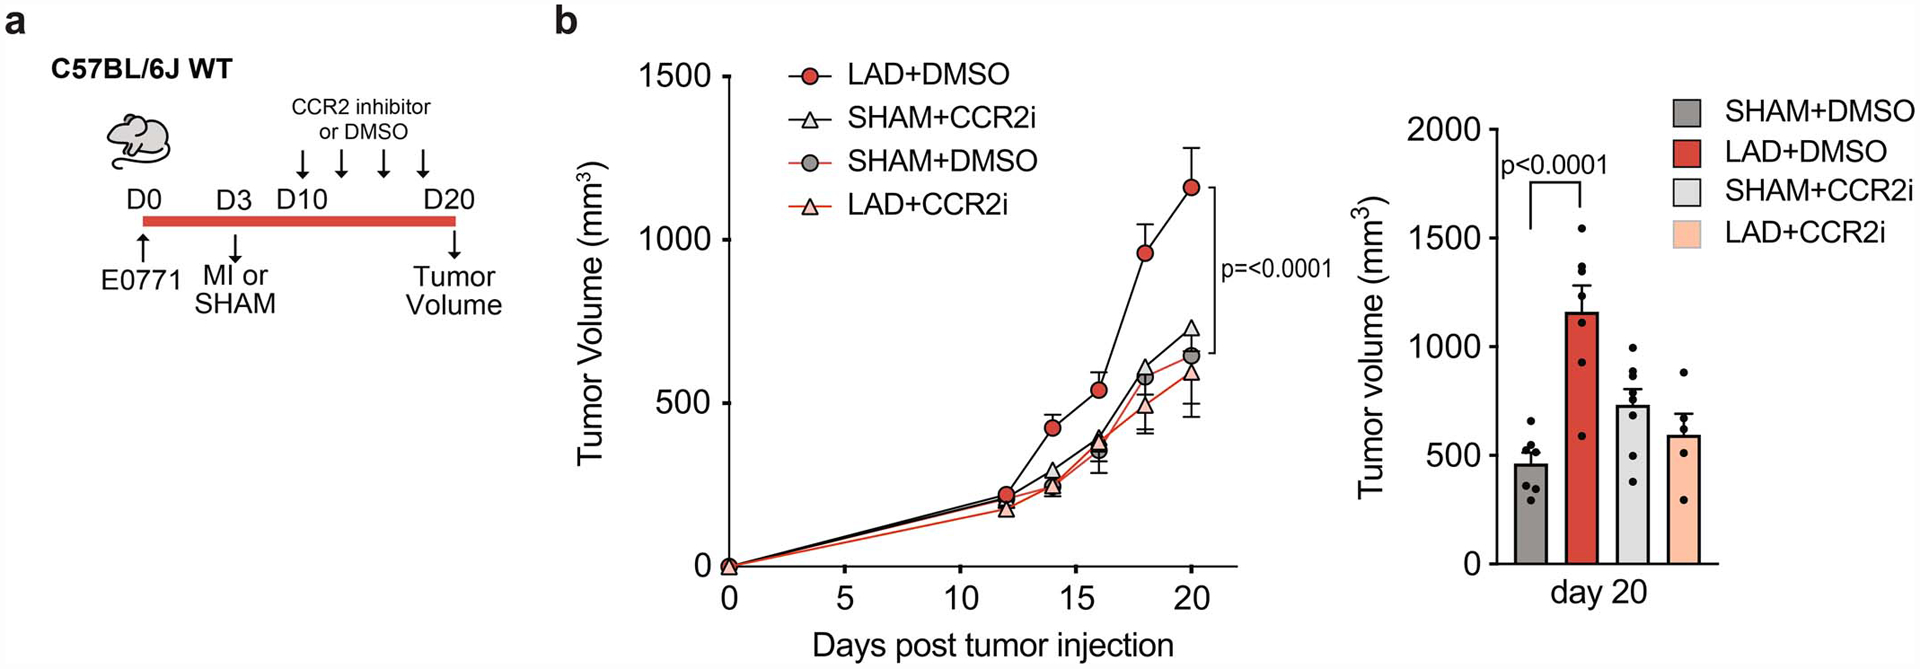
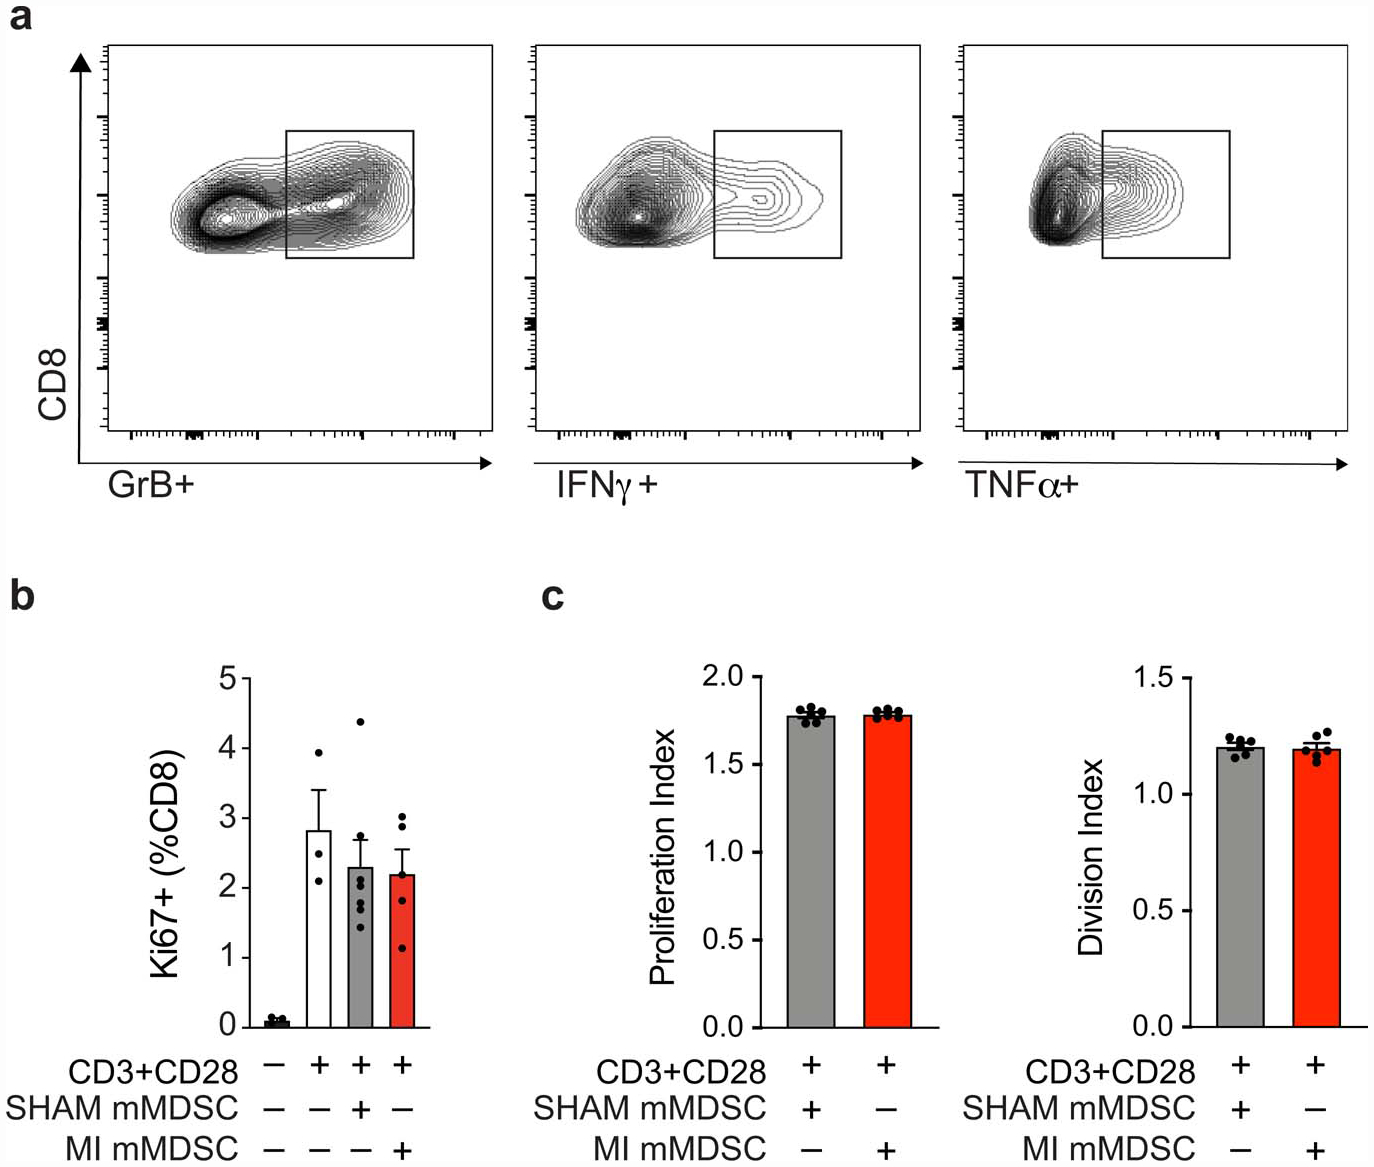
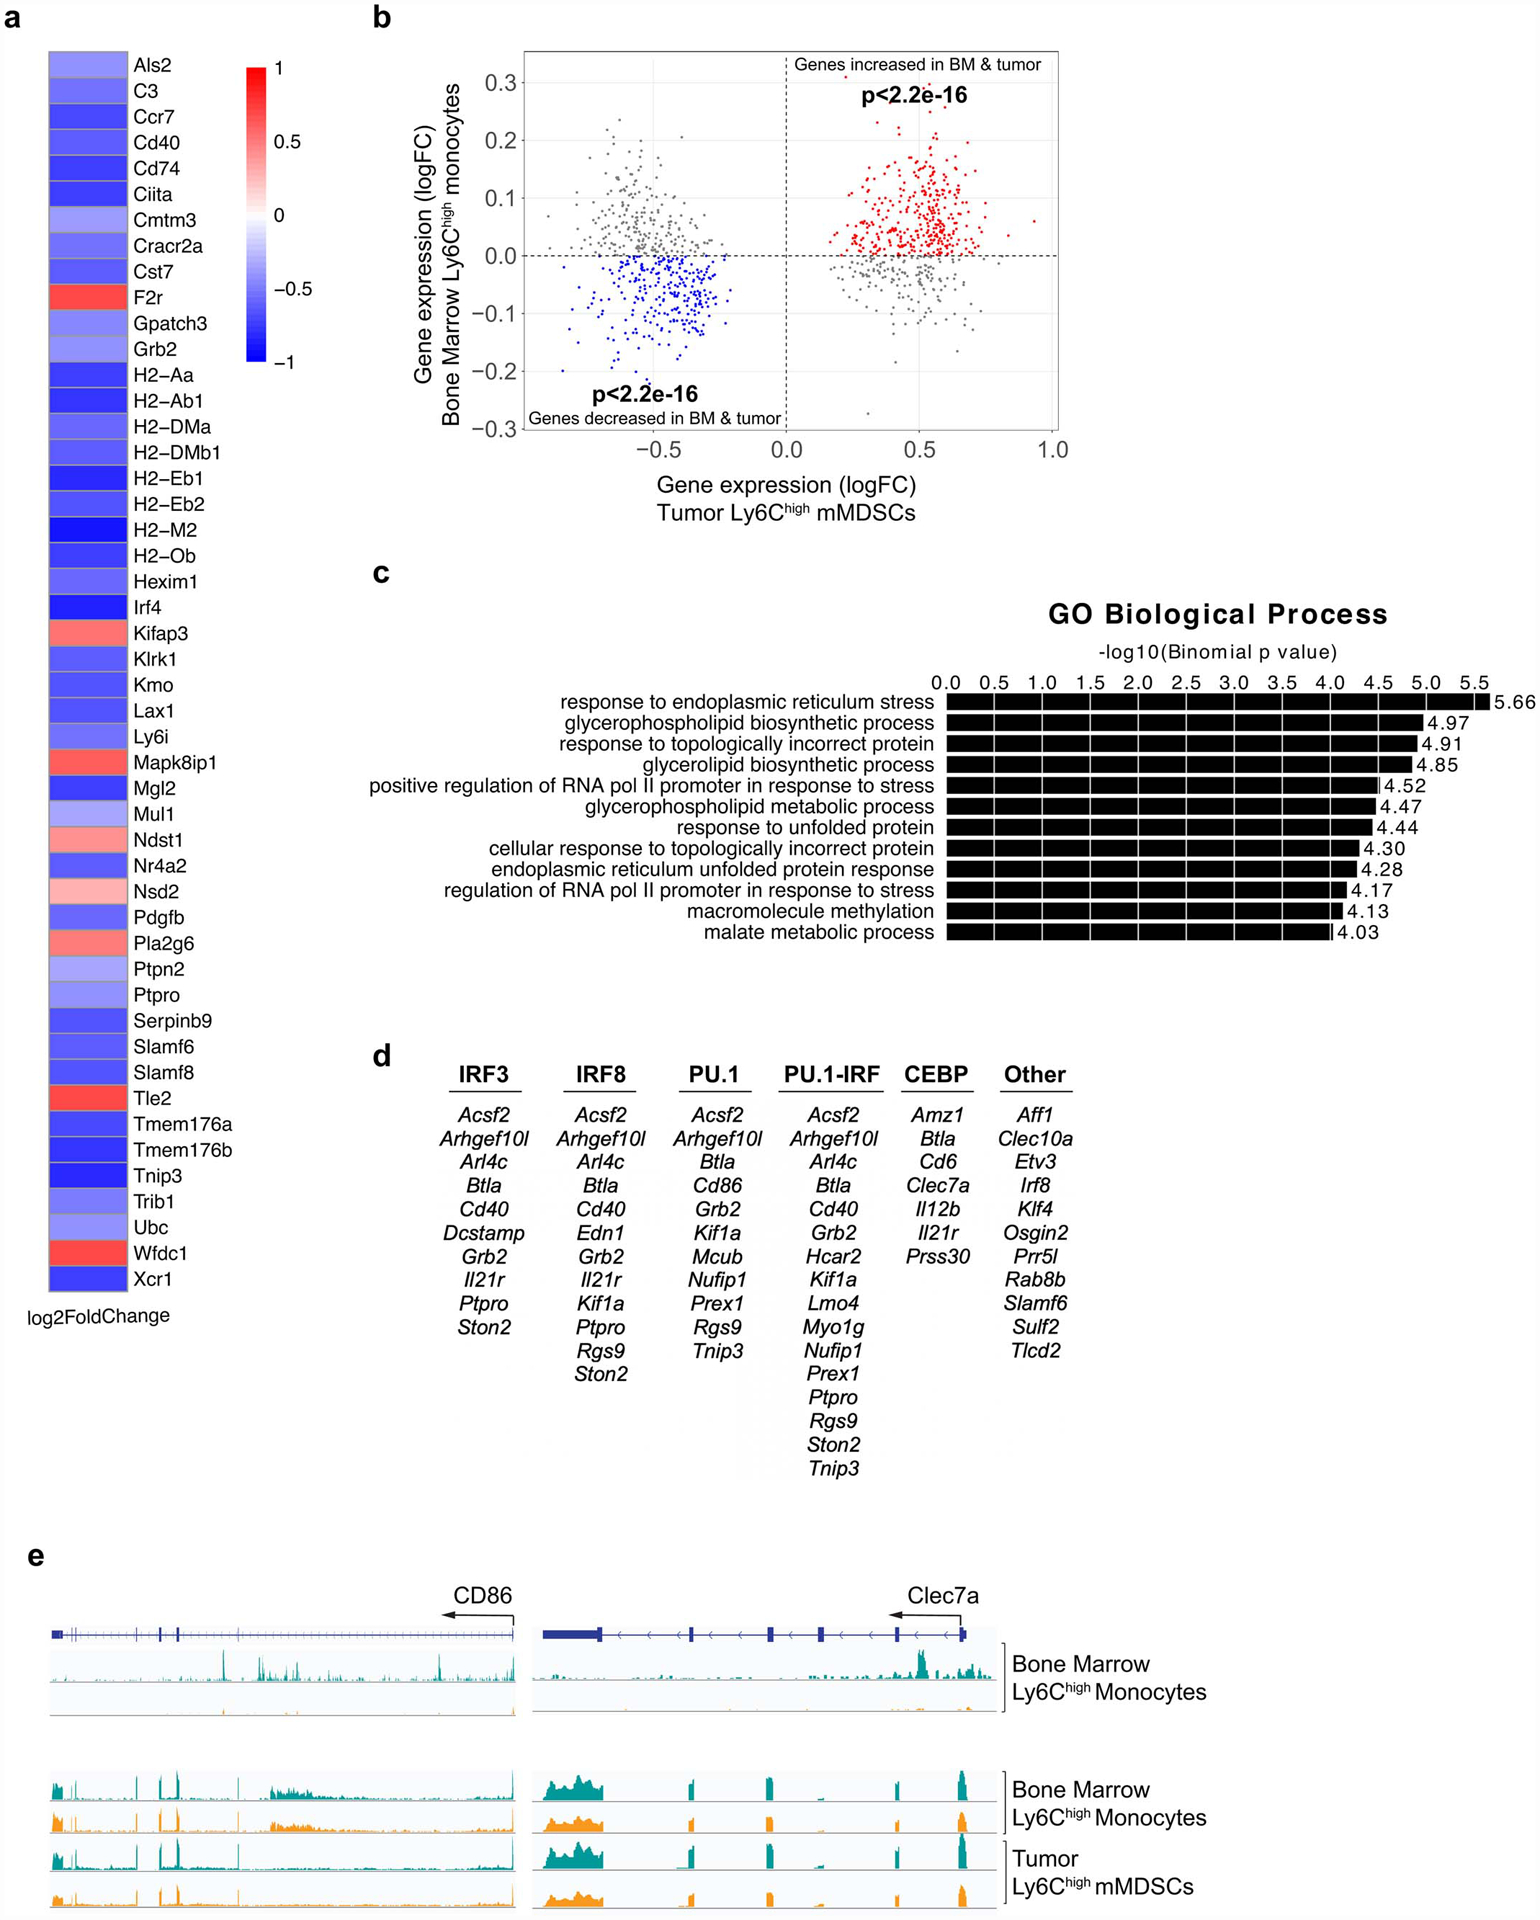
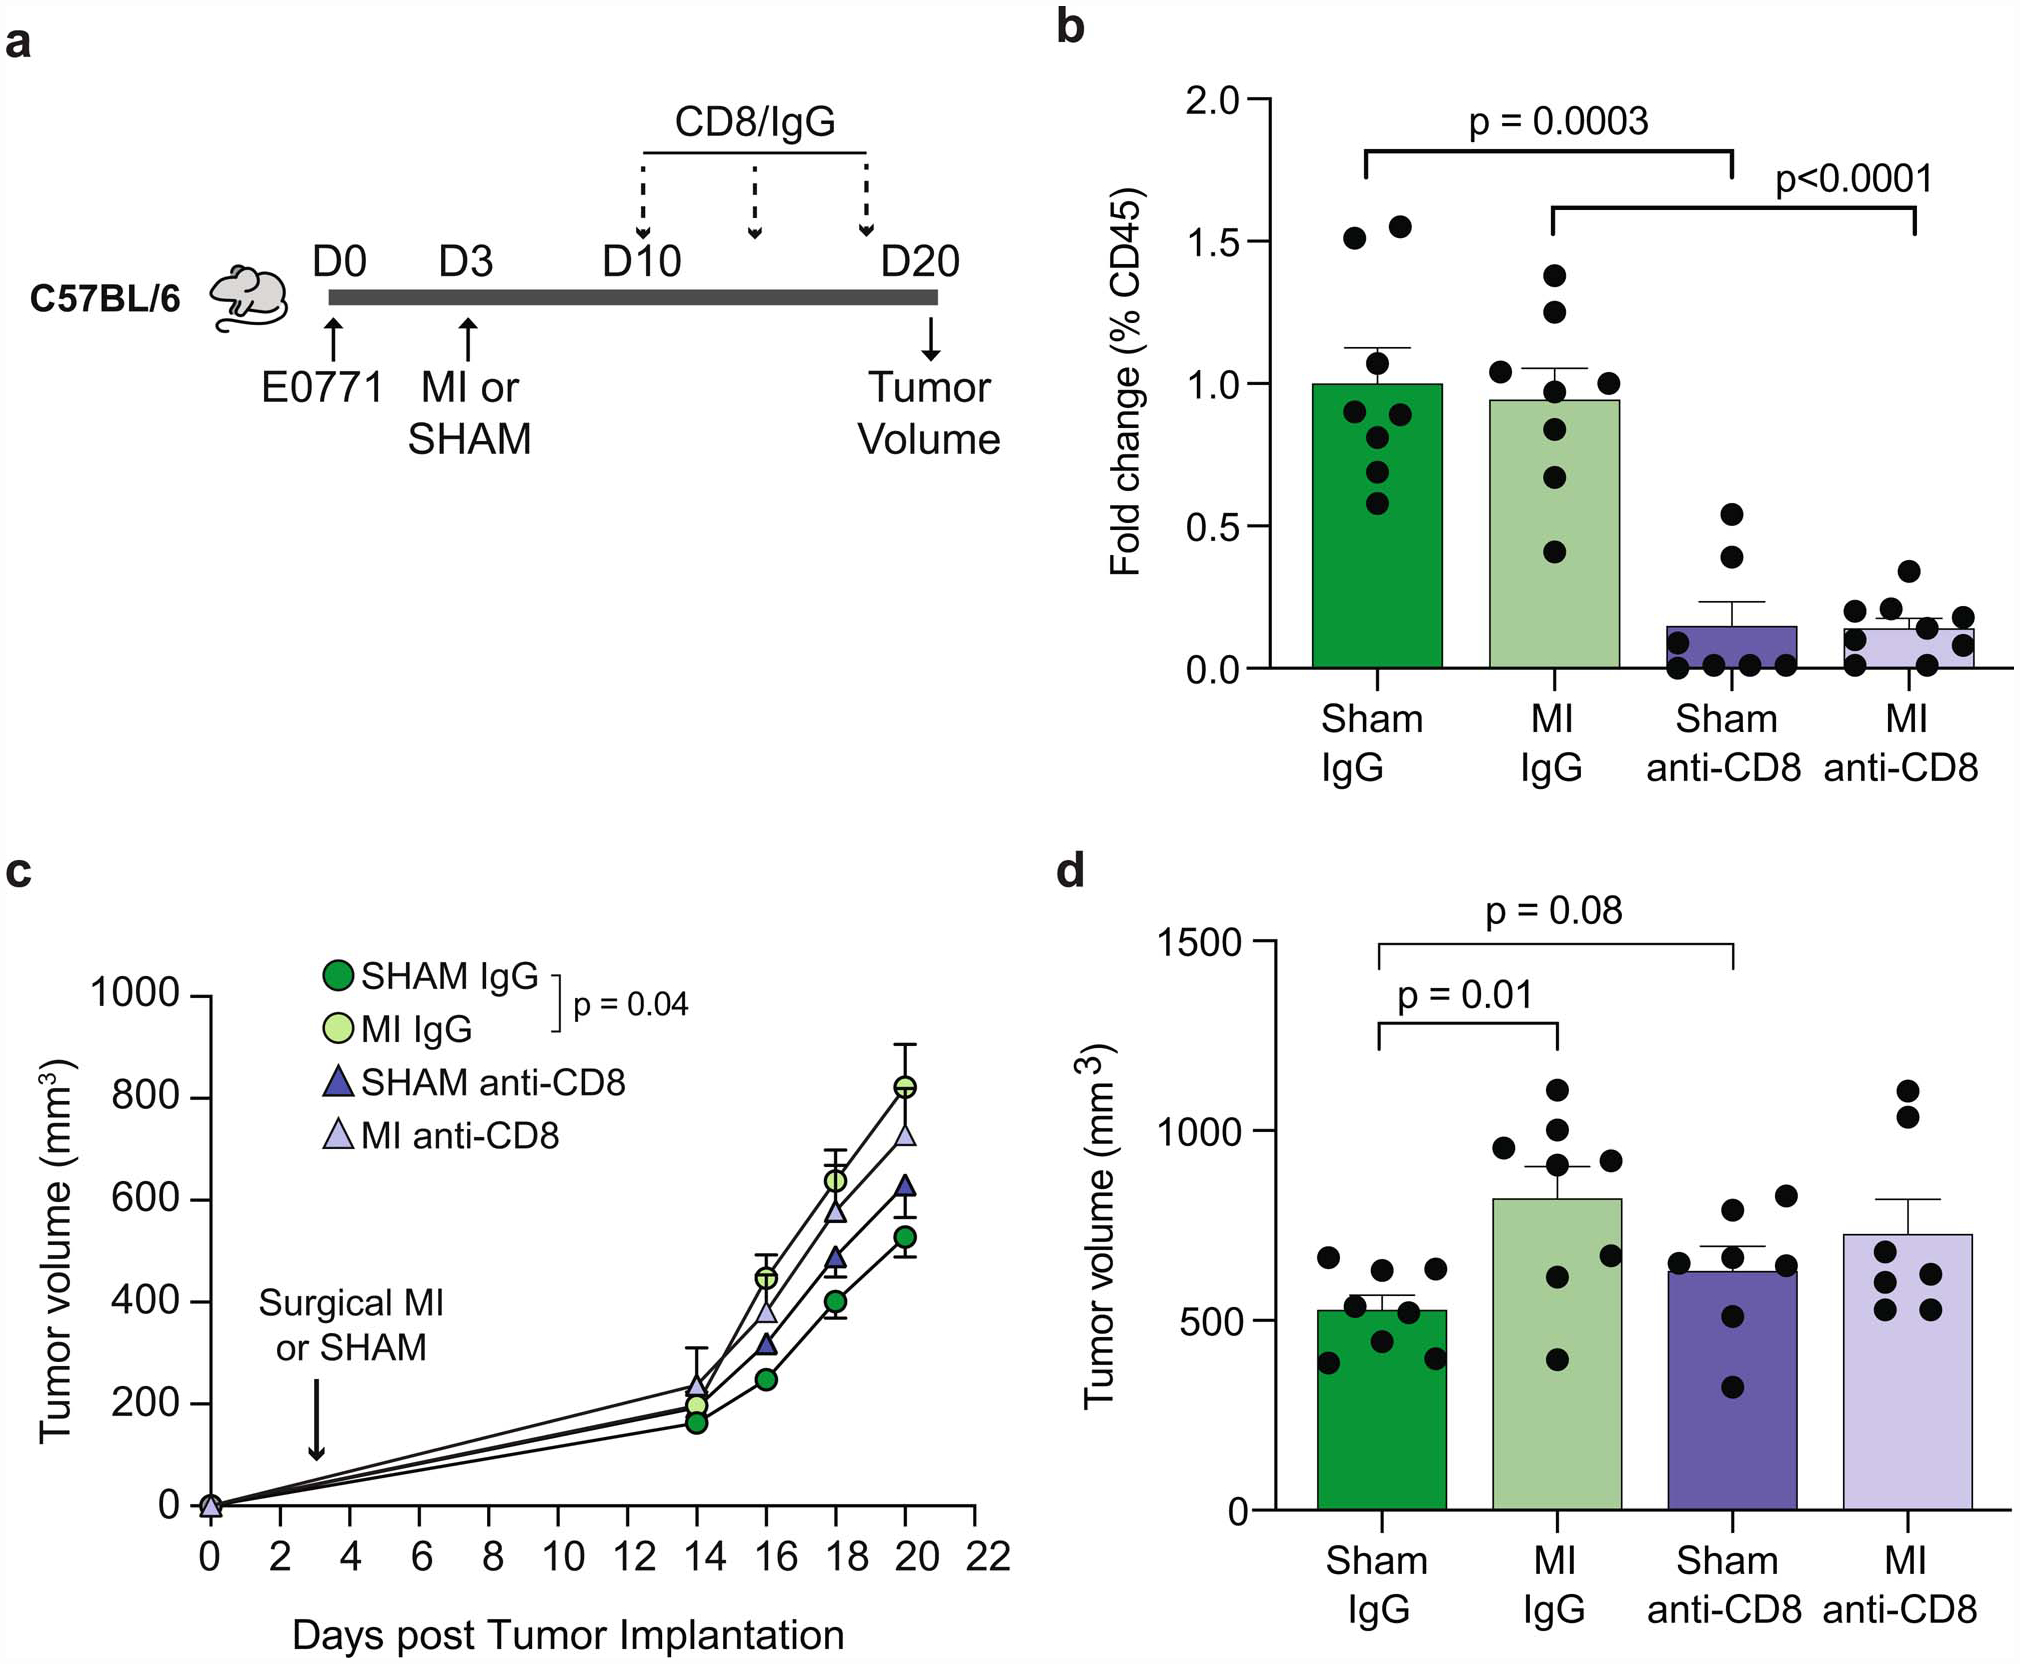
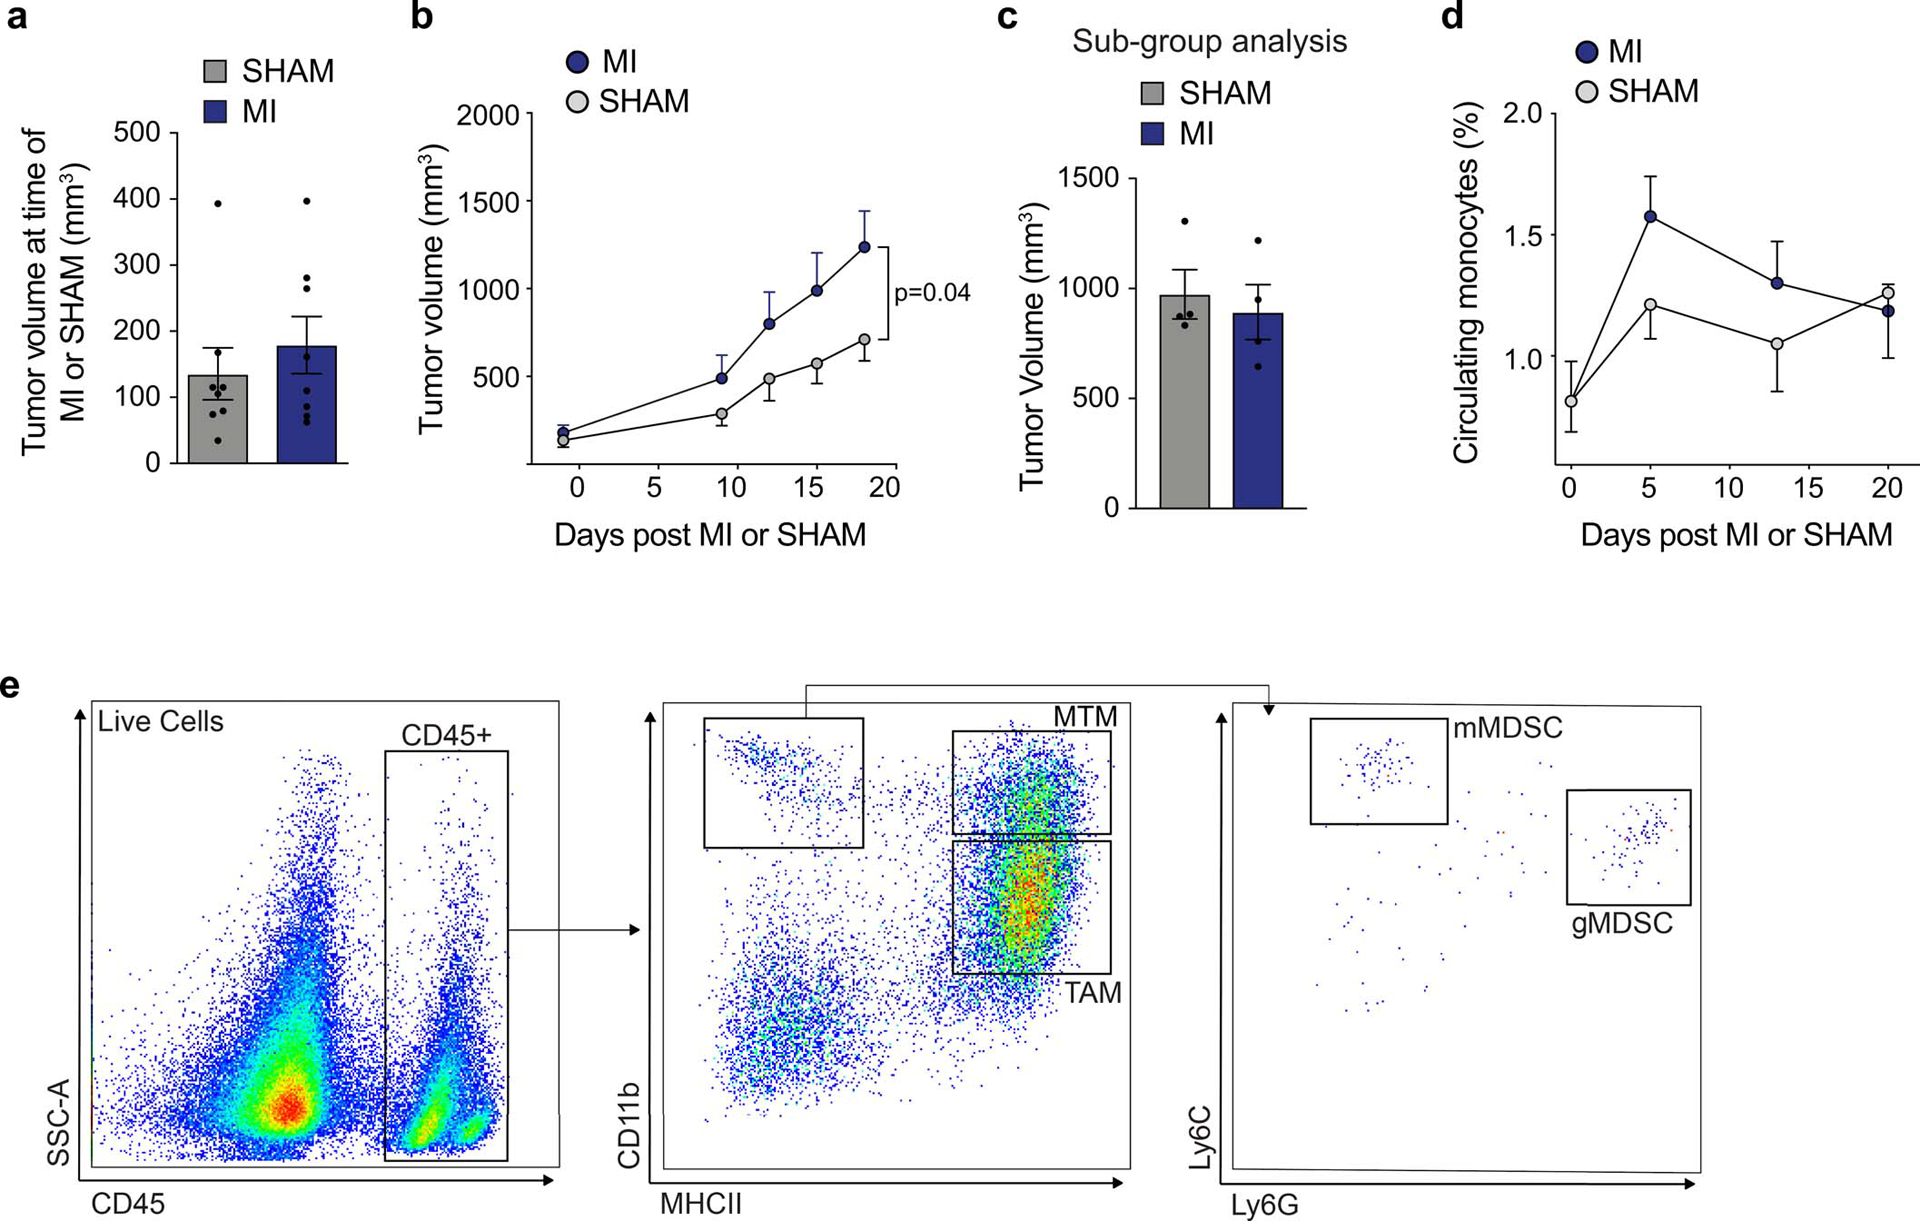
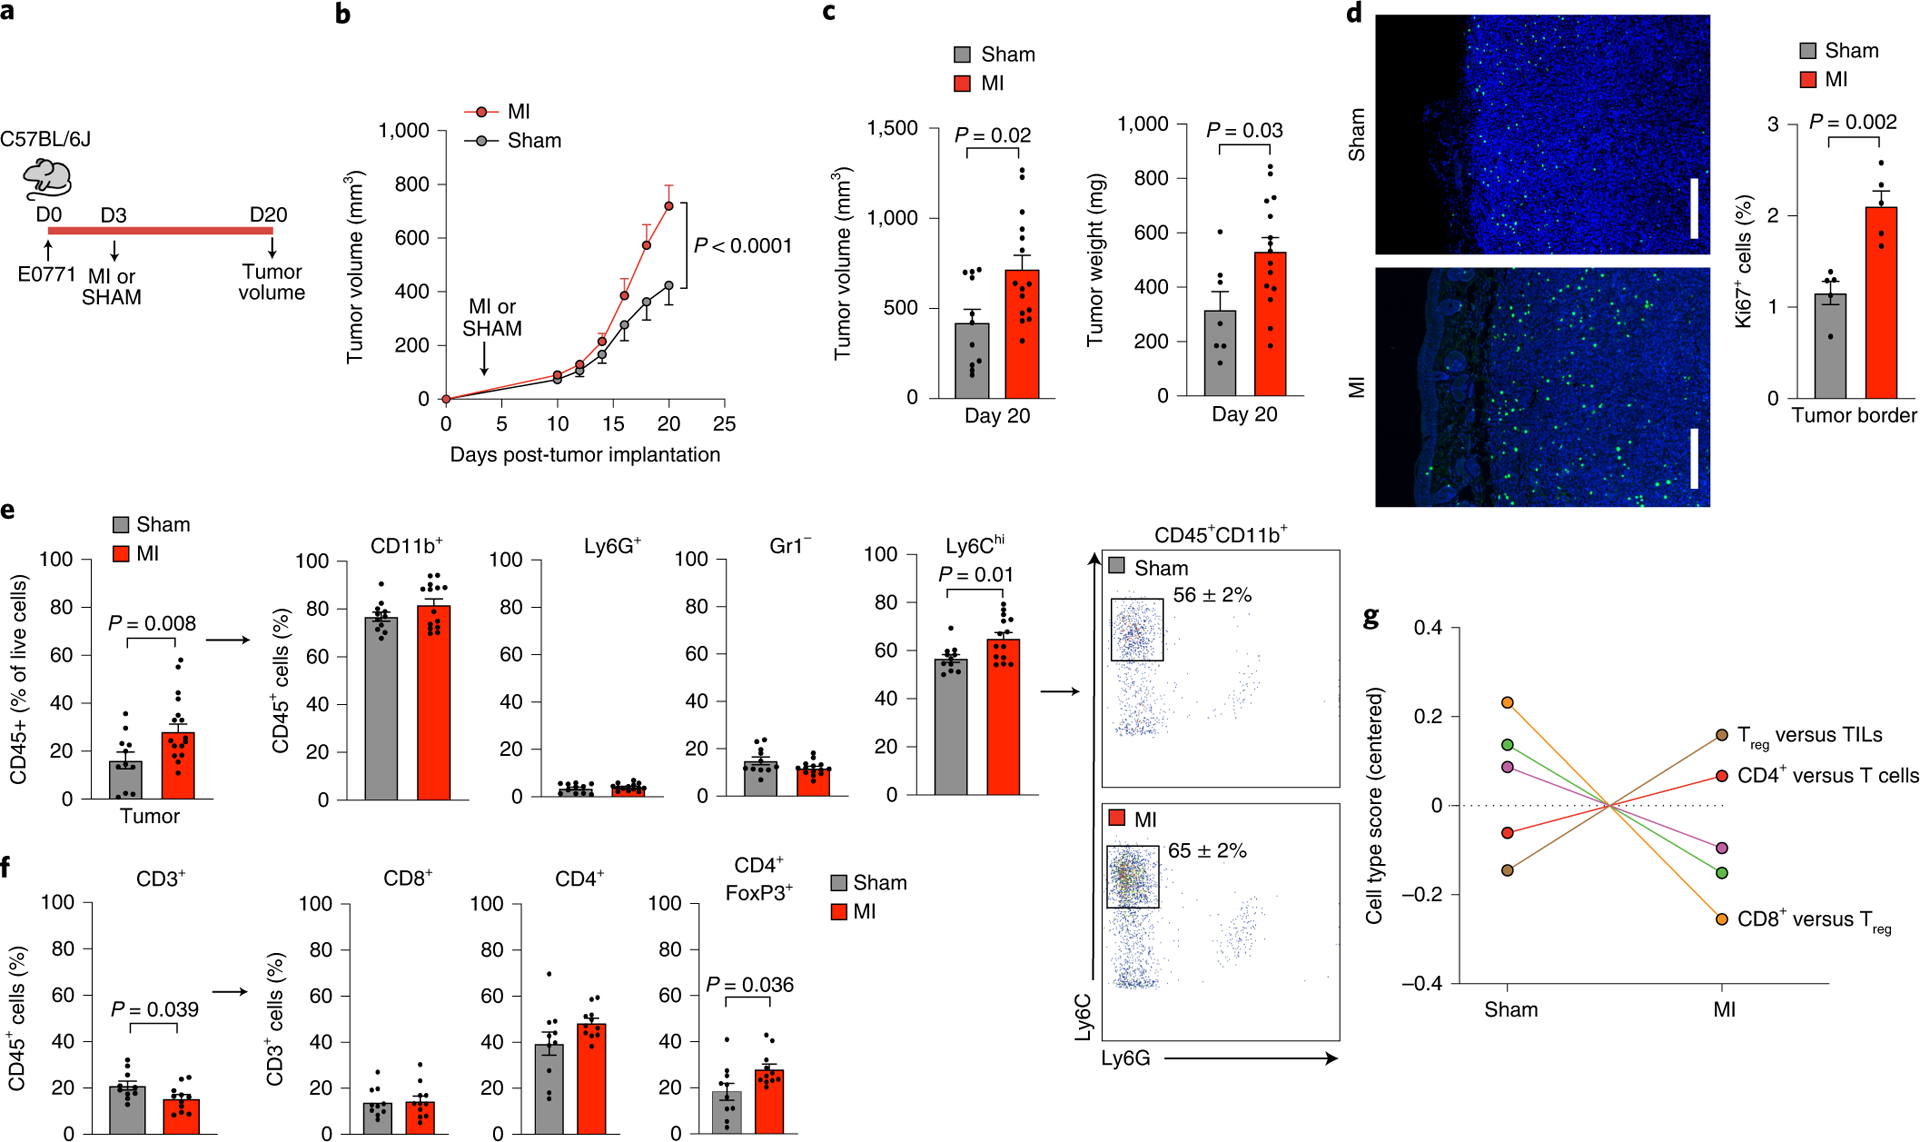
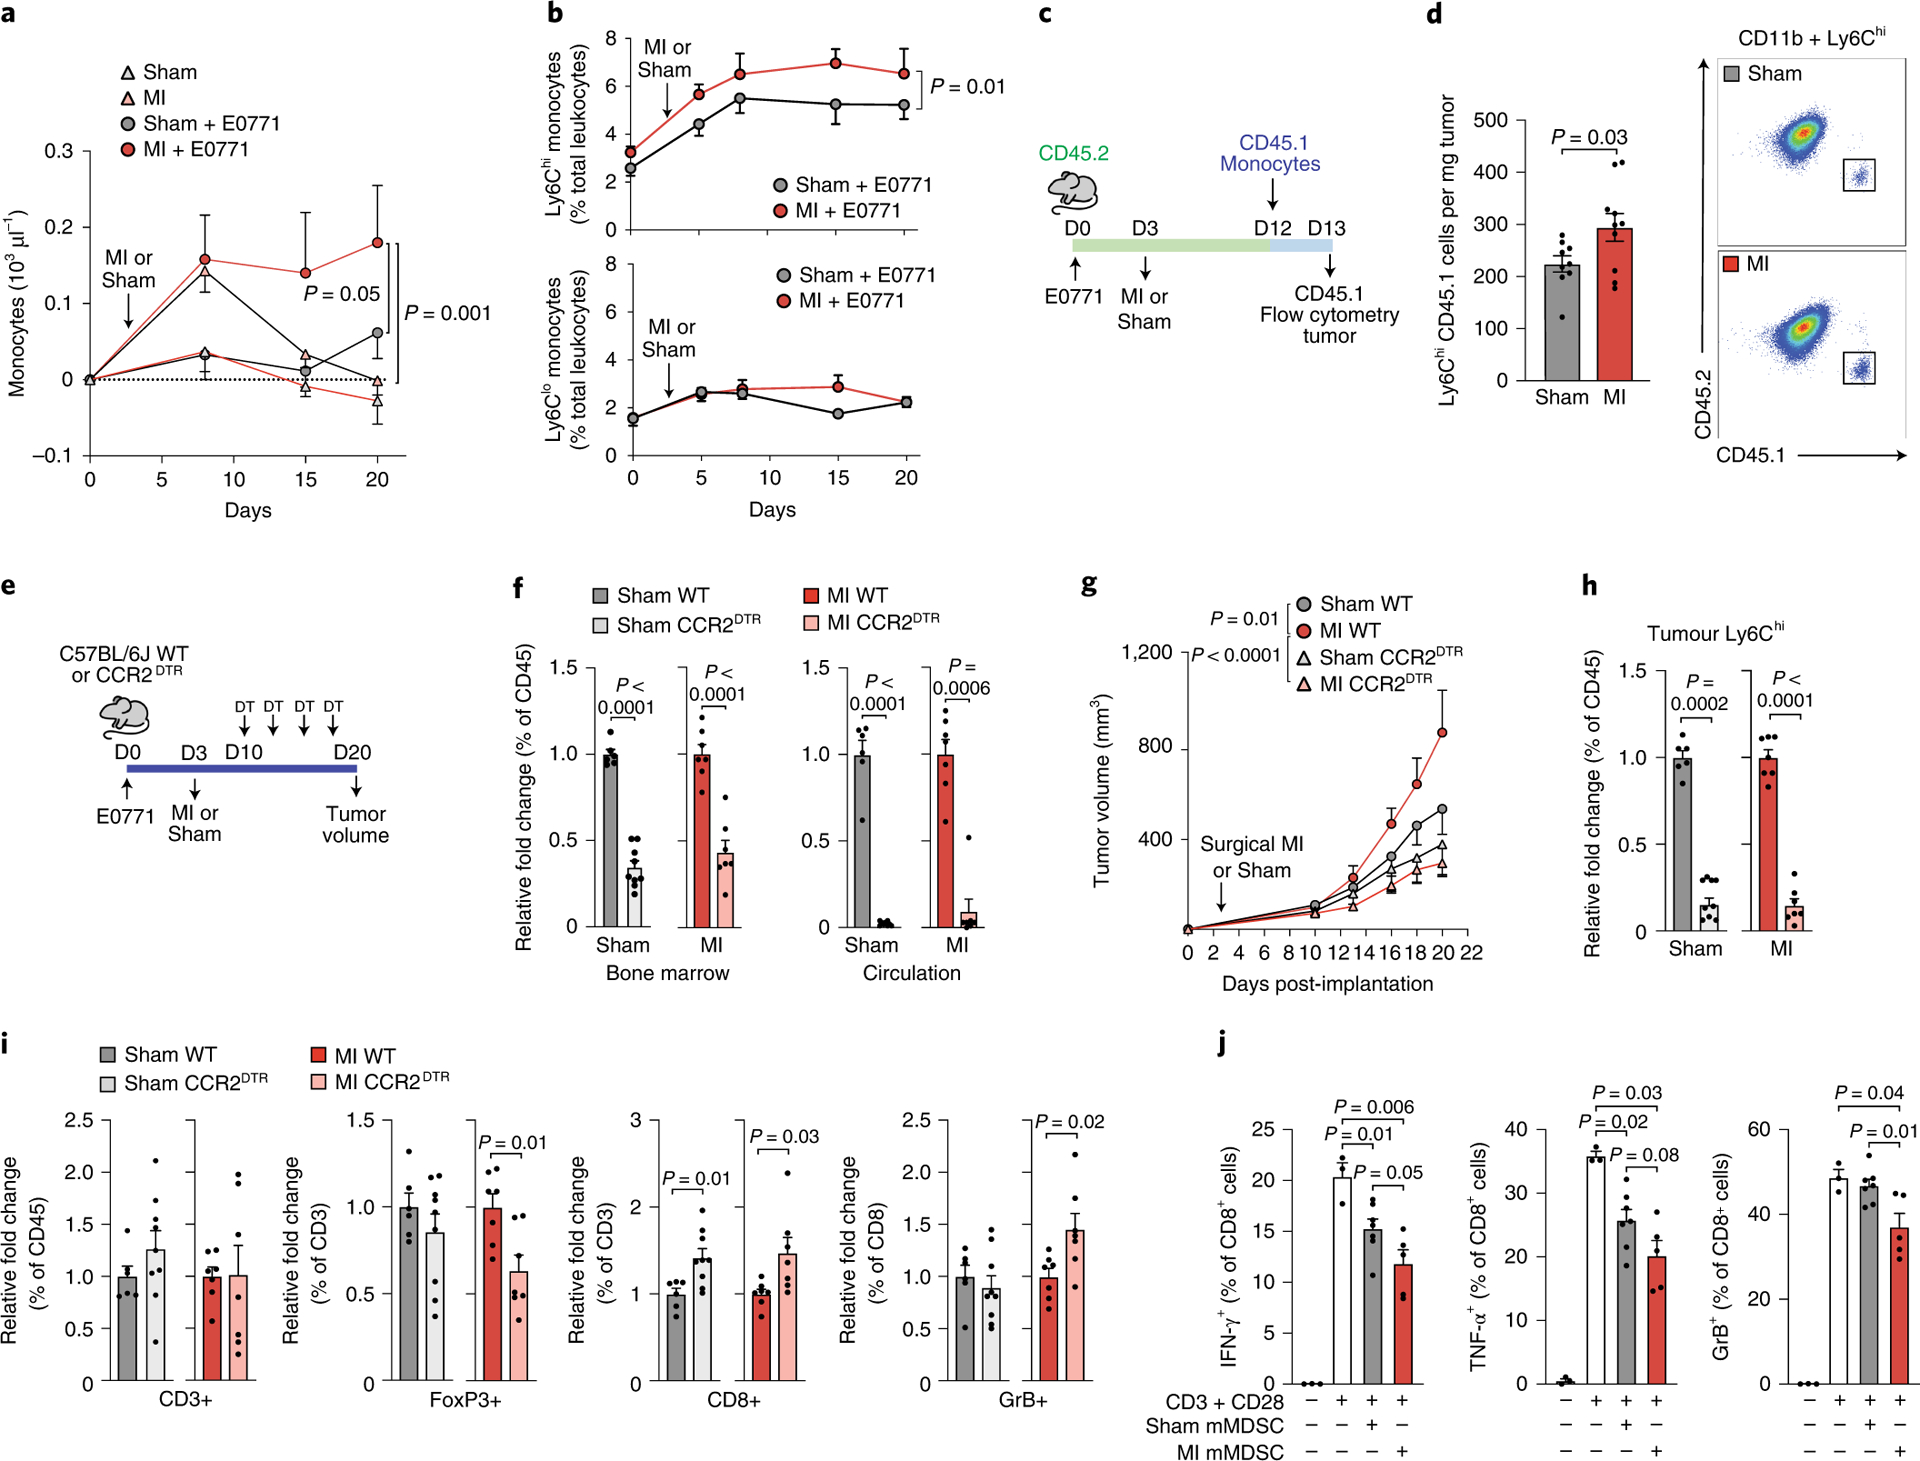
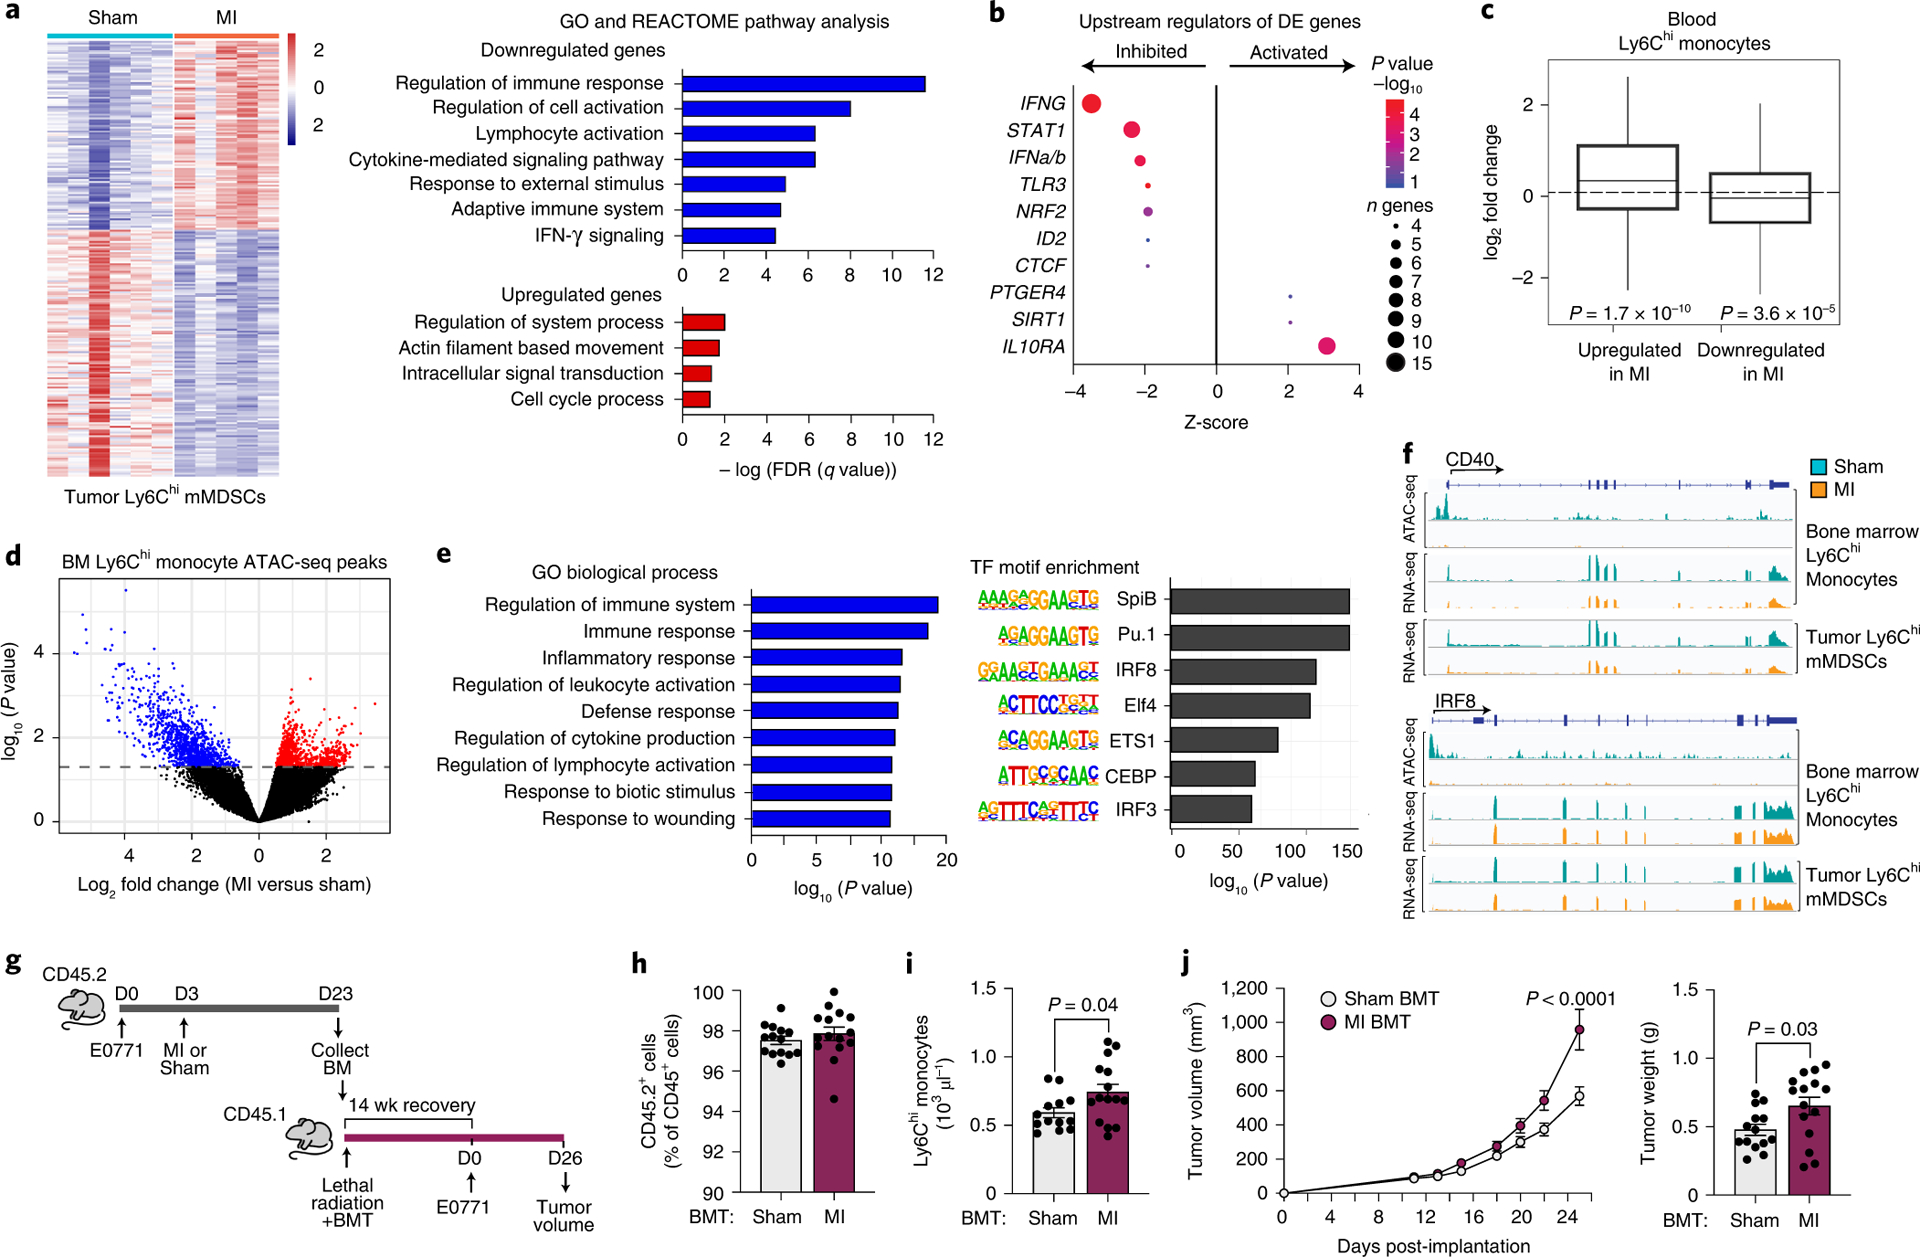
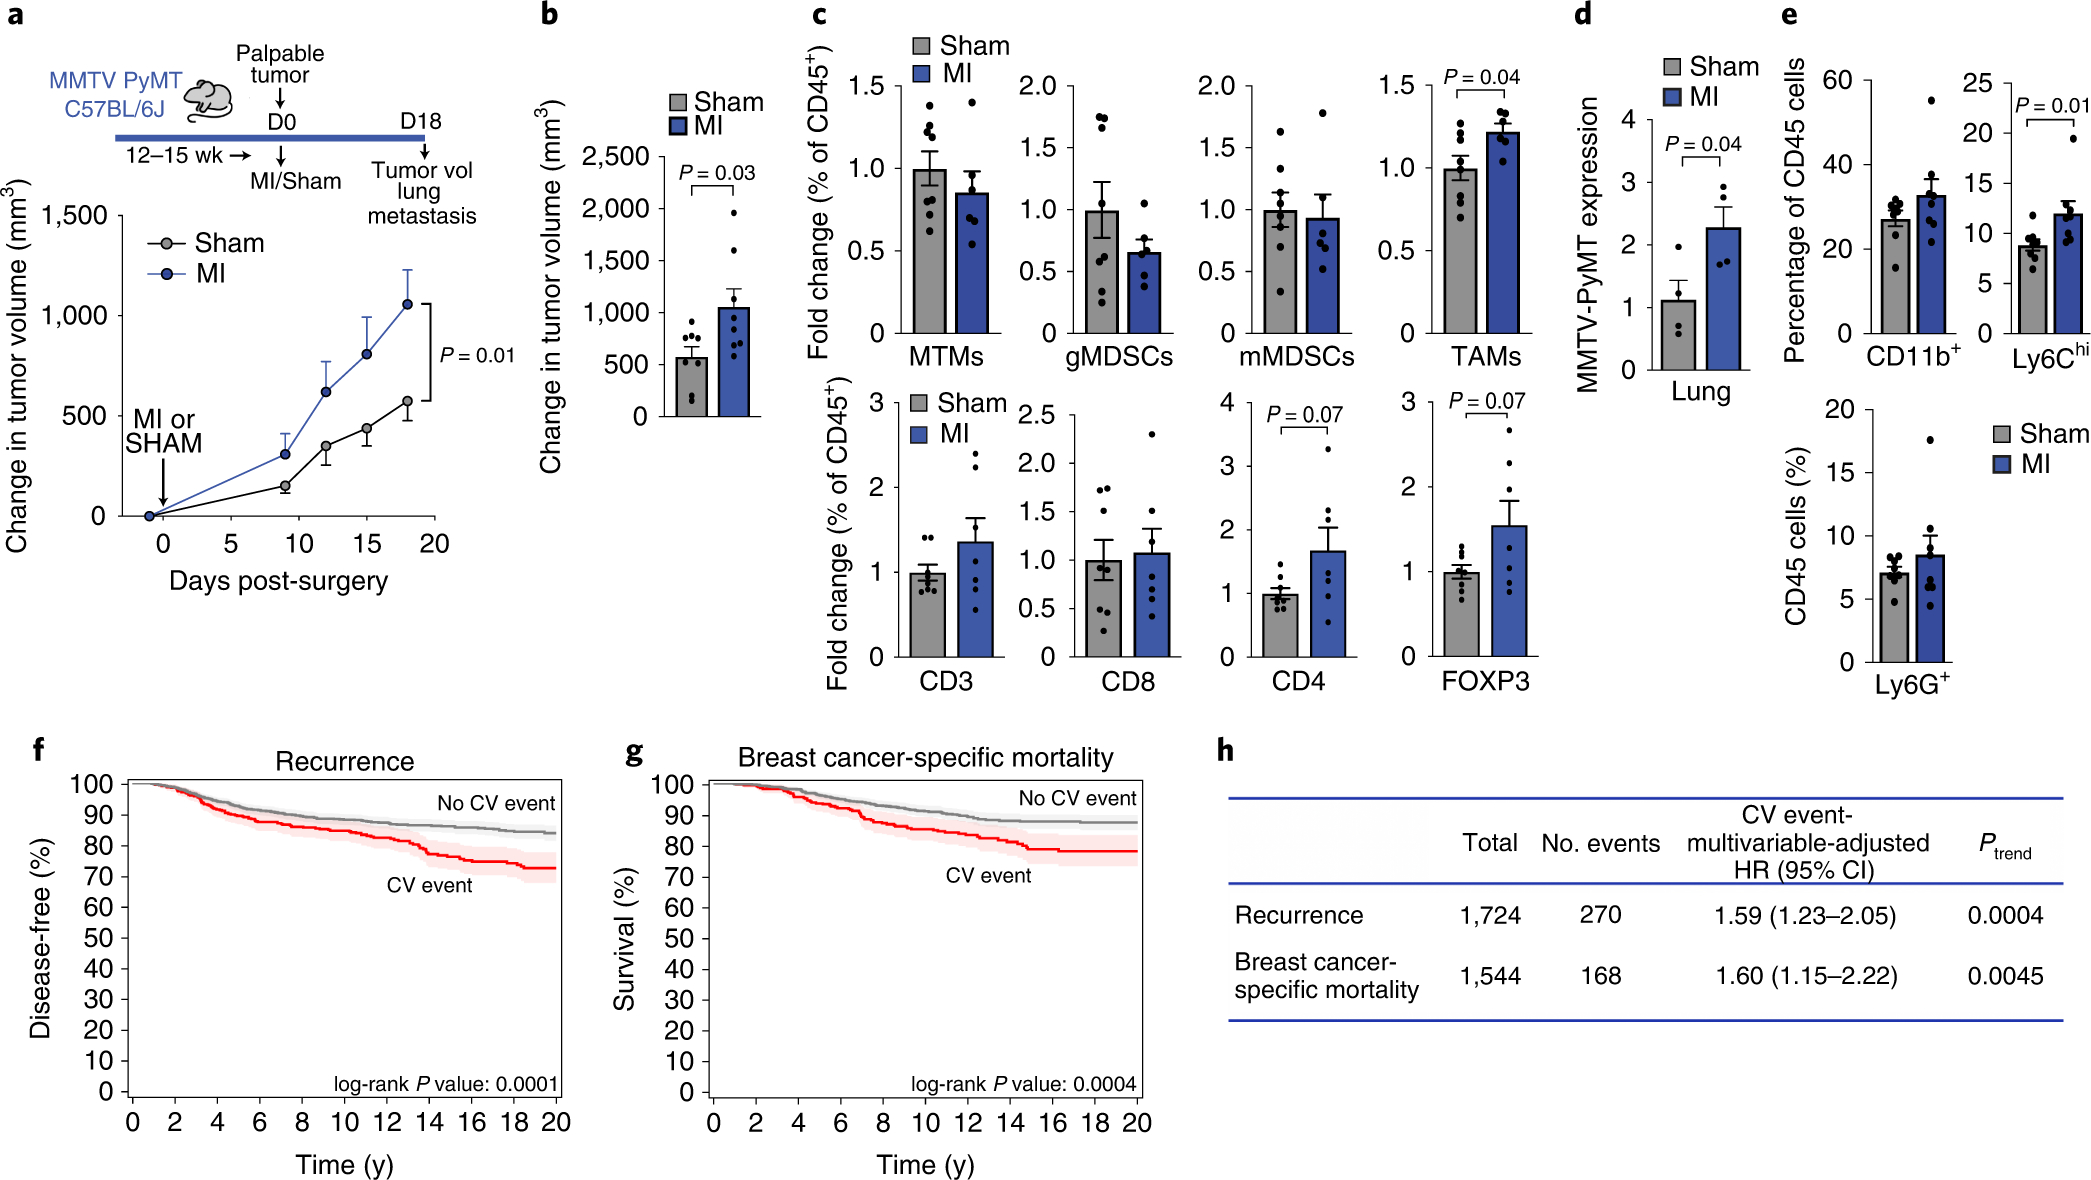
Disruption of systemic homeostasis by either chronic or acute stressors, such as obesity1 or surgery2, alters cancer pathogenesis. Patients with cancer, particularly those with breast cancer, can be at increased risk of cardiovascular disease due to treatment toxicity and changes in lifestyle behaviors3-5. While elevated risk and incidence of cardiovascular events in breast cancer is well established, whether such events impact cancer pathogenesis is not known. Here we show that myocardial infarction (MI) accelerates breast cancer outgrowth and cancer-specific mortality in mice and humans. In mouse models of breast cancer, MI epigenetically reprogrammed Ly6Chi monocytes in the bone marrow reservoir to an immunosuppressive phenotype that was maintained at the transcriptional level in monocytes in both the circulation and tumor. In parallel, MI increased circulating Ly6Chi monocyte levels and recruitment to tumors and depletion of these cells abrogated MI-induced tumor growth. Furthermore, patients with early-stage breast cancer who experienced cardiovascular events after cancer diagnosis had increased risk of recurrence and cancer-specific death. These preclinical and clinical results demonstrate that MI induces alterations in systemic homeostasis, triggering cross-disease communication that accelerates breast cancer.


Conflict of interest statement

Competing interests: Authors declare no competing interests.

Figures

Extended Data Fig. 1
Extended Data Fig. 1. Cardiac function is not altered by the presence of cancer following surgical MI.
(a) Representative triphenyl-tetrazolium chloride (TTC) staining to confirm surgical myocardial infarction through ligation of the left anterior descending coronary artery. (b) Echocardiography examination 16 days following MI or sham surgery (19 days post tumor implantation). Values are mean ± SD. BW Body weight, LV area d, left ventricular area at diastole; LV area s, left ventricular area at systole; EF, ejection fraction; LV volume d, left ventricular volume at diastole; LV volume s, left ventricular volume at systole; SV, stroke volume; FS, longitudinal fractional shortening; CI, cardiac index; LVAWd, left ventricular anterior wall thickness at diastole; LVPWd, left ventricular posterior wall thickness at diastole; LV mass cor, left ventricular mass corrected. P values in data determined as non-parametric were analyzed by a two-tailed Mann–Whitney test, while data determined to be parametric were analyzed by a two-tailed unpaired Student’s t-test; *P ≤ 0.05, **P ≤ 0.01, ***P ≤ 0.001 for sham (no tumor vs tumor) and MI (no tumor vs tumor) comparisons only.
Extended Data Fig. 2
Extended Data Fig. 2. Proliferation of immune (CD45+) and non-immune (CD45-) cells in tumors of mice following MI or sham surgery.
Quantification of Ki67 and CD45 co-staining of tumors to detect proliferating CD45- (a) and CD45+ (b) cells in the tumor border (n=5/group). Data are the mean ± s.e.m and P values determined using a two-tailed unpaired Student’s t-test.
Extended Data Fig. 3
Extended Data Fig. 3. Flow cytometric analysis of intratumoral immune cells following MI or sham surgery.
(a) Flow cytometry gating strategy for myeloid (top) and lymphoid (bottom) cells in E0771 tumors. (b) Flow cytometric analysis showing the relative fold change in immune cell proportions in tumors from mice exposed to MI (n=11, red) vs sham (n=10, grey) surgery (day 20); two independent experiments were conducted. All populations were gated based on live/dead stain and CD45+. (c) Flow cytometric analysis of CD11b+Gr1-Cd11c+ dendritic cell-like and CD11b+Gr1+F4/80+ macrophage-like cells in E0771 tumors from mice exposed to MI (n=5) or sham (n=4) surgery. (d) Flow cytometric analysis of tumor immune cells (% total live cells) at day 20 to identify CD3+ T cells (n=11 MI, 10 sham) and CD11b+ myeloid (n=14 MI, 11 sham) subsets: CD11b+Ly6G+, neutrophils; CD11b+Gr1, macrophage-like cells; CD11b+Ly6Chi, monocytes; Data are the mean ± s.e.m and P values in data were analyzed by a two-tailed Mann–Whitney test (b [FoxP3+ cells], or a two-tailed unpaired Student’s t-test (b,c,d).
Extended Data Fig. 4
Extended Data Fig. 4. Circulating leukocytes and bone marrow progenitors in tumor bearing mice following MI or sham surgery.
(a) Numbers of circulating leukocytes and relative proportion of neutrophils, eosinophils, lymphocytes and basophils in E0771 tumor bearing mice after MI (n=8) or sham (n=8) surgery. (b,c) Flow cytometric analysis of bone marrow hematopoietic and stem cell populations in E0771 tumor bearing mice 9 days post-MI or sham surgery (12 days post-tumor cell implantation). LSK: LineageSca1cKit+ cells; CMP: common myeloid progenitor; GMP: granulocytic myeloid progenitor; MEP: megakaryocyte–erythroid progenitor. (a-c) two independent experiments were conducted. Data are the mean ± s.e.m. P values were calculated using a two-way analysis of variance (ANOVA), with results not significant (p>0.05) (a), or a two-tailed unpaired Student’s t-test (c).
Extended Data Fig. 5
Extended Data Fig. 5. Monocyte adoptive transfer experiments into tumor bearing mice; RNA-seq analyses of tumor and bone marrow monocytes in mice exposed to MI or sham surgery.
(a-c) Monocytes were adoptively transferred from CD45.1 mice 9 days after exposure to MI or sham surgery into E0771 tumor bearing CD45.2 mice (a), and tumor weight (b), and CD45.1 Ly6Chigh monocytes recruited to the tumor (c) were determined 16 h later (n=9 sham; n=8 MI). (d-e) Monocytes were adoptively transferred from CD45.1 mice into E0771 tumor-bearing CD45.2 mice 9 days following MI or sham surgery (d), and tumor weight was determined 16 h later (n=9 sham; n=10 MI) (e). (f) Fold change (FC) in gene expression in E0771 tumors from mice 8 days post-MI compared to sham surgery (n=3 per group). (g) Heatmap of genes significantly up- or down-regulated (p<0.05, two-sided Wald test) in bone marrow monocytes 9–10 days after MI vs sham treatment specifically in tumor bearing mice. MI (n=6, 3 pools of 2 mice), sham (n=10, 5 pools of 2 mice), MI+tumor (n=5), or sham+tumor (n=6). (a-e) two independent experiments were conducted. Data are the mean ± S.D. and P values were analyzed by two-tailed unpaired Student’s t-test (b, c, e, f), with comparisons not significant unless indicated. *P ≤ 0.05, **P ≤ 0.01, ***P ≤ 0.001.
Extended Data Fig. 6
Extended Data Fig. 6. CCR2 inhibition mitigates MI-induced accelerated tumor growth.
(a) Outline of CCR2 inhibition study in mice implanted with E0771 tumor cells and exposed to MI or sham surgery. CCR2 inhibitor (CCR2i) was administered starting at 7 days after MI or sham surgery. (b) Tumor volume over the course of the study (left) and at sacrifice (day 20 day) (right) in mice exposed to MI (n=5 CCR2 inhibitor, n=7 DMSO control) or sham surgery (n=8 CCR2 inhibitor, n=7 DMSO control). Two independent experiments were conducted (a-c). P values were calculated using a repeated measures analysis of variance (ANOVA) with Bonferroni’s multiple comparisons test (b) or one way ANOVA (c).
Extended Data Fig. 7
Extended Data Fig. 7. Monocytic myeloid-derived suppressor cells isolated from tumors of mice exposed to MI or sham surgery do not alter the proliferation of T cells in vitro.
(a) Representative flow plots of CD11b-Ly6C-CD8+ T cells from MDSC:T cell suppression assay, representing % IFNγ +, TNFα+, Granzyme B (GrB)+ populations. (b,c) Purified splenic CD8+ T cells from naïve mice were stimulated with αCD3/αCD28 for 72 hours in the presence of mMDSCs isolated from tumors from mice exposed to MI (n=5) or sham surgery (n=7), and CD8+ T cell proliferation was assessed by % Ki67 (b) and replication and division index (c) using a cell trace proliferation dye. (a,b,c) two independent experiments were conducted. Data are the mean ± s.e.m. P values were calculated using or two-tailed unpaired Student’s t-test (b,c), where relevant comparisons were not significant (p>0.05)
Extended Data Fig. 8
Extended Data Fig. 8. The effect of systemic CD8+ cell depletion on tumor growth in mice following MI or sham surgery.
(a) E0771 tumor-bearing mice were exposed to MI or sham surgery and randomly allocated to either intraperitoneal IgG or anti-CD8 injections 10, 15, and 19 days following tumor implantation. (b) Intratumoral T cell content measured by flow cytometry in sham+IgG (n=8), sham+anti-CD8 (n=7), MI+IgG (n=8) and MI+anti-CD8 (n=7).(c) tumor volume was followed over 20 days and at sacrifice (d) in sham+IgG (n=8), sham+anti-CD8 (n=7), MI+IgG (n=8) and MI+anti-CD8 (n=7). (a-d) two independent experiments were conducted Data are the mean ± s.e.m. P values were calculated using a repeated measures analysis of variance (ANOVA) with Bonferroni’s multiple comparisons test (c), or a two-tailed (b) or one-tailed (d) Mann–Whitney test.
Extended Data Fig. 9
Extended Data Fig. 9. RNA-seq and ATAC-seq analyses of mMDSCs in tumor and bone marrow of mice exposed to MI or sham surgery.
(a) Heat map showing differential gene expression (log2FC) of select immune-related genes from RNA-Seq of tumoral CD11b+Ly6Chigh mMDSCs from mice 17 days post-MI (n=5) or sham (n=6) surgery (Padj<0.1). (b) Gene set concordance analysis showing that the top 1000 differentially expressed genes up- and down-regulated in tumor CD11b+Ly6Chigh mMDSCs (x axis) are enriched in genes up- and down-regulated in bone marrow Ly6Chigh monocytes (y axis) from the same mice 17 days post-MI, compared to background gene expression. (c) Gene ontology (GO) analyses of more accessible chromatin regions (n=942) in bone marrow Ly6Chigh monocytes from mice exposed to MI vs. sham surgery. (d) List of genes differentially expressed in tumor Ly6Chigh monocytes whose chromatin loci that are also less accessible in bone marrow Ly6Chigh monocytes after MI compared to sham surgery, grouped by transcription factors identified in Figure 3e. (e) ATAC-Seq (top) and RNA-Seq (bottom) reads in bone marrow and tumor Ly6Chigh monocytes at selected gene loci. P(adj) values were calculated using the Benjamini-Hochberg method (a). P values determined by two-sided Student’s T-test (b) or hypergeometric distribution (c).
Extended Data Fig. 10
Extended Data Fig. 10. Tumor growth, circulating monocytes and intratumoral innate immune flow cytometry gating strategy in MMTV-PyMT mice following surgical MI or sham surgery.
(a) Mean tumor volume at time of MI (n=8) or sham surgery (n=8) in MMTV-PyMT mice. (b) Tumor growth in MMTV-PyMT mice after MI or sham surgery (n=8/group). (c) Tumor volume at sacrifice in MMTV-PyMT mice used for the metastasis subgroup analysis (n=4/group). (d) Circulating monocytes in MMTV mice exposed to MI or sham surgery (n=8/group). (e) Flow cytometry gating strategy for myeloid cells from MMTV-PyMT tumors. Mammary-tissue macrophages (MTM: CD11bhighMHCII+); granulocytic myeloid derived suppressor cell (gMDSC: CD11bhighMHCIILy6CloLy6Ghigh); monocytic myeloid derived suppressor cell (mMDSC: CD11bhighMHCIILy6ChghiLy6Glo); tumor-associated macrophage (TAM: CD11bloMHCIIhigh). (a-e) three independent experiments were conducted. Data are the mean ± s.e.m and P values were calculated using a repeated measures analysis of variance (ANOVA) (d) with Bonferroni’s multiple comparisons test (b) or by a two-tailed unpaired Student’s t-test (a, c).
Figure 1.
Figure 1.. Surgically-induced myocardial infarction accelerates tumor growth in a syngeneic mouse model of breast cancer.
(a) Coronary artery ligation or sham surgery was performed 3 days following orthotopic implantation of E0771 cancer cells into the mammary fat pad of C57BL/6J mice and tumor growth was followed over the course of 20 days. (b) Tumor growth over 20 days following tumor implantation (n=15 MI, 11 sham) (c) Quantification of tumor volume (n=15 MI, 11 sham) and weight (n=15 MI, 7 sham) at sacrifice. (d) Representative images of tumors stained for Ki67 to detect proliferating cells in the tumor border (left) and quantification of Ki67+ cells (right) (n=5/group). Scale bar represents 250 μm. (e) Left, flow cytometric analysis of tumor immune cells (CD45+) at day 20 to identify myeloid subsets (n=14 MI, 11 sham): CD11b+Ly6G+, neutrophils; CD11b+Gr1, macrophage-like cells; CD11b+Ly6Chi, monocytes. Right, representative gating showing increased percentage of CD45+CD11b+Ly6GLy6Chi monocytes in MI compared to sham mice. (f) Flow cytometric analysis of tumor immune cells (CD45+) at day 20 to identify lymphoid subsets (n=11 MI, 10 sham): CD3+, T cells; CD8+, cytotoxic T cells; CD4+, T helper cells; CD4+FoxP3+, regulatory T cells. (g) Nanostring immune profiling gene set analysis of tumor RNA from MI (n=11) or sham (n=10) mice. TILs, tumor infiltrating lymphocytes. Two (f,g), three (d,e) and five (b,c) independent experiments were conducted. Data are the mean ± s.e.m. P values were calculated using a repeated measures analysis of variance (ANOVA) with Bonferroni’s multiple comparisons test (b) or two-tailed unpaired Student’s t-test (c [tumor volume], d, e [Ly6C, Gr1, CD3, CD8, CD4]) or two-tailed Mann–Whitney U-test (c [tumor weight], e [CD11b, Ly6G, FoxP3]).
Figure 2.
Figure 2.. MI-accelerated tumor growth is dependent on enhanced Ly6Chigh monocyte supply and recruitment to tumors.
(a) Circulating monocytes in mice exposed to MI (n=5), sham surgery (n=9), MI+E0771 tumor (n=5) or sham surgery + E0771 tumor (n=7). (b) Circulating CD11b+Ly6Chigh (top) and CD11b+Ly6Clow (bottom) monocytes in E0771 tumor-bearing mice exposed to MI or sham surgery (n=8). (c) Outline of the monocyte tracking study using congenic CD45.1 and CD45.2 mice. (d) Left, quantification of CD45.1 Ly6Chigh monocytes in tumors 16 h after monocyte transplantation into CD45.2 recipient mice that underwent MI (n=10) or sham (n=9) surgery 9 days earlier. Right, representative FACS plots illustrating gating of CD45+CD11b+Ly6Chigh cells on CD45.2 and CD45.1. (e) Outline of monocyte depletion study in CCR2-diphtheria toxin receptor (DTR) and wild type (WT) mice implanted with E0771 tumor cells and exposed to MI or sham surgery. (f) Ly6Chigh monocytes in the bone marrow (left) and circulation (right) after DT injection in WT and CCR2DTR mice exposed to MI (n=7 WT, n=7 CCR2DTR) or sham (n=6 WT; n=9 CCR2DTR) surgery. (g-i) Quantification of tumor growth (g), tumoral Ly6Chigh monocytes (h), and T cell populations (FoxP3+ regulatory T cells, CD8+ cytotoxic T cells, Granzyme B+ activated CD8+ T cells) (i) in DT-treated WT and CCR2DTR mice exposed to MI (n=7 WT, n=7 CCR2DTR) or sham surgery (n=6 WT; n=9 CCR2DTR). (j) Suppressive effects of tumor monocytic myeloid derived suppressor cells (mMDSCs) isolated from mice exposed to MI (n=5) or sham surgery (n=7), as assessed by proportion of IFNγ+, TNFα+, and Granzyme B (GrB)+ CD8+ T cells after co-culture with mMDSCs in vitro. Two (a, b, d, f-i) and three (h) independent experiments were conducted. Data are the mean ± s.e.m. P values were calculated using a repeated measures analysis of variance (ANOVA) (b) with Bonferroni’s multiple comparisons test (a, g), a two-tailed Mann–Whitney U-test (f [MI circulation], j [TNFα+: SHAM mMDSC and MI mMDSC vs CD3+CD28]) or a two-tailed unpaired Student’s t-test (d, f [bone marrow, sham circulation], h, i, j [IFNγ+, GrB+, TNFα+ [SHAM mMDSC vs MI mMDSC])
Figure 3.
Figure 3.. Tumoral Ly6Chigh monocytic myeloid derived suppressor cells (mMDSCs) exhibit an MI-induced immunosuppressive transcriptional phenotype that is epigenetically imprinted in the bone marrow.
(a) Left, heat map showing RNA-Seq gene expression changes (n=235 genes) in tumoral CD11b+Ly6Chigh mMDSCs from mice 17 days post-MI (n=5) or sham (n=6) surgery (Padj<0.1). Right, functional enrichment analyses of differentially-expressed genes in tumoral mMDSCs from MI and sham mice. (b) Upstream regulator analyses of genes from a. n, number of differentially expressed (DE) genes regulated per factor, with color denoting p value (-log10). (c) Gene set concordance analysis, which shows that the 1000 top DE genes up- and down-regulated in tumor CD11b+Ly6Chigh mMDSCs (n=5 MI, n=6 sham) are up- and down-regulated in blood Ly6Chigh monocytes at 9 days after MI, as compared to background gene expression. Box: interquartile range (IQR); line: median; whiskers: most extreme value within 1.5x the IQR. (d) Volcano plot showing chromatin loci identified by ATAC-Seq to be more (red, n=942 peaks) or less (blue, 1101 peaks) accessible in bone marrow Ly6Chigh monocytes from mice exposed to MI (n=4, 2 pools of two mice) as compared to sham surgery (n=8, 4 pools of two mice) (P<0.05). (e) Gene ontology (GO) (left) and transcription factor binding motif enrichment (right) analyses of less accessible chromatin regions (n=1101 peaks) in bone marrow Ly6Chigh monocytes from mice exposed to MI as compared to sham surgery. (f) ATAC-Seq (top) and RNA-Seq (bottom) reads in bone marrow and tumor Ly6Chigh monocytes at selected gene loci. (g) Bone marrow (CD45.2+) was isolated from mice 20 days after tumor implantation and 17 days after MI (n=5) or sham (n=5) surgery and was pooled in PBS and transplanted into lethally irradiated C57BL/6J mice (CD45.1+) mice. 14 weeks after transplantation, E0771 tumors were implanted and tumor volume was assessed over the course of 26 days. BMT, bone marrow transplantation. (h,i) CD45.2/CD45.1 chimerism (sham, n=14 and MI, n=15) (h) and circulating monocyte levels (sham, n=13 and MI, n=15) (i) in BMT recipients at 14 weeks after transplantation. (j) E0771 tumor volume over 26 days (left) and tumor weight at day 26 (right) (sham, n=14 and MI, n=15). Data are the mean ± s.e.m. P(adj) values were calculated using the Benjamini-Hochberg method (a, left). FDR values were based on a permutation test (a, right). P values were calculated using a one-sided Fishers Exact test (b), two-sided Wilcoxon Rank-Sum Test (c), two-sided Wald test (d), hypergeometric distribution (left) and binomial distribution (right) (e), two-tailed unpaired Student’s t-test (h, i, j [right]), or a repeated measures analysis of variance (ANOVA) with Bonferroni’s multiple comparisons test or (j [left]).
Figure 4.
Figure 4.. Myocardial infarction accelerates cancer progression in mice, and incident cardiovascular events increase the risk of recurrence and cancer-specific mortality in early-stage breast cancer patients.
(a) Top, coronary artery ligation or sham surgery was performed upon palpable tumor formation in MMTV-PyMT mice and cumulative tumor burden was followed over the course of 18 days, at which time tumor volume and metastatic burden were assessed. Bottom, quantification of tumor growth in the MMTV-PyMT genetically engineered mouse model of spontaneous breast cancer after MI or sham surgery (n=8/group). (b) Mean change in tumor volume at day 18 as compared to day 0 after MI or sham surgery (n=8/group). (c) Flow cytometric analysis of tumor myeloid cells (top: n=6 MI, 8 sham) and lymphoid cells (bottom: (n=7 MI, 8 sham) at day 18 after MI or sham surgery. Mammary tissue macrophages (MTM: CD11bhighMHCII+); granulocytic myeloid derived suppressor cell (gMDSC: CD11bhighMHCIILy6CloLy6Ghi); monocytic myeloid derived suppressor cell (mMDSC: CD11bhighMHCIILy6ChiLy6Glo); tumor-associated macrophage (TAM: CD11bloMHCIIhi); CD3+, T cells; CD8+, cytotoxic T cells; CD4+, T helper cells; CD4+FoxP3+, regulatory T cells. (d) Analysis of mammary-specific Pymt mRNA levels in the lungs of MI and sham mice with similar sized tumors at sacrifice (n=4/group). (e) Flow cytometric analysis of myeloid cells in the lungs of MMTV-PyMT mice (n=8/group) at day 18 after MI or sham surgery; CD11b+Gr1, macrophages; CD11b+Ly6G+, neutrophils; CD11b+Ly6Chi, monocytes. (f-g) Kaplan Meier curves for cancer recurrence (f) and breast cancer-related mortality (g) in patients with early-stage breast cancer (n=1,724) who experienced a post-diagnosis cardiovascular (CV) event. (h) Multivariable-adjusted hazard ratios adjusted for age, race, smoking status, body mass index at diagnosis date, tumor stage and adjuvant therapy (chemotherapy, radiation, endocrine therapy), utilizing traditional Cox proportional hazards regression models. All patient statistical tests were two sided. Three independent experiments (b-e) were conducted. Data are the mean ± s.e.m and P values were calculated using a repeated measures analysis of variance (ANOVA) with Bonferroni’s multiple comparisons test (a), a two-tailed Mann–Whitney U-test (e), or two-tailed unpaired Student’s t-test (b, c, d).

Comment in

Similar articles

Cited by

References

    1. Quail DF & Dannenberg AJ The obese adipose tissue microenvironment in cancer development and progression. Nat Rev Endocrinol 15, 139–154 (2019). - PMC - PubMed
    1. Krall JA, et al. The systemic response to surgery triggers the outgrowth of distant immune-controlled tumors in mouse models of dormancy. Sci Transl Med 10(2018). - PMC - PubMed
    1. Hershman DL, et al. Association of Cardiovascular Risk Factors With Cardiac Events and Survival Outcomes Among Patients With Breast Cancer Enrolled in SWOG Clinical Trials. J Clin Oncol 36, 2710–2717 (2018). - PMC - PubMed
    1. Jones LW, Haykowsky MJ, Swartz JJ, Douglas PS & Mackey JR Early breast cancer therapy and cardiovascular injury. J Am Coll Cardiol 50, 1435–1441 (2007). - PubMed
    1. Hooning MJ, et al. Long-term risk of cardiovascular disease in 10-year survivors of breast cancer. J Natl Cancer Inst 99, 365–375 (2007). - PubMed

Publication types