. 2020 Sep;23(9):1102-1110.
doi: 10.1038/s41593-020-0665-z. Epub 2020 Jul 13.

Regulation of autism-relevant behaviors by cerebellar-prefrontal cortical circuits

Affiliations

Regulation of autism-relevant behaviors by cerebellar-prefrontal cortical circuits

Elyza Kelly et al. Nat Neurosci. 2020 Sep.

Abstract

Cerebellar dysfunction has been demonstrated in autism spectrum disorders (ASDs); however, the circuits underlying cerebellar contributions to ASD-relevant behaviors remain unknown. In this study, we demonstrated functional connectivity between the cerebellum and the medial prefrontal cortex (mPFC) in mice; showed that the mPFC mediates cerebellum-regulated social and repetitive/inflexible behaviors; and showed disruptions in connectivity between these regions in multiple mouse models of ASD-linked genes and in individuals with ASD. We delineated a circuit from cerebellar cortical areas Right crus 1 (Rcrus1) and posterior vermis through the cerebellar nuclei and ventromedial thalamus and culminating in the mPFC. Modulation of this circuit induced social deficits and repetitive behaviors, whereas activation of Purkinje cells (PCs) in Rcrus1 and posterior vermis improved social preference impairments and repetitive/inflexible behaviors, respectively, in male PC-Tsc1 mutant mice. These data raise the possibility that these circuits might provide neuromodulatory targets for the treatment of ASD.


Conflict of interest statement

Ethics declarations

The authors declare no competing interests.

Figures

Extended Data Fig. 1
Extended Data Fig. 1. mPFC Gi DREADDs in PC-Tsc1 mutant mice.
a, Sample of injection site locations from PC-Tsc1 mutants injected with Gi (inhibitory) DREADDs/GFP into left prelimbic (PRL) medial prefrontal cortex (mPFC). b, Awake in vivo single unit recordings in the left PRL of control or PC-Tsc1 mutant mice. c, Three chambered social approach assay; time spent sniffing novel animal (NA), or novel object (NO). d, Three chambered social novelty testing; time spent sniffing NA or familiar animal (FA). e, Time in the open arm and distance traveled in the elevated plus maze assay. f, Time in the center of the open field and g, distance traveled in the open field. h, Latency to fall in accelerating rotarod test. Box line denoted median/whiskers denoted 5–95%. n ≥ 10 for all experiments. All behavioral tests were analyzed with two or three-way ANOVA and Sidak post test and single unit recordings were analyzed with Mann-Whitney test, shown as mean SEM. ****P < 0.0001; ***P < 0.001; **P < 0.01; *P < 0.05. P values and complete animal numbers can be found in Supplementary Table 2.
Extended Data Fig. 2
Extended Data Fig. 2. Left Prelimbic Synaptic Properties in PC- Tsc1 Mutant Mice.
a, mini EPSC (mEPSC) representative traces with zoomed in views below initial traces as noted; b, mEPSC frequency; c, mEPSC amplitude; d, mEPSC rise time; e, mEPSC decay time; f, representative mIPSC traces with zoomed in views blow initial traces as noted; g, mIPSC frequency; h, mIPSC amplitude; i, mIPSC rise time; j, and mIPSC decay time in PC-Tsc1 mutant mice and control mice. Groups had 12–15 cells from 5 animals in each. Students t-test, ****P < 0.0001; ***P < 0.001; **P < 0.01; *P < 0.05.
Extended Data Fig. 3
Extended Data Fig. 3. Impact of chemogenetic inhibition of mPFC on Rcrus1 PC inhibition-regulated behaviors.
a, Sample injection site locations in area Rcrus1. b, Awake in vivo single unit recordings in prelimbic cortex (PRL) in mice with Rcrus1 Gi DREADD inhibition (CNO) or vehicle treatment. c, In vivo single unit recordings in motor cortex of anesthetized mice with Rcrus1 Gi DREADDs inhibition compared to baseline. No significant change identified. d, In vivo single unit recordings in right PRL of anesthetized mice with Rcrus1 Gi DREADD inhibition compared to baseline. No significant change identified. e, In vivo single unit recordings in left PRL of anesthetized mice with Rcrus1 Gi DREADD inhibition and either GFP or Gi injection in the mPFC. f, Three chambered social approach assay; time spent sniffing novel animal (NA), or novel object (NO). g, Three chambered social novelty testing; time spent sniffing NA, or familiar animal (FA). h, Time in the open arm and distance traveled in the elevated plus maze assay. i, Time in the center of the open field and j, distance traveled in the open field. k, Latency to fall in accelerating rotarod test. All behavioral tests were analyzed with two or three-way ANOVA and Sidak post test. Single unit recordings were analyzed with Mann-Whitney test, shown as mean SEM. All raw values for frequency of spiking that are shown in figures as normalized values can be found in Extended Data Fig. 10. Box line denoted median/whiskers denoted 5– 95%. n ≥ 10 for all behavioral experiments. ****P < 0.0001; ***P < 0.001; **P < 0.01; *P < 0.05. P values and complete animal numbers can be found in Supplementary Table 2.
Extended Data Fig. 4
Extended Data Fig. 4. Inhibition of LN in PC-Tsc1 mutant mice.
a, Sample injection site locations and injection site pictures of Gi DREADDs injected into LN of PC-Tsc1 mutant mice. b, Single unit activity in the right lateral nucleus (LN) with chemogenetic inhibition (Gi) or control GFP injection. c, Three chambered social approach assay; time spent sniffing novel animal (NA), or novel object (NO). d, Three chambered social novelty testing; time spent sniffing NA, or familiar animal (FA). e, Time in the open arm and distance traveled in the elevated plus maze assay. f, Time in the center of the open field and g, distance traveled in the open field. h, Latency to fall in accelerating rotarod test. All behavioral tests were analyzed with two or three-way ANOVA and Sidak post hoc testing. Recordings were analyzed with Mann-Whitney test, shown as mean SEM. For frequency of spiking shown in figures as normalized values, raw values can be found in Extended Data Fig. 10. Box line denoted median/whiskers denoted 5–95%. n ≥ 10 for all behavioral experiments. ****P < 0.0001; ***P < 0.001; **P < 0.01; *P < 0.05. P values and complete animal numbers can be found in Supplementary Table 2.
Extended Data Fig. 5
Extended Data Fig. 5. Thalamic and layer 1 cortical areas targeted by the medial and lateral cerebellar nuclei.
a, Thalamic nuclei with monosynaptic inputs from the right medial nucleus (MN) and lateral nucleus (LN) identified via AAV1-mediated anterograde transsynaptic tracing. The number of the trans-synaptically labeled thalamic neurons in each nucleus indicated as + + (high), + (low), and - (none). b, Disynaptic inputs from the right MN and LN to distinct cortical regions of the left cerebral cortex, identified via transsynaptic tracing. Labeled input density to layer 1 of each cortical area is indicated as + + (high), + (low), and - (none). c, Representative tracing results of disynaptic inputs from the right MN and LN to distinct areas in the left cerebral cortex. Axons and terminals of thalamic neurons trans-synaptically labeled from injections to MN and LN are indicated in black. Results from injections to MN and LN are in the left and right, respectively, of each panel. Top and bottom parts of each panel correspond to layer 1 and 6. Inputs to layer 1 originate predominantly from the VM thalamus. Arrowheads indicate layer 1. Scale bar applies to all panels. d, representative injection site in the LN and e, representative injection site in the MN. Scale bar applies to all panels. Abbreviations; Aud, auditory cortex; Cg, cingulate cortex; CL, centrolateral thalamic nucleus; FrA, frontal association cortex; IL, infralimbic cortex; LD, laterodorsal thalamic nucleus; LO, lateral orbital cortex; LP, lateroposterior thalamic nucleus; M1 and M2, primary and secondary motor cortex; MD, mediodorsal thalamic nucleus; MO, medial orbital cortex; PF, parafascicular thalamic nucleus; Po, posterior thalamic group; PrL, prelimbic cortex; Ptl, parietal association cortex; Rhi, ecto-/peri-/ento-entorhinal cortex; Rsp, retrosplenial cortex; S1 and S2, primary and secondary sensory cortex; Tem, temporal association cortex; VL, ventrolateral thalamic nucleus; VM, ventromedial thalamic nucleus; VO, ventral orbital cortex.
Extended Data Fig. 6
Extended Data Fig. 6. ChR2 activation of VM thalamus-PRL mPFC circuit.
a, Sample injection site locations for ChR2/Arch injection into the left VM thalamus. b, To test for possible antidromic activation, in vivo anesthetized single unit recordings in the VM thalamus-targeted parietal association cortex (PAC) were performed upon mPFC laser stimulation of ChR2 or GFP VM-thalamus terminals at 20 Hz or 4 Hz. Image of TdTomato positive terminals in PAC from LN AAV-1 tracing injection (top left). c, Three chambered social approach assay; time spent sniffing novel animal (NA), or novel object (NO) with 20 Hz (left) or 4 Hz (right) stimulation. d, Three chambered social novelty testing; time spent sniffing NA, or familiar animal (FA) with 20 Hz (left) or 4 Hz (right) stimulation. e, Time in the open arm and distance traveled in the elevated plus maze assay. f, Distance traveled in the open field and g, time in the center of the open field. All behavioral tests were analyzed with two or three-way ANOVA and Sidak post test and recordings were analyzed with two way ANOVA (unmarked = not significant). For frequency of spiking shown in figures as normalized values (mean SEM), raw values can be found in Extended Data Fig. 10. Box line denoted median/whiskers denoted 5–95%. n ≥ 10 for all behavioral experiments. ****P < 0.0001; ***P < 0.001; **P < 0.01; *P < 0.05. P values and complete animal numbers can be found in Supplementary Table 2.
Extended Data Fig. 7
Extended Data Fig. 7. Arch inhibition of VM thalamus-PRL mPFC circuit on PC-Tsc1 mutant mice.
a, Three chambered social approach assay; time spent sniffing novel animal (NA), or novel object (NO) with 20 Hz (left) or 4 Hz (right) stimulation. b, Three chambered social novelty testing; time spent sniffing NA, or familiar animal (FA) with 20 Hz (left) or 4 Hz (right) stimulation. c, Time in the open arm and distance traveled in the elevated plus maze assay. d, Time in the center of the open field and distance traveled in the open field. All behavioral tests were analyzed with two or three-way ANOVA and Sidak post test. Box line denoted median/whiskers denoted 5–95%. N ≥ 10 for all behavioral experiments. ****P < 0.0001; ***P < 0.001; **P < 0.01; *P < 0.05. P values and complete animal numbers can be found in Supplementary Table 2.
Extended Data Fig. 8
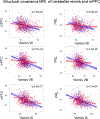
Extended Data Fig. 8. Structural covariance MRI of cerebellar vermis and mPFC.
Structural covariance MRI in mouse models of ASD vs. controls. Comparisons between vermis lobule VII (top), VIII (middle) or IX (bottom) and mPFC (left) or Prelimbic (PRL) mPFC (right). q values are stated. Each dot represents single imaged brain. Additional demographic information can be found in Supplementary Table 3.
Extended Data Fig. 9
Extended Data Fig. 9. Gi DREADDs inhibition of PCs in the posterior vermis and Gq DREADDs activation of posterior vermis in PC-Tsc1 mutant mice.
a, Injection sites from MN and LN tracing to VM thalamus (top) and sample locations of Gi (inhibitory) or Gq (excitatory) DREADD injections into posterior vermis of PC-Tsc1 mice (bottom). b, Three chambered social approach assay; time spent sniffing novel animal (NA), or novel object (NO). c, Three chambered social novelty testing; time spent sniffing NA, or familiar animal (FA). d, Time in the open arm and e, distance traveled in the elevated plus maze assay. f, Time in the center of the open field and g, distance traveled in the open field. h, Latency to fall in accelerating rotarod test. i, Three chambered social approach assay; time spent sniffing novel animal (NA), or novel object (NO). j, Three chambered social novelty testing; time sniffing novel animal (NA), or familiar animal (FA). k, Time in the open arm and distance traveled in the elevated plus maze assay. l, Time in the center of the open field and distance traveled in the open field. m, Latency to fall in accelerating rotarod test. All behavioral tests were analyzed with two or three-way ANOVA and Sidak post test. Box line denoted median/whiskers denoted 5–95%. n ≥ 10 for all behavioral tests. ****P < 0.0001; ***P < 0.001; **P < 0.01; *P < 0.05. P values and complete animal numbers can be found in Supplementary Table 2.
Extended Data Fig. 10
Extended Data Fig. 10. Raw frequency values for all normalized single unit graphs.
a, Frequency of firing of single units recorded in the left medial prefrontal cortex (mPFC) with control or inhibitory (Gi) DREADDs. b, Frequency of firing recorded in the left mPFC or motor cortex, with Rcrus1 Gi inhibition. c, Spike frequency in the mPFC with Rcrus1 Gi and mPFC Gi inhibition. d, Right mPFC spike frequency with Rcrus1 Gi. e, Spike Frequency in the Lateral Nucleus (LN) with LN Gi inhibition. f, mPFC spike frequency with LN Gi DREADDs. g, mPFC spike frequency with VM thalamic-mpfc Channel Rhodopsin (ChR2) activation of 4 Hz or h, 20 Hz. i, mPFC spike frequency with VM thalamus-mPFC Archaerhodopsin (Arch) inhibition at 4 Hz or j, 20 Hz. k, Parietal Association Cortex (PAC) firing with VM thalamic-mPFC ChR2 stimulation at 4 Hz and l, 20 Hz. m, mPFC spike frequency with posterior vermis Gi inhibition. ****P < 0.0001; ***P < 0.001; **P < 0.01; *P < 0.05. P values complete animal numbers can be found in Supplementary Table 2. Statistical analysis was done with the Wilcoxon matched pairs signed ranks test.
Fig. 1:
Fig. 1:. Modulation of elevated PRL activity in PC-Tsc1 mutants rescues social deficits and repetitive/inflexible behaviors.
a, In vivo extracellular recordings in the left PRL mPFC in PC-Tsc1 mutants and littermate controls. Average single-unit firing frequency, with superimposed single-unit traces (top) with average and summary trace (thick black line). b, Representative injection site of inhibitory Gi DREADDs into the left PRL mPFC of PC-Tsc1 mutants. c, Validation of inhibitory Gi DREADDs function through extracellular single-unit recordings in the left PRL of anesthetized mice. d,e, Three-chambered social approach assay and social index (d) and three-chambered social novelty assay and social index (e). f,g, Time spent sniffing scents in social olfaction assay (f) and time spent grooming (g). h, Behavioral flexibility tested in water Y-maze. Rev D, reversal day. All behavioral tests include Gi DREADD-injected and GFP-injected PC-Tsc1 mutants with both CNO and VEH conditions. Box line denotes median, and whiskers denote 5–95%. n ≥ 10 for all groups. Mann–Whitney test conducted for recording analysis, shown as mean ± s.e.m. All raw values for frequency of spiking (shown in figures as normalized values) can be found in Extended Data Fig. 10. Two-way ANOVA with Sidakʼs post test used for all behavioral tests. ****P < 0.0001, ***P < 0.001, **P < 0.01 and *P < 0.05. All other comparisons are not significant. Complete P values and animal numbers can be found in Supplementary Table 1.
Fig. 2:
Fig. 2:. Rcrus1 and PRL are functionally connected and play important roles in ASD behaviors.
a, Average single-unit frequency in the left PRL mPFC upon chemogenetic inhibition of Rcrus1. b, Structural MRI covariance between Rcrus1 and left mPFC (left) and PRL (right) across 30 mouse models of ASD-linked genes; FDR-corrected q values. c, Structural MRI covariance between Rcrus1 and left gyrus rectus in human TD and ASD cohorts from the POND study. For b and c, each dot represents a single imaged brain. d,e, Functional MRI MVPA similarly reveals altered functional connectivity in the mPFC and Rcrus1 and Rcrus2 in individuals with ASD (P < 0.001, FDR cluster P < 0.05) (d), whereas post hoc seed-to-voxel analyses from Rcrus1 seed reveals reduced functional connectivity with the mPFC (yellow), which overlaps with the region delineated by the MVPA (blue) (P < 0.001, k > 50) and with structural MRI findings (e). vmPFC, ventromedial PFC. f, Diagram of experimental approach for viral injections into PRL and Rcrus1. gk, Effect of PRL inhibition on Rcrus1 inhibition-mediated ASD behaviors. g, Social index from three-chambered social approach h, Social novelty testing. i,j, Time spent sniffing in social olfaction assay (i) and time spent grooming (j) were tested. k, Behavioral flexibility tested in water Y-maze assay. All behavioral tests include mice with Gi DREADDs injected into Rcrus1 and either Gi DREADDs or GFP injected into the mPFC with either VEH or CNO injections. Box line denotes median, and whiskers denote 5–95% range. n ≥ 10 for all groups. Mann–Whitney test conducted for recording analysis, shown as mean ± s.e.m. All raw values for frequency of spiking (shown in figures as normalized values) can be found in Extended Data Fig. 10. Two-way ANOVA with Sidakʼs post test used for all behavioral tests. All unlabeled comparisons are not significant. ****P < 0.0001, ***P < 0.001, **P < 0.01 and *P < 0.05. P values, q values and complete numbers and demographics can be found in Supplementary Tables 1, 3 and 4. CON, control; MUT, mutant.
Fig. 3:
Fig. 3:. The cerebellar LN is functionally connected to the PRL cortex and regulates social behaviors.
a, PCs in Rcrus1 project predominantly to the right LN. b, PRL single-unit firing with Gi DREADDs suppression of LN. c, Diagram of experimental approach for Gi DREADDs injection into the LN of PC-Tsc1 mutant mice. dh, Effect of chemogenetic inhibition of right LN (Gi DREADD) on ASD behaviors in PC-Tsc1 mutant mice. d,e, Social index from the three-chambered social approach assay (d) and social index from social novelty testing (e). f,g, Time spent sniffing in social olfaction assay (f) and time spent grooming (g) were tested. h, Behavioral flexibility tested in water Y-maze assay. Box line denotes median, and whiskers denote 5–95%. n ≥ 9 for all groups. Mann–Whitney test conducted for recording analysis, shown as mean ± s.e.m. All raw values for frequency of spiking (shown in figures as normalized values) can be found in Extended Data Fig. 10. Two-way ANOVA with Sidakʼs post test used for all behavioral tests. All unlabeled comparisons are not significant. ****P < 0.0001, ***P < 0.001, **P < 0.01 and *P < 0.05. P values, q values and complete animal numbers can be found in Supplementary Table 1.
Fig. 4:
Fig. 4:. VM thalamus connects to the PRL cortex to regulate ASD behaviors.
a, Trans-synaptic anterograde AAV-1Cre injected into the LN of Cre-dependent Td-tomato reporter mice. bd, Labeling of postsynaptic neuronal cell bodies was observed in the left VM thalamus and terminals in the left PRL mPFC. e,f, Diagram of experimental approach for ChR2 experiments (e) and representative injection site in thalamus and optical fiber placement for optogenetic experiments (f). g, ChR2 stimulation of VM thalamic cells in acute slice preparations results in increased spiking. h, Single units from extracellular recordings in the left PRL mPFC upon 20-Hz or 4-Hz laser stimulation of thalamic-derived terminals in the PRL mPFC. il, Effect of optogenetic activation (4 Hz or 20 Hz) of VM thalamic terminals in the PRL cortex on behavior. i,j, Social index from the three-chambered social approach assay (i) and social index from the social novelty testing (j). k,l, Time spent sniffing in social olfaction assay (k) and time spent grooming (l) were tested. m, Experimental approach for Arch experiments. n, Patch-clamp recordings in acute slice preparations of mice injected with AAV-Arch into the VM thalamus, showing inhibition of thalamic cell firing with photic activation. o, Change in single-unit frequency in the left PRL mPFC upon optogenetic stimulation of VM thalamus-derived terminals in the PRL. ps, Effect of optogenetic inhibition (4 Hz or 20 Hz) of VM thalamic terminals in the PRL cortex on ASD behaviors seen in PC-Tsc1 mutant mice. p,q, Social index from three-chambered social approach assay (p) and social novelty testing (q). r,s, Time spent sniffing in social olfaction assay (r) and time spent grooming (s) were tested. Box line denotes median, and whiskers denote 5–95%. n ≥ 10 for all groups. Two-way ANOVA conducted for recording analysis, shown as mean ± s.e.m. All raw values for frequency of spiking (shown in figures as normalized values) can be found in Extended Data Fig. 10. Two-way ANOVA with Sidakʼs post test used for all behavioral tests. All unlabeled comparisons are not significant. ****P < 0.0001, ***P < 0.001, **P < 0.01 and *P < 0.05. P values and complete animal numbers can be found in Supplementary Table 1.
Fig. 5:
Fig. 5:. Posterior cerebellar vermis is structurally and functionally connected to PRL, and stimulation specifically rescues repetitive/inflexible behaviors.
a, Change in single-unit firing frequency in the mPFC upon chemogenetic inhibition (Gi) of posterior vermis PCs. b, MRI reveals altered structural covariance between posterior vermis and mPFC (left) PRL area (right) in 30 mouse models of ASD-linked genes. Each dot represents a single imaged brain. c, Cerebellar vermis PCs project predominantly to the MN. MN and LN both project to the VM thalamus. d,e, Viral injections into LN (pink) and MN (green) both reveal terminals in the VM thalamus. fi, Trans-synaptic AAV-1Cre anterograde tracing injected into the MN of Cre-dependent Td-tomato reporter mice reveals postsynaptic cells in the VM thalamus (f,g) and terminals in the left PRL mPFC (h,i). jn, Effect of chemogenetic inhibition (Gi) of posterior vermis (j) on ASD behavior (kn). k,l. Social index from the three-chambered social approach assay (k) and social index from the social novelty assay (l). m, Time spent grooming was tested. n, Behavioral flexibility was tested in water Y-maze assay. Rev D, reversal day. os, Effect of chemogenetic stimulation (Gq) of posterior vermis (o) on ASD behaviors in PC-Tsc1 mutant mice (ps). p,q, Social index from the three-chambered social approach assay (p) and social novelty assay (q). r, Time spent grooming was tested. s, Behavioral flexibility was tested in water Y-maze assay. t, Schematic of cerebellar cerebrocortical circuits regulated by Rcrus1 and posterior vermis. Box line denotes median, and whiskers denote 5–95%. n ≥ 9 for all groups. Mann–Whitney test conducted for recording analysis, shown as mean ± s.e.m. All raw values for frequency of spiking (shown in figures as normalized values) can be found in Extended Data Fig. 10. Two-way ANOVA with Sidakʼs post test used for all behavioral tests. All unlabeled comparisons are not significant. P < 0.0001, ***P < 0.001, **P < 0.01 and *P < 0.05. P values, q values and complete animal numbers can be found in Supplementary Tables 1 and 3. CON, control; MUT, mutant.

References

    1. D’Mello AM & Stoodley CJ Cerebro-cerebellar circuits in autism spectrum disorder. Front. Neurosci 9, 408 (2015). - PMC - PubMed
    1. Fatemi SH et al. Consensus paper: pathological role of the cerebellum in autism. Cerebellum 11, 777–807 (2012). - PMC - PubMed
    1. Mosconi MW, Wang Z, Schmitt LM, Tsai P & Sweeney JA The role of cerebellar circuitry alterations in the pathophysiology of autism spectrum disorders. Front. Neurosci 9, 296 (2015). - PMC - PubMed
    1. Tsai PT Autism and cerebellar dysfunction: evidence from animal models. Semin. Fetal Neonatal Med 21, 349–355 (2016). - PubMed
    1. Tsai PT et al. Autistic-like behaviour and cerebellar dysfunction in Purkinje cell Tsc1 mutant mice. Nature 488, 647–651 (2012). - PMC - PubMed

Publication types