Multicenter Study
. 2020 Aug;52(8):778-789.
doi: 10.1038/s41588-020-0648-8. Epub 2020 Jul 13.

The DNA methylation landscape of advanced prostate cancer

Shuang G Zhao #  1   2   3   4   5 William S Chen #  3   4   6 Haolong Li #  3   4 Adam Foye  4   7 Meng Zhang  3   4 Martin Sjöström  3   4 Rahul Aggarwal  4   7 Denise Playdle  4   7 Arnold Liao  8 Joshi J Alumkal  9   10 Rajdeep Das  3   4 Jonathan Chou  3   4   7 Junjie T Hua  11 Travis J Barnard  3   4 Adina M Bailey  4   7 Eric D Chow  12   13 Marc D Perry  3   4   7 Ha X Dang  14   15   16 Rendong Yang  17 Ruhollah Moussavi-Baygi  3   4 Li Zhang  4   7 Mohammed Alshalalfa  3 S Laura Chang  3 Kathleen E Houlahan  18   19   20 Yu-Jia Shiah  18 Tomasz M Beer  9   21 George Thomas  9   22 Kim N Chi  23   24 Martin Gleave  23 Amina Zoubeidi  23 Robert E Reiter  25 Matthew B Rettig  25   26 Owen Witte  27 M Yvonne Kim  28 Lawrence Fong  4   7 Daniel E Spratt  1 Todd M Morgan  2   5   29 Rohit Bose  4   7   30   31 Franklin W Huang  4   7 Hui Li  3   4 Lisa Chesner  3   4 Tanushree Shenoy  4   7 Hani Goodarzi  12   30 Irfan A Asangani  32 Shahneen Sandhu  33 Joshua M Lang  34 Nupam P Mahajan  16   35 Primo N Lara  36   37 Christopher P Evans  37   38 Phillip Febbo  8 Serafim Batzoglou  8 Karen E Knudsen  39 Housheng H He  11   19 Jiaoti Huang  40 Wilbert Zwart  41 Joseph F Costello  28 Jianhua Luo  42 Scott A Tomlins  5 Alexander W Wyatt  23 Scott M Dehm  43   44 Alan Ashworth  4   7 Luke A Gilbert  4   30 Paul C Boutros  19   20   25 Kyle Farh  8 Arul M Chinnaiyan  2   5   29   45   46   47 Christopher A Maher  14   15   16   48 Eric J Small  4   7 David A Quigley  4   30   49 Felix Y Feng  50   51   52   53
Affiliations
Multicenter Study

The DNA methylation landscape of advanced prostate cancer

Shuang G Zhao et al. Nat Genet. 2020 Aug.

Abstract

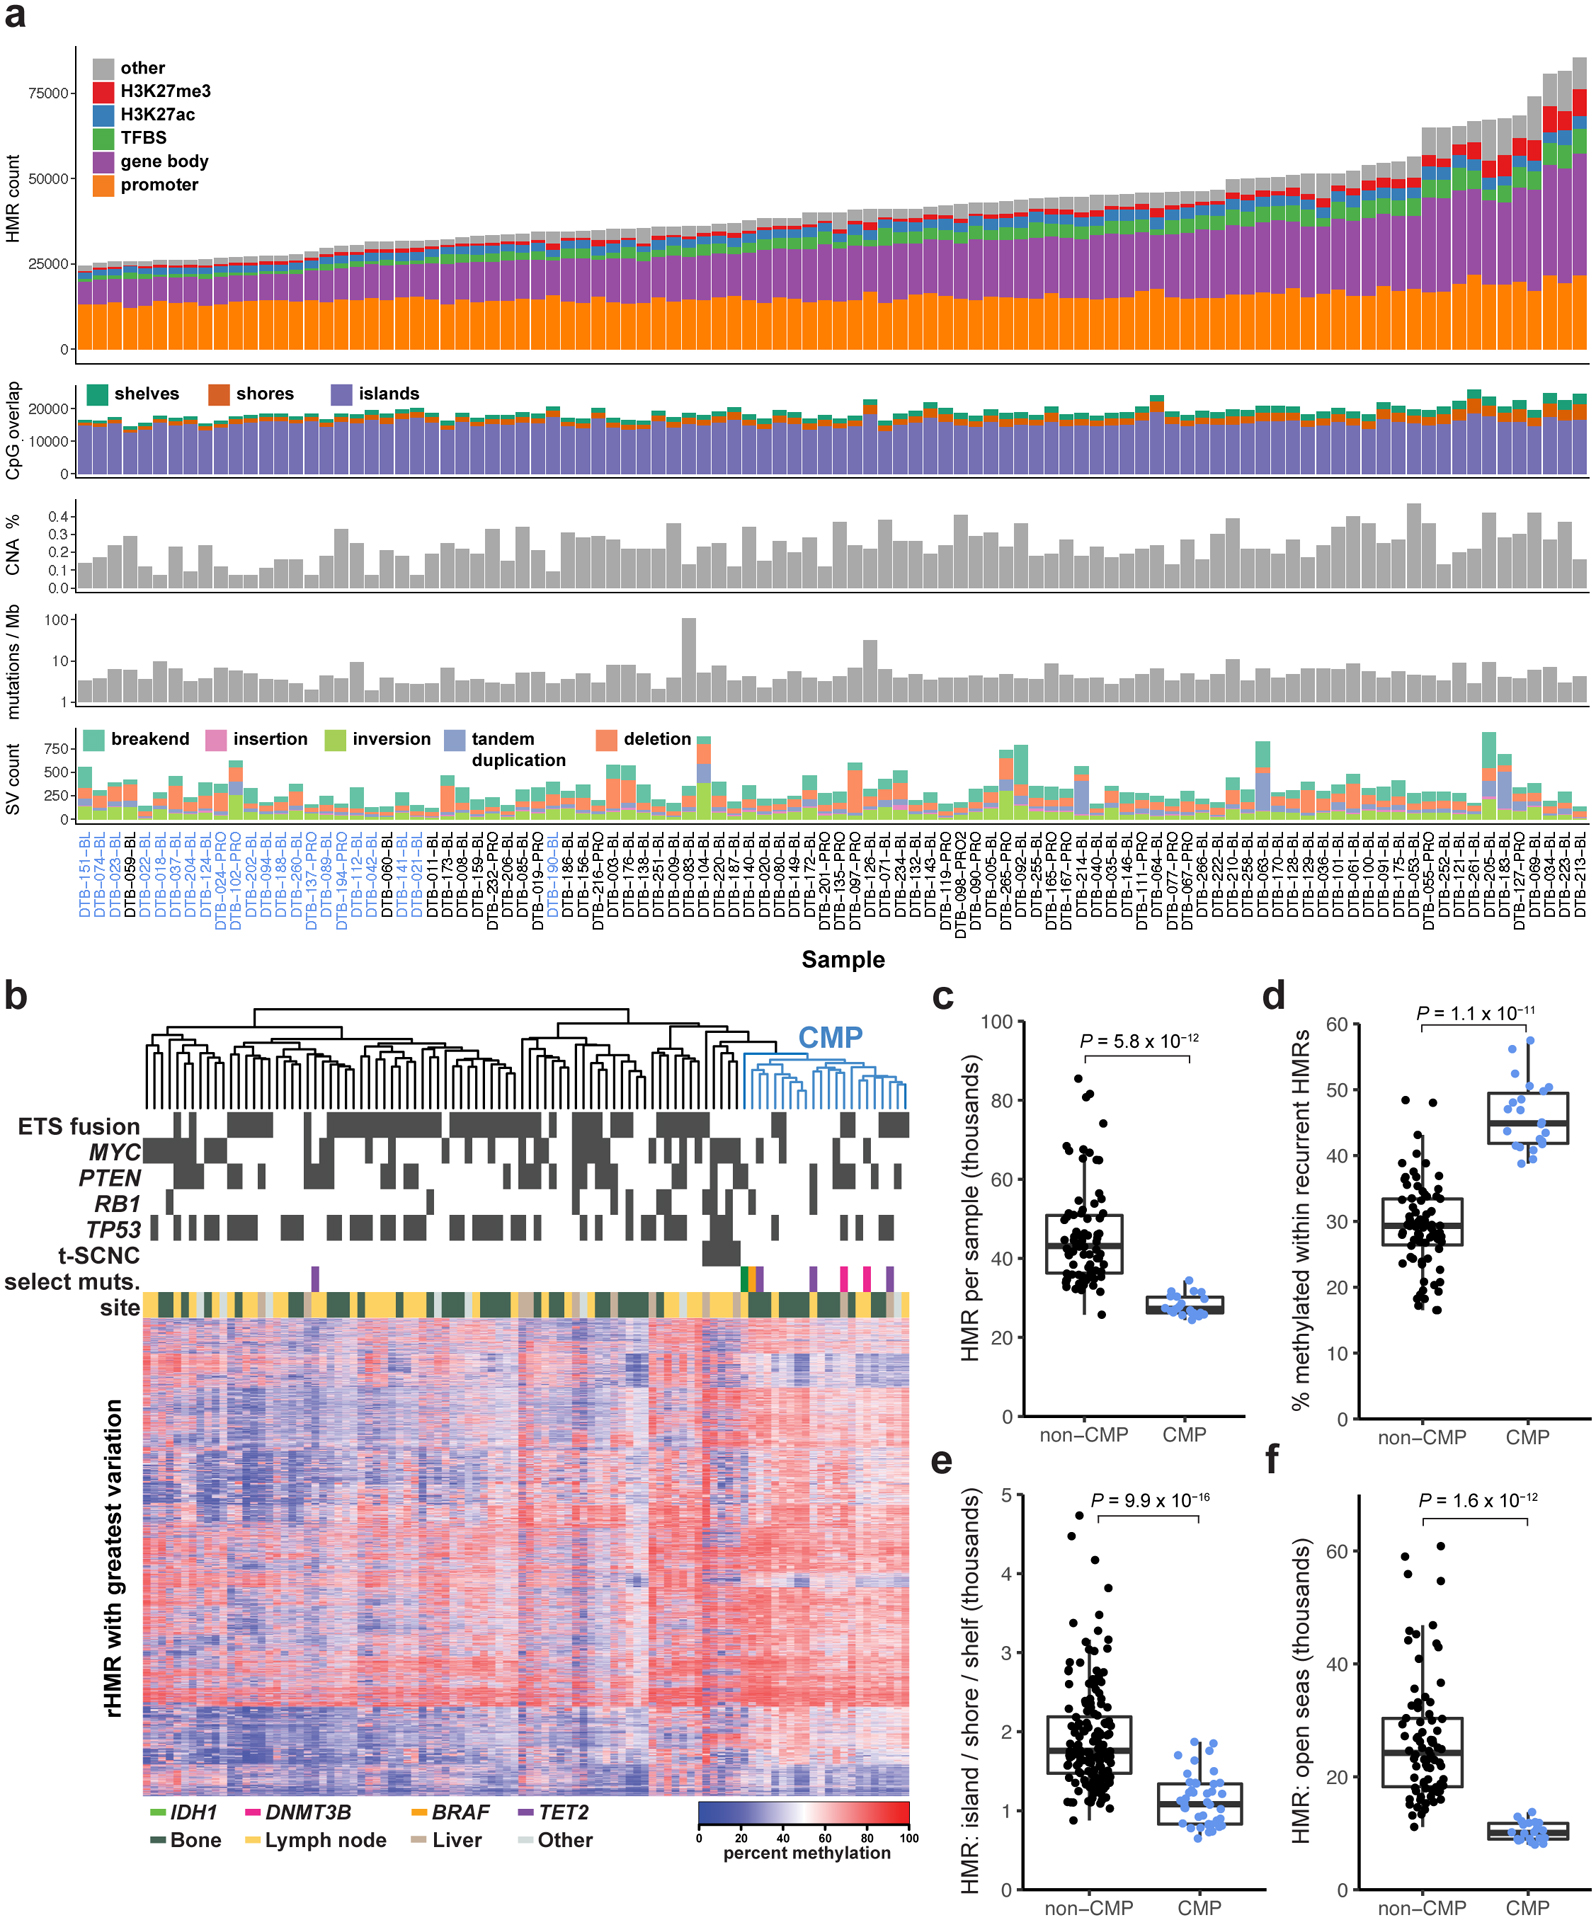
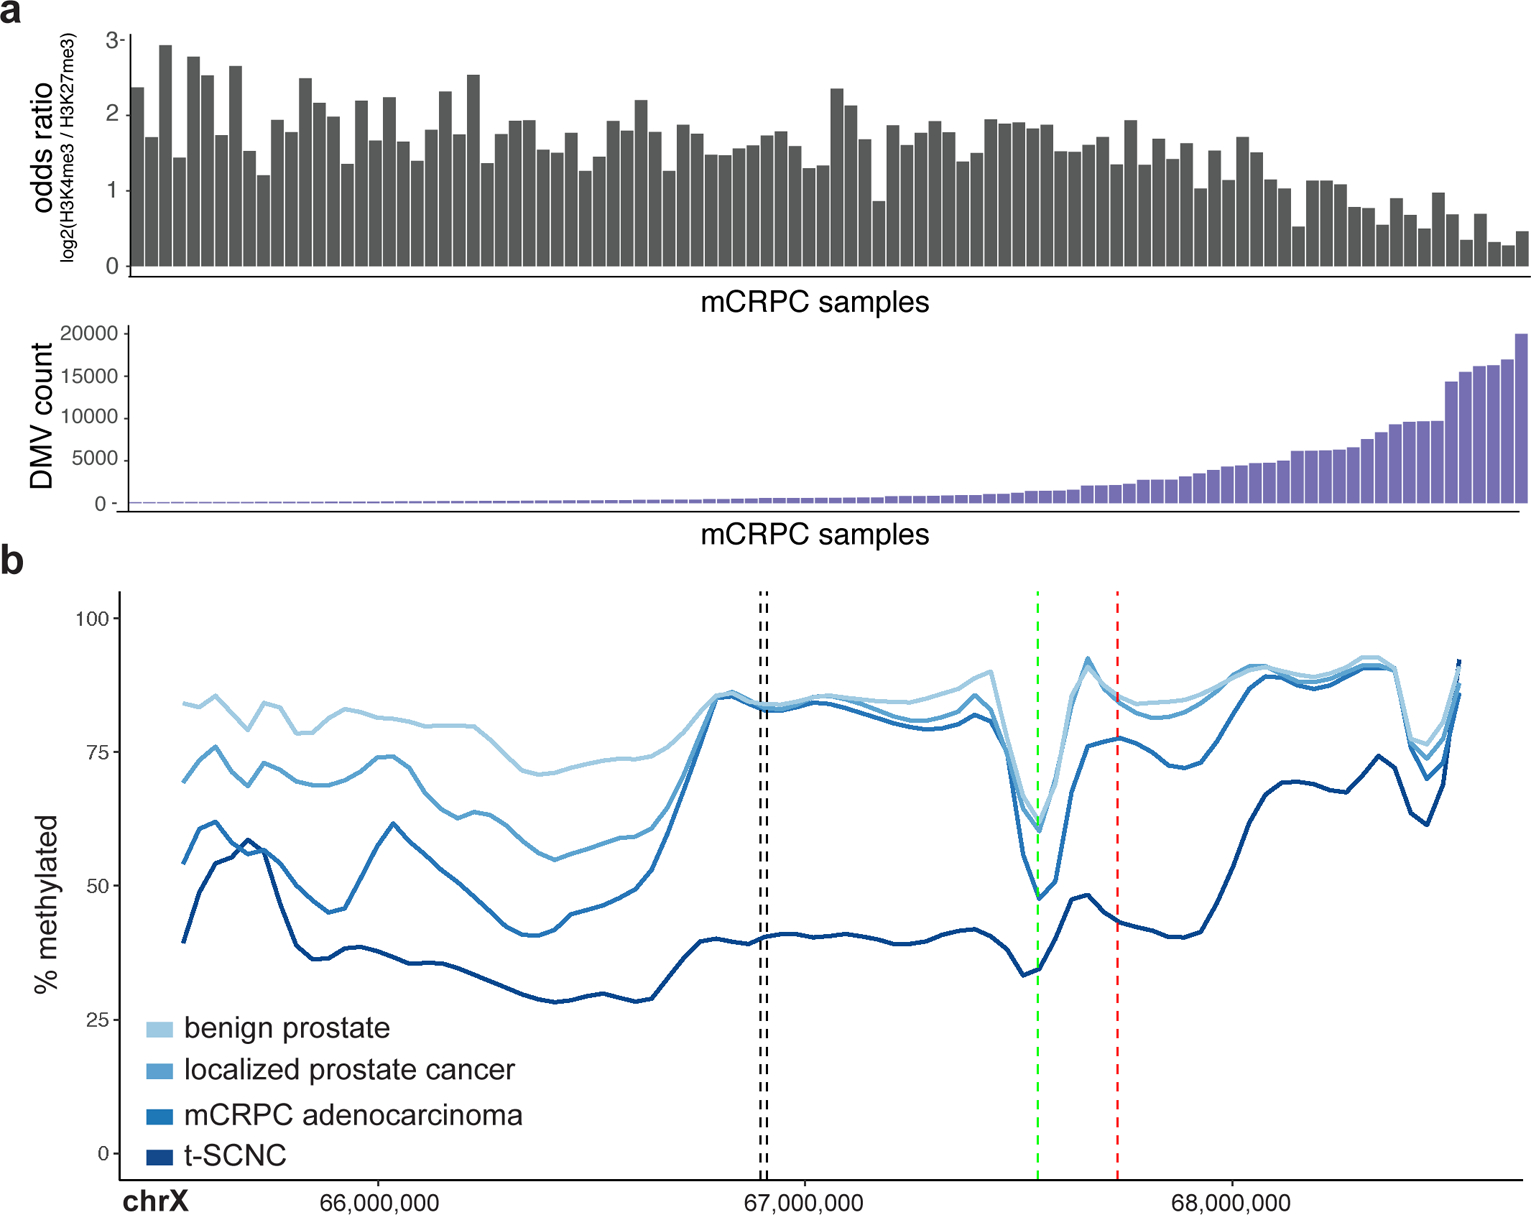
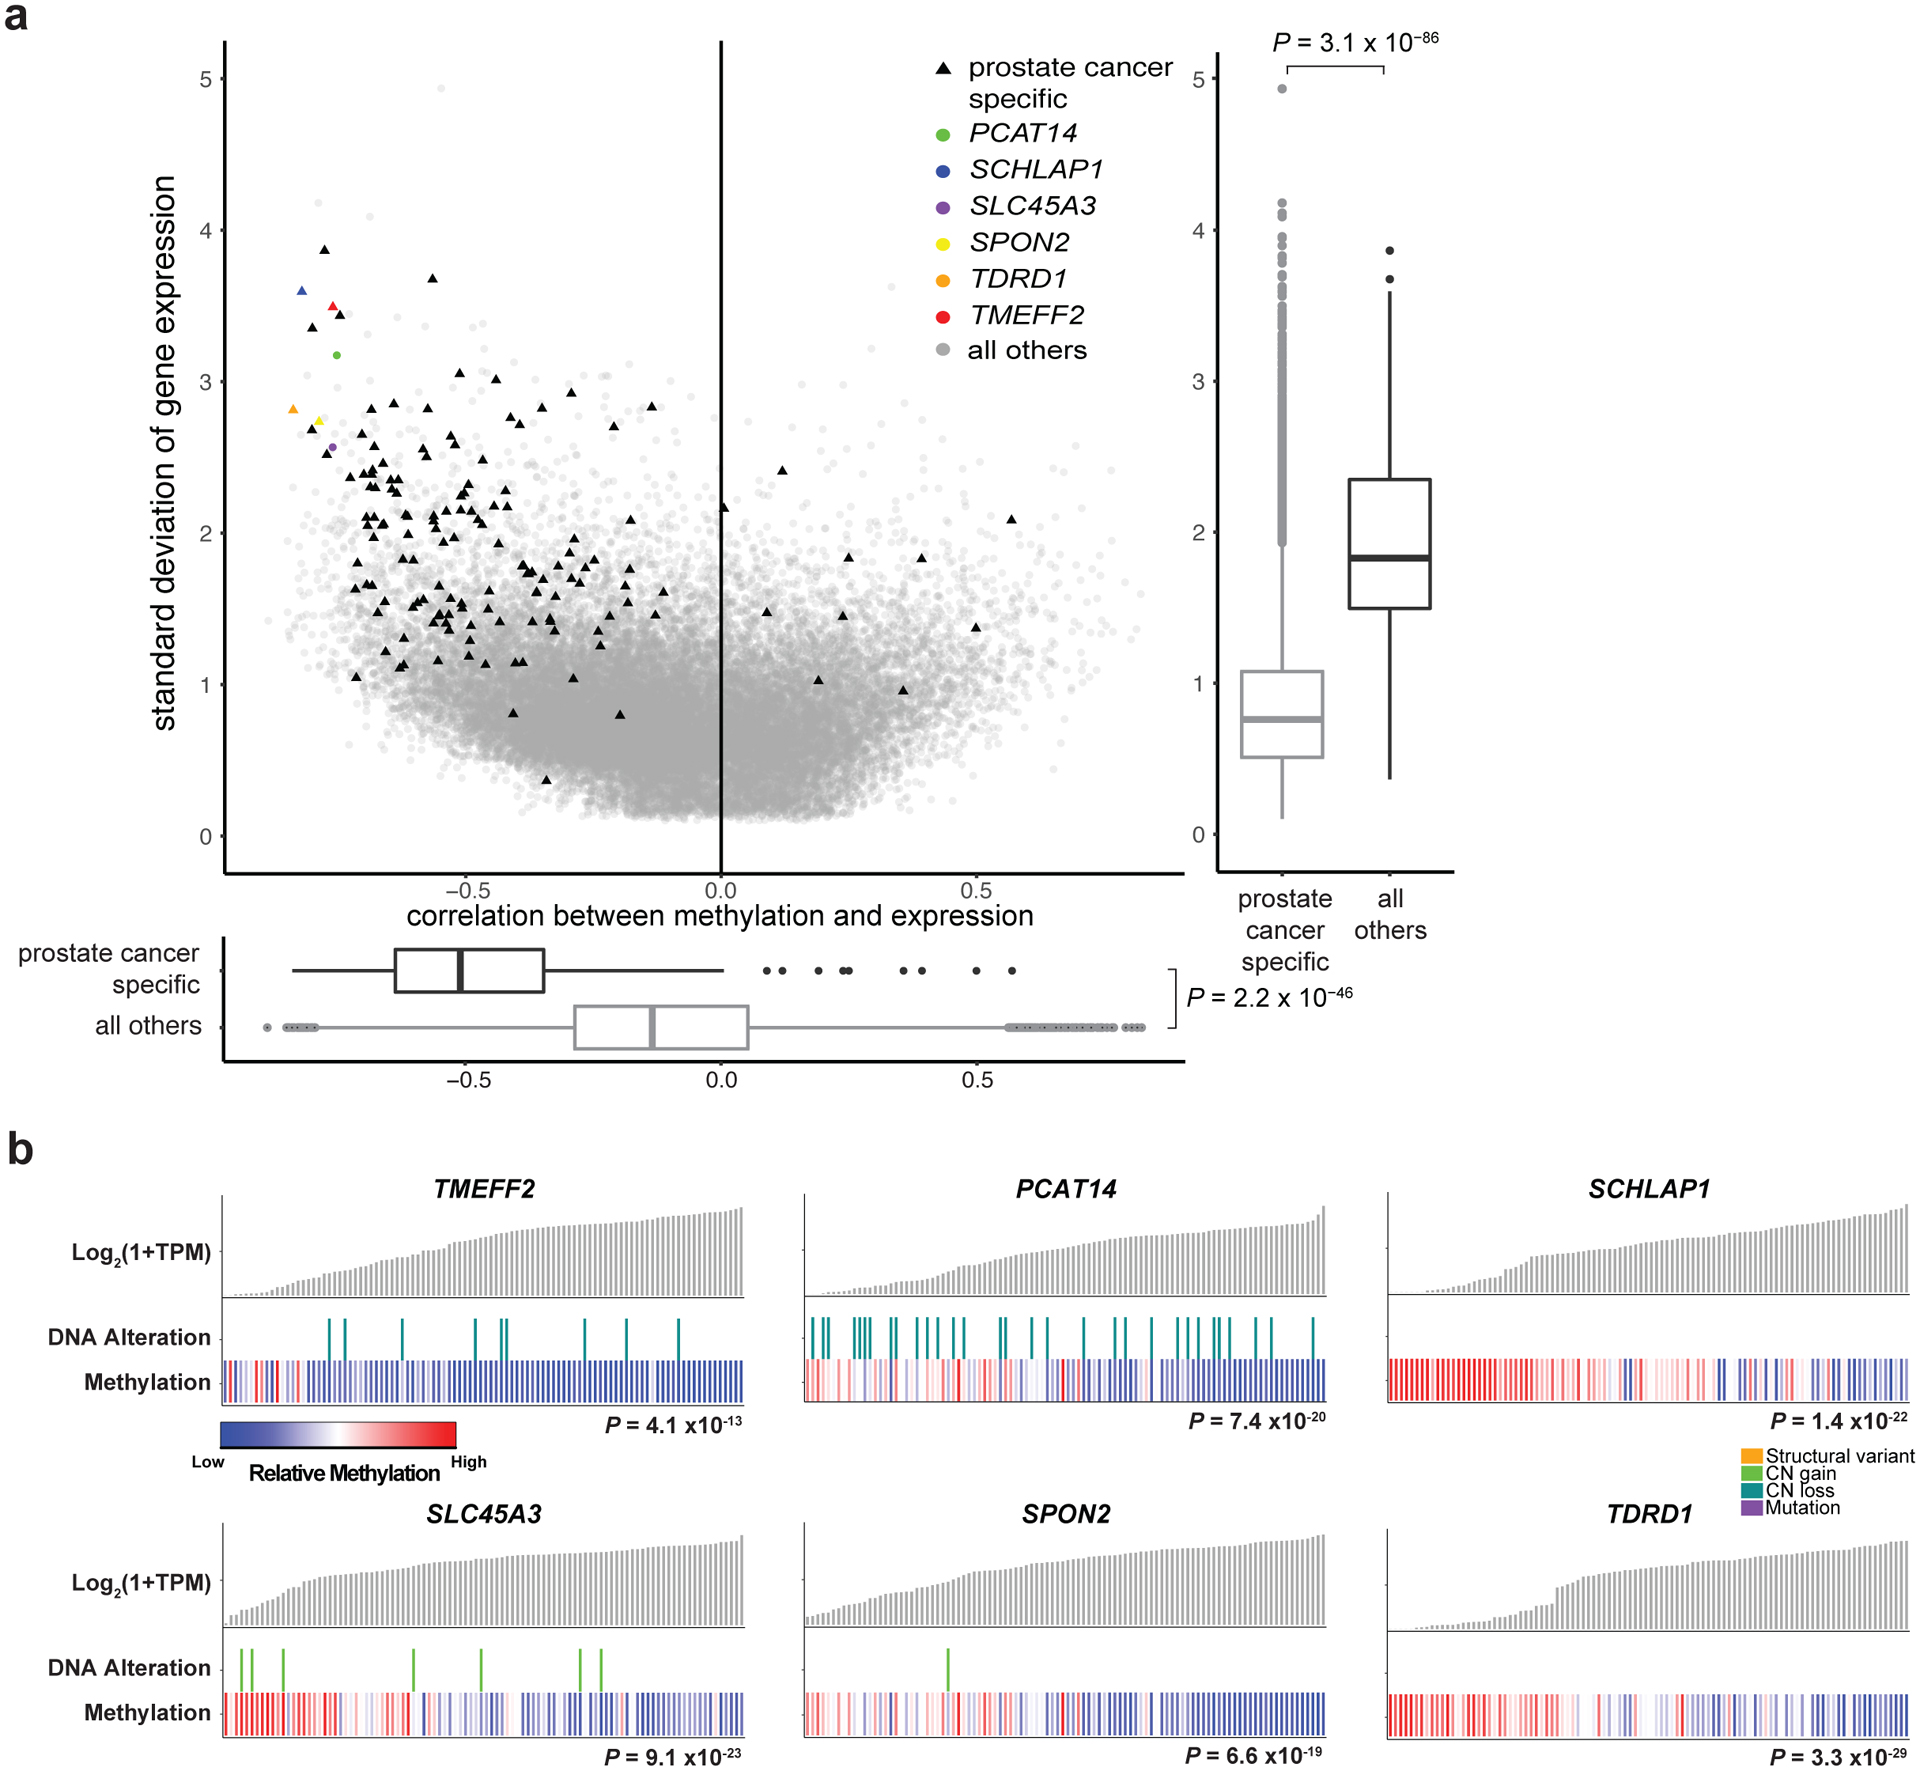
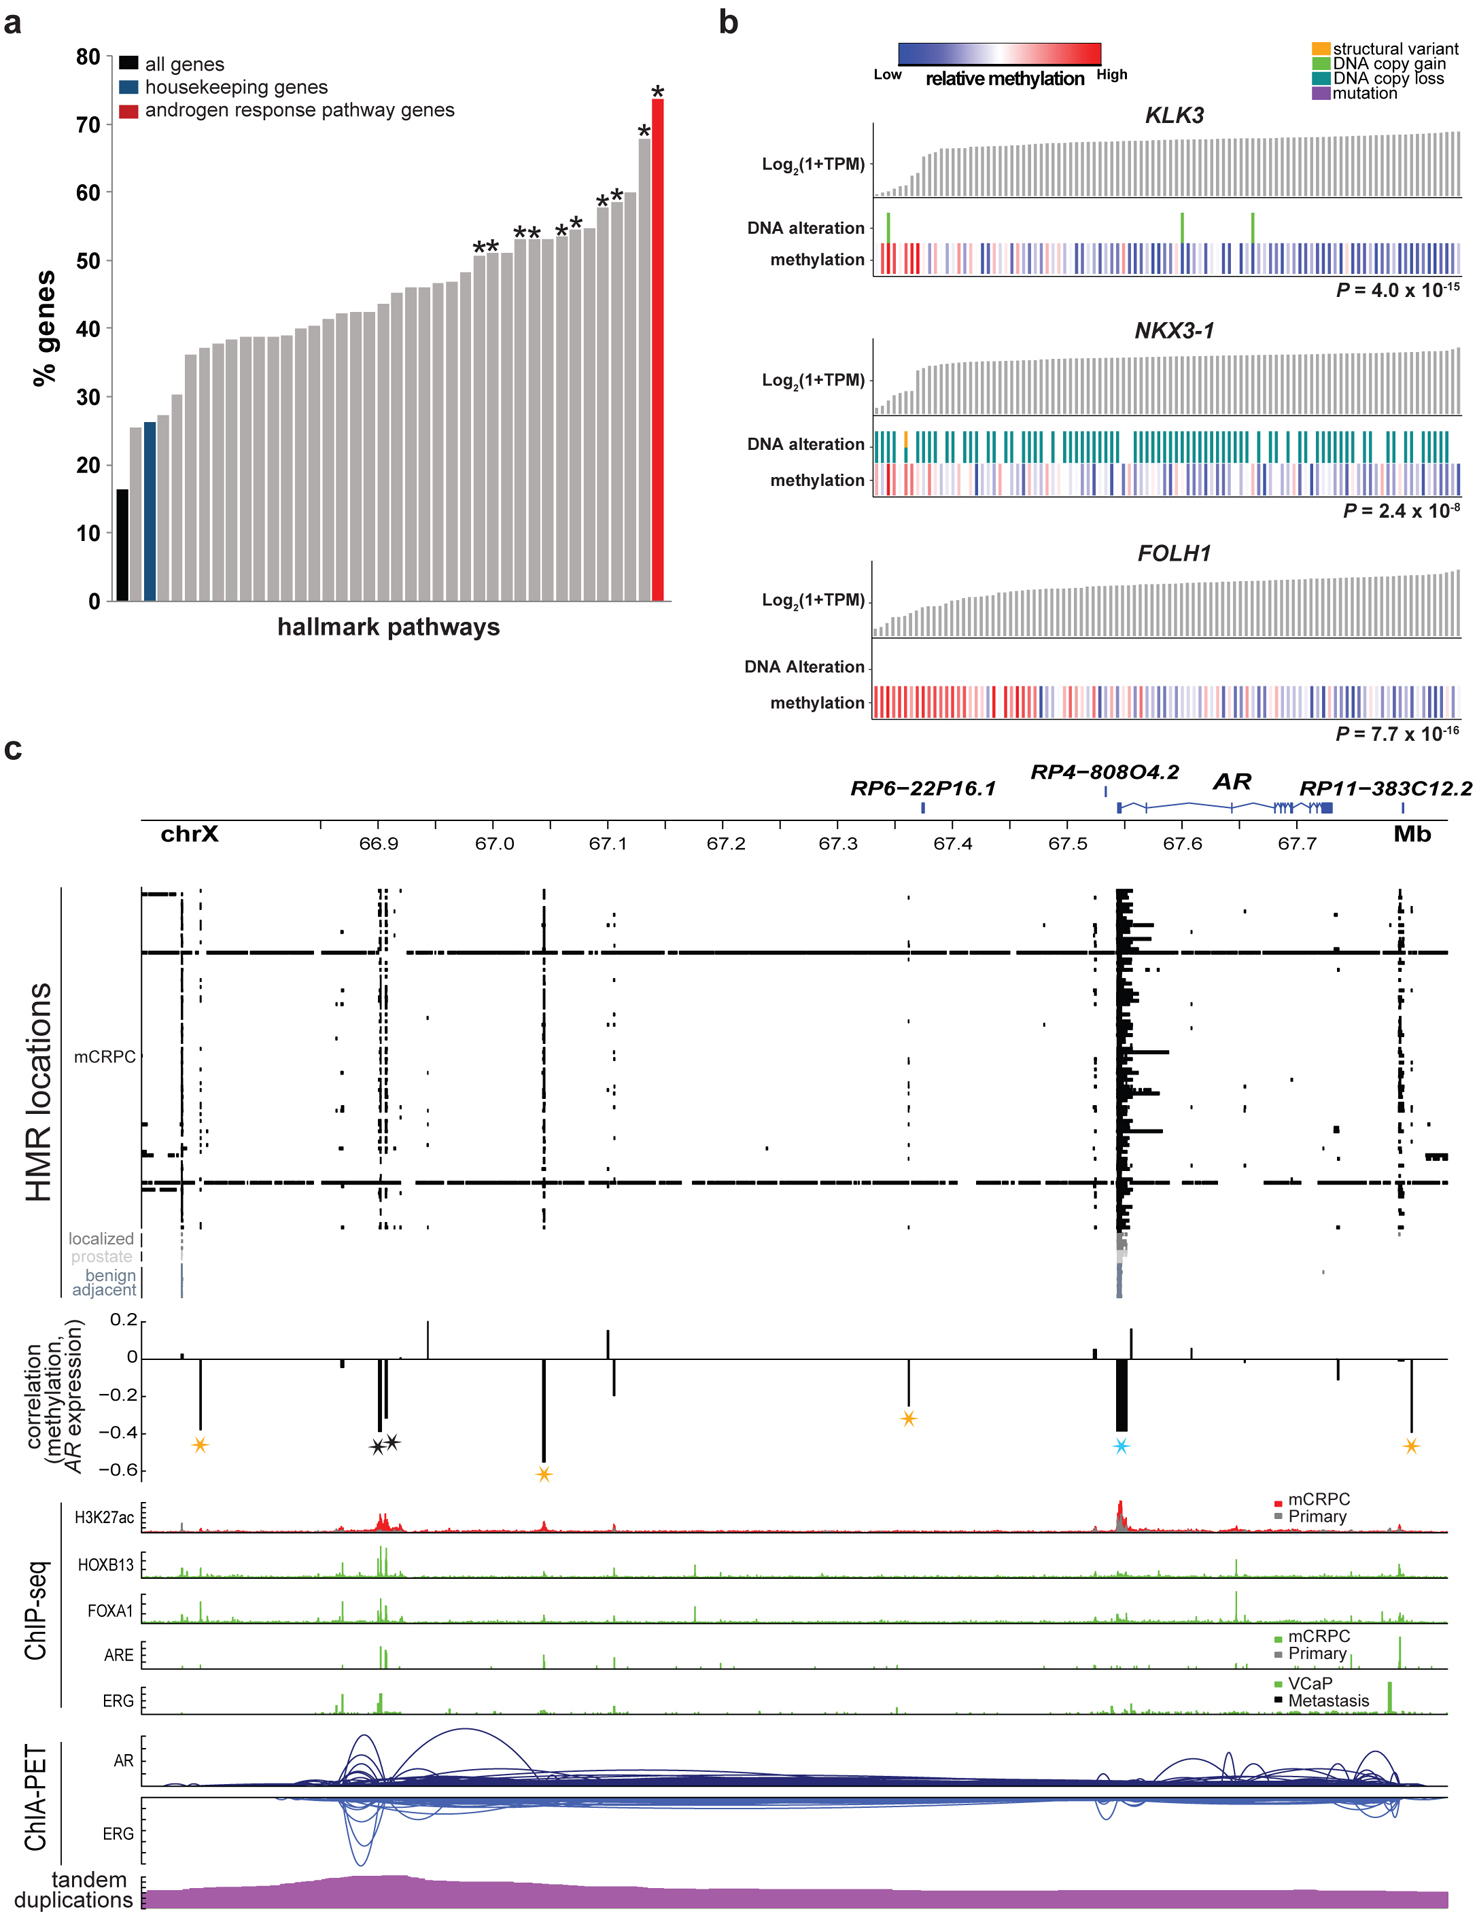
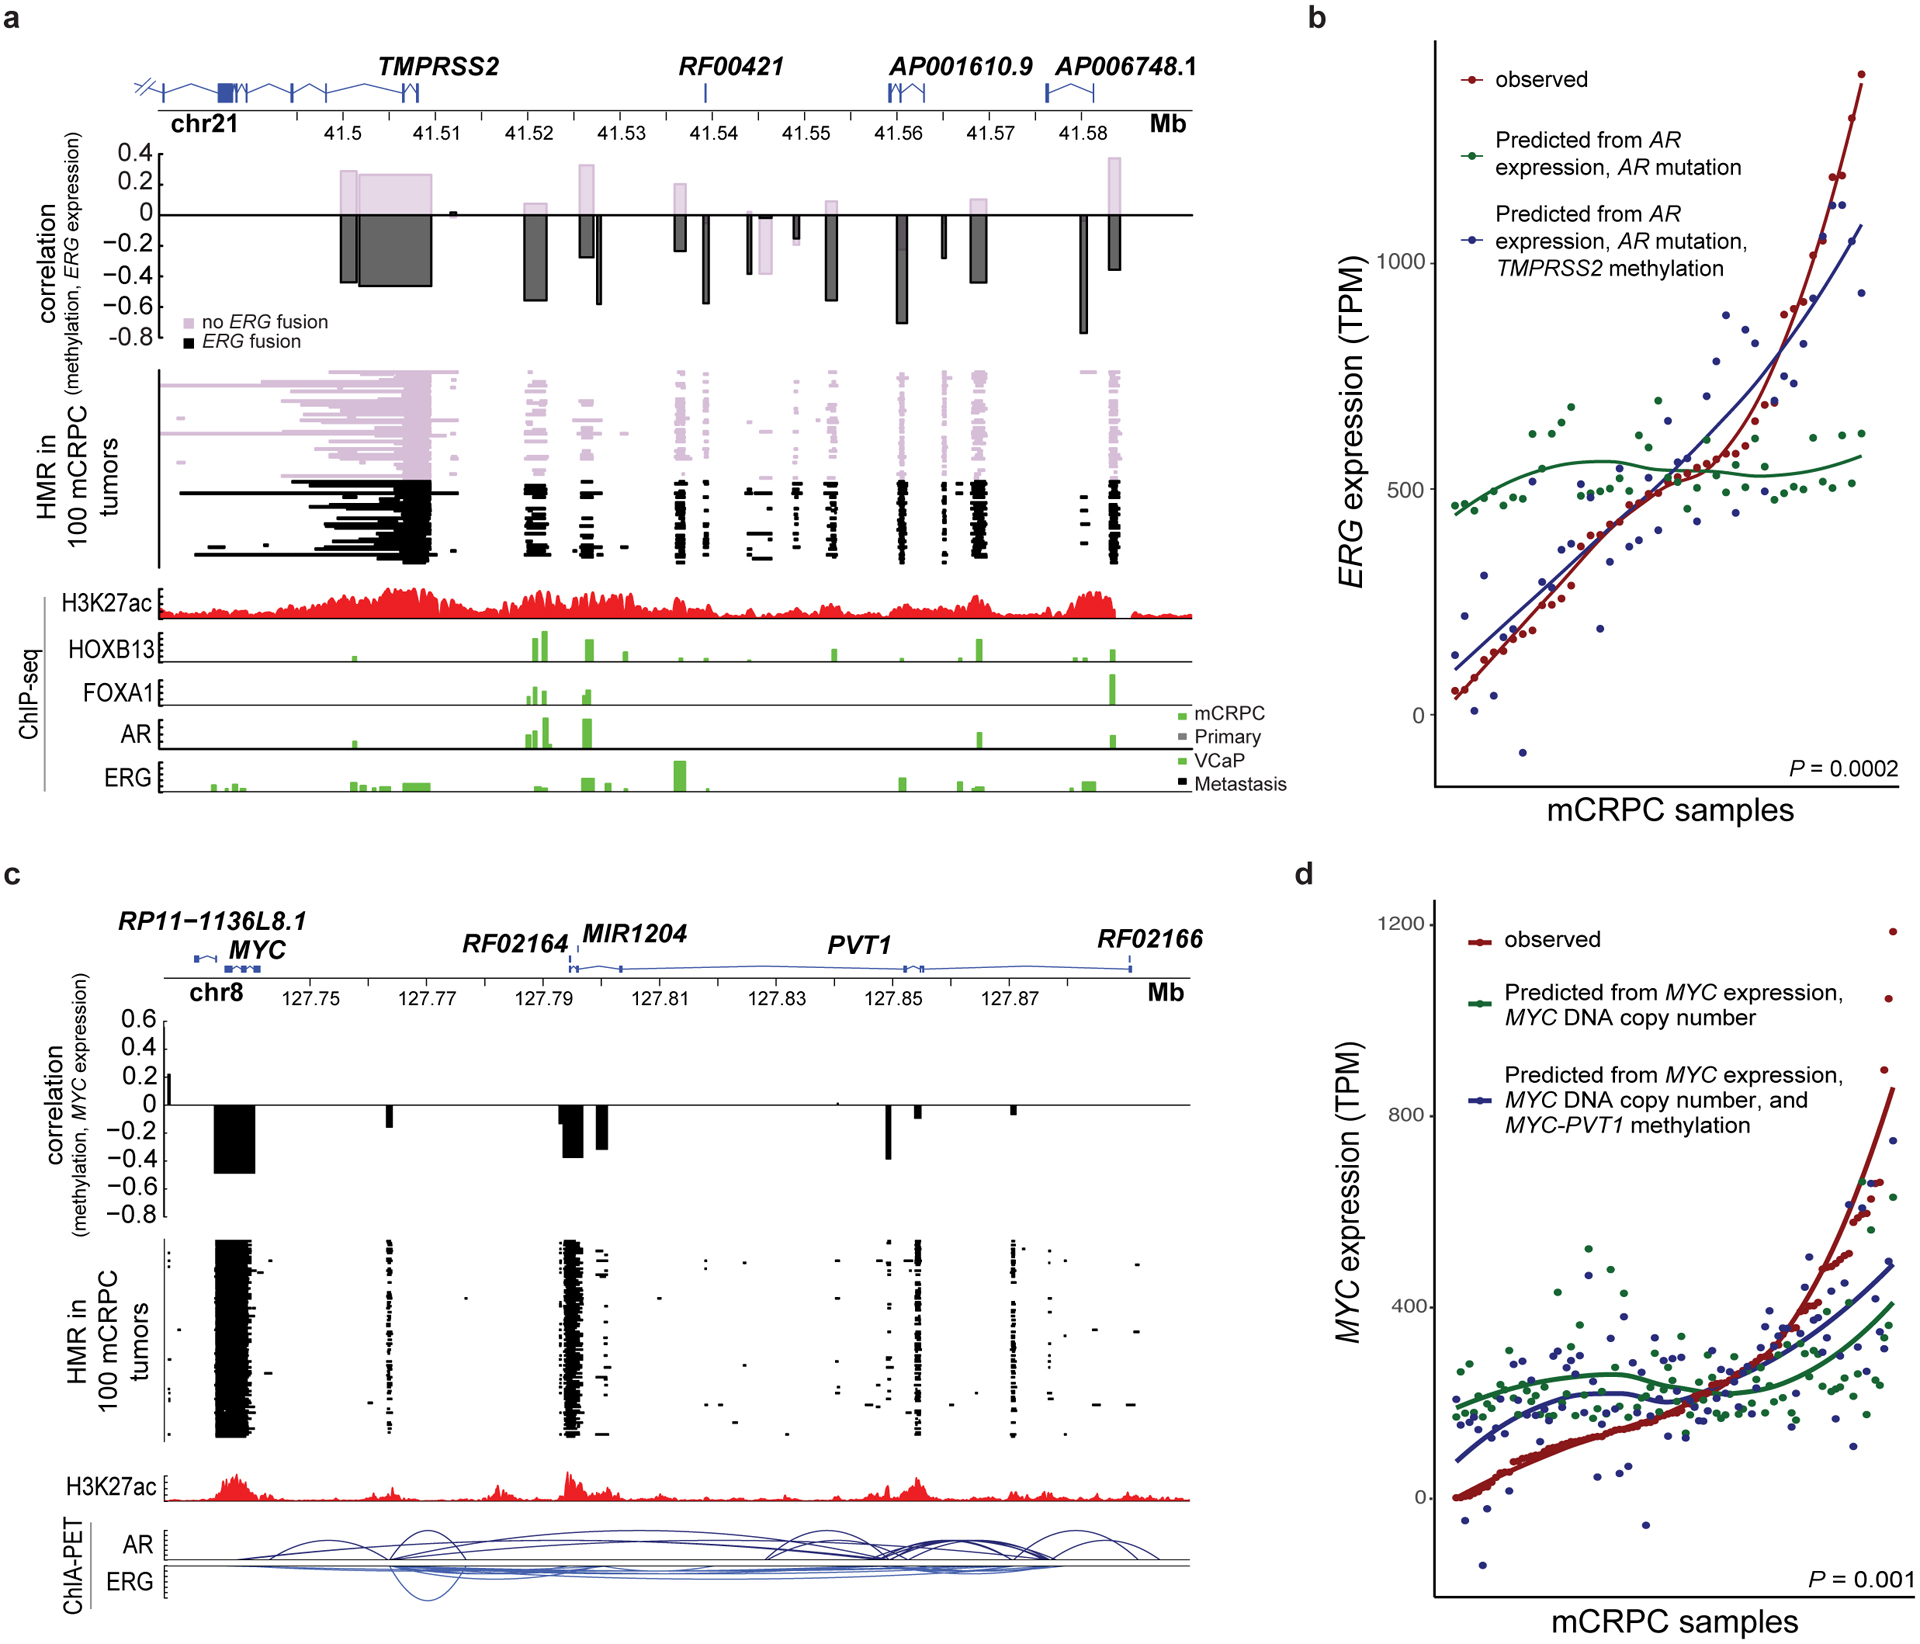
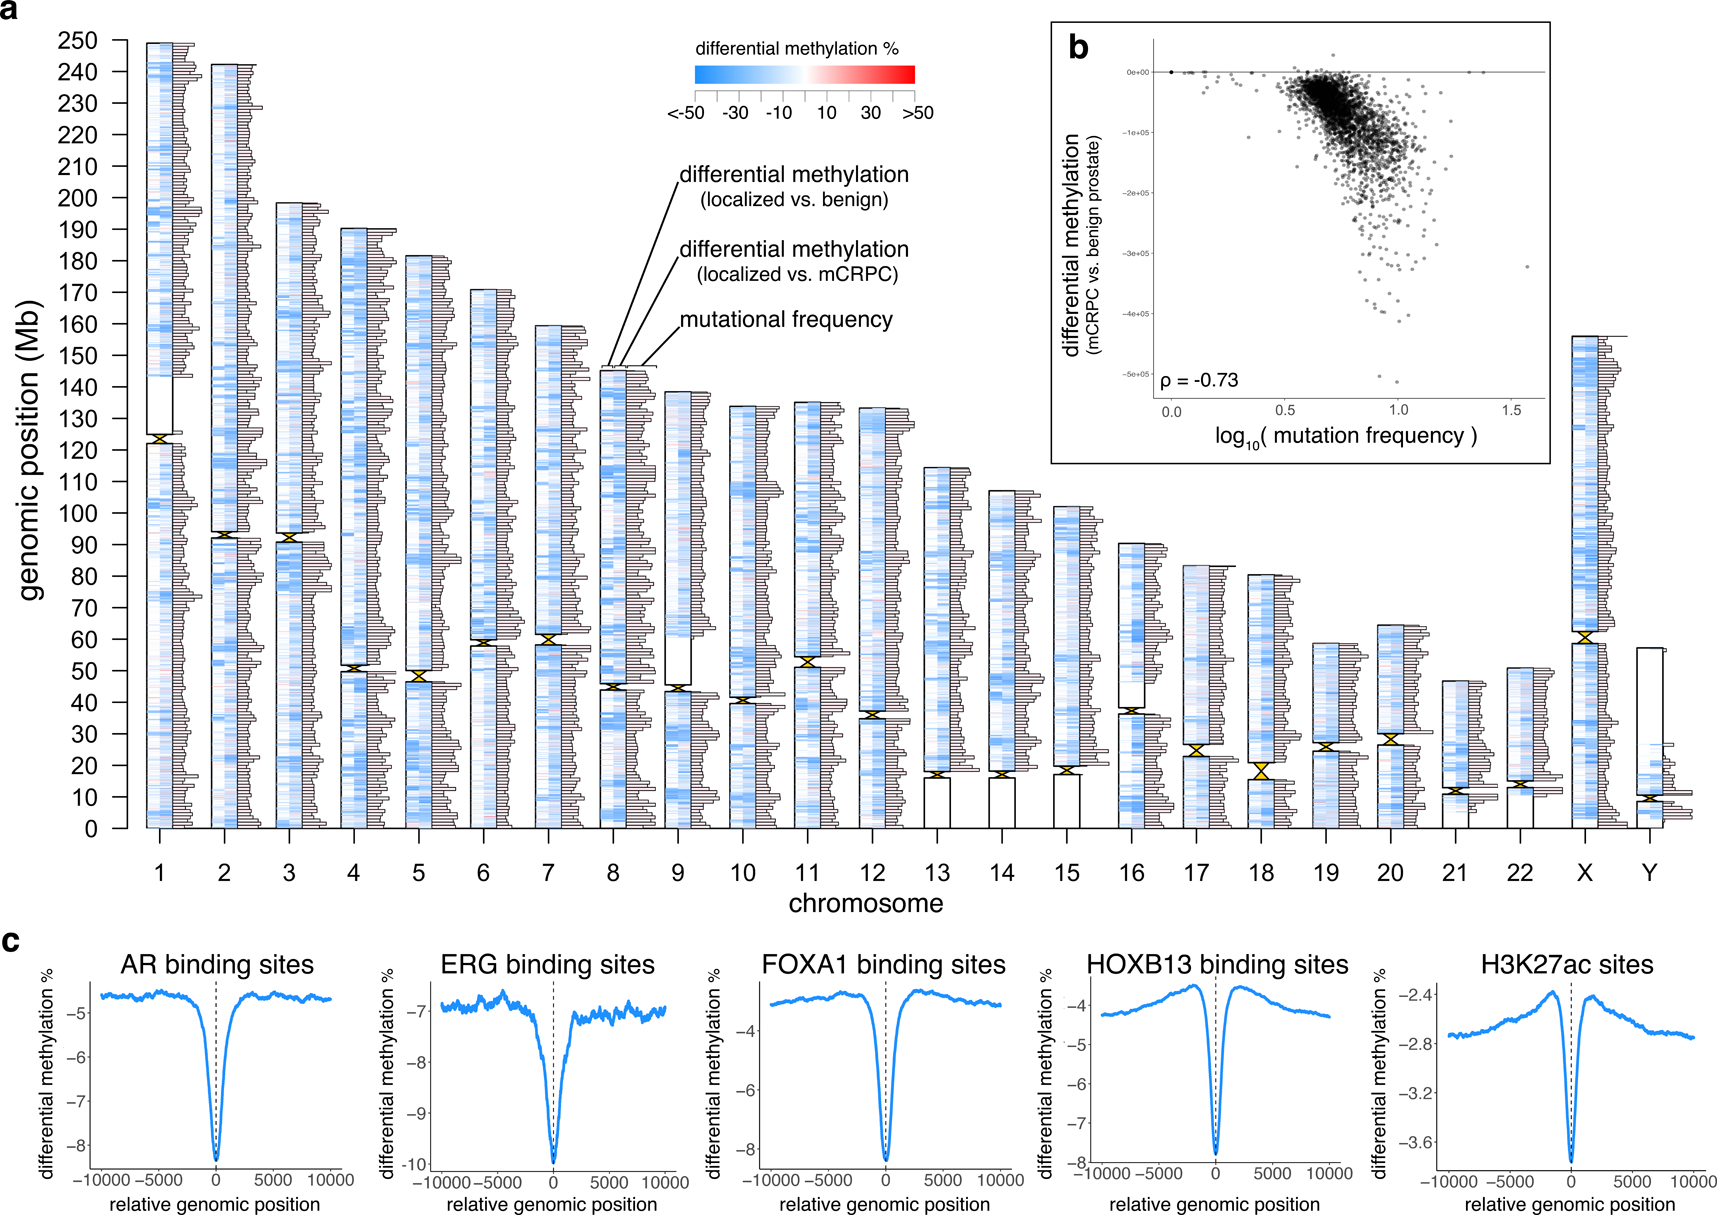
Although DNA methylation is a key regulator of gene expression, the comprehensive methylation landscape of metastatic cancer has never been defined. Through whole-genome bisulfite sequencing paired with deep whole-genome and transcriptome sequencing of 100 castration-resistant prostate metastases, we discovered alterations affecting driver genes that were detectable only with integrated whole-genome approaches. Notably, we observed that 22% of tumors exhibited a novel epigenomic subtype associated with hypermethylation and somatic mutations in TET2, DNMT3B, IDH1 and BRAF. We also identified intergenic regions where methylation is associated with RNA expression of the oncogenic driver genes AR, MYC and ERG. Finally, we showed that differential methylation during progression preferentially occurs at somatic mutational hotspots and putative regulatory regions. This study is a large integrated study of whole-genome, whole-methylome and whole-transcriptome sequencing in metastatic cancer that provides a comprehensive overview of the important regulatory role of methylation in metastatic castration-resistant prostate cancer.


Figures

Figure 1:
Figure 1:. CpG Methylator Phenotype (CMP)
a, Sample-level summary of hypo-methylated region (HMR) frequency and somatic alterations in 100 independent mCRPC samples. Bar plots show HMR counts within genomic features (HMR count), counts of HMRs overlapping with CpG islands/shores/shelves (CpG overlap), percent of the genome with DNA copy number alterations (CNA %), somatic mutations per megabase (Mutations / Mb), and counts of structural variants (SV count). CMP samples labeled in blue. TFBS, transcription factor binding site. b, Hierarchical clustering of the 10% most variable recurrent HMRs in 100 mCRPC samples. Blue dendrogram denotes CMP samples. c, HMR count per sample in thousands in non-CMP (N=78) and CMP (N=22). Significance was assessed with two-sided Wilcoxon test. d, Percent of CpGs methylated at loci harboring recurrent HMRs in Non-CMP (N=78) and CMP (N=22), plotted and assessed as in (c). e, rHMRs located in CpG islands, shores, and shelves, count per sample in thousands, plotted and assessed as in (c). f, rHMRs located in open seas, count per sample in thousands, plotted and assessed as in (c). Boxplots show the median, first, and third quartiles, and outliers are shown if outside 1.5x the inter-quartile range.
Figure 2:
Figure 2:. DNA methylation valleys (DMVs)
a, Top: Sample-level log2 odds ratio calculated from the number of DMVs which overlap H3K4me3 vs. H3K27me3 sites. Lower values favor H3K27me3, higher values favor H3K4me3. Bottom: Sample-level count of DMVs in order matching top panel. b, Mean percent methylation across the AR locus for benign prostate (N=4), localized prostate cancer (N=5), mCRPC adenocarcinoma (N=95), and t-SCNC samples (N=5). Vertical black lines show the location of the previously identified AR enhancer. The vertical green and red lines show the TSS and transcriptional terminator of the androgen receptor, respectively.
Figure 3:
Figure 3:. Methylation associated with prostate cancer-specific genes
a, Variability in gene expression levels versus the correlation between gene expression and methylation. Expression variability was calculated as standard deviation (Log2(TPM+1), and correlation calculated at the most significant promoter/gene body eHMR for each gene. Y-axis box-plot shows gene expression variability for prostate cancer-specific genes versus all other genes. X-axis box-plot shows correlation of methylation with gene expression of prostate cancer-specific genes versus all other genes. Significance was assessed with two-sided Wilcoxon test, N=169 vs. 51502. Boxplots show the median, first, and third quartiles, and outliers are shown if outside 1.5x the inter-quartile range. b, Sample-level gene expression levels compared to the presence of DNA alterations and methylation at the most significant promoter/gene body eHMR. Alterations predicted to be activating (SLC45A3, SPON2, TDRD1, SCHLAP1) or inactivating (TMEFF2, PCAT14) are shown). Significance of methylation levels was assessed by ANOVA comparing a model predicting gene expression from DNA alterations alone to a second model with methylation as an added factor. N=100 independent mCRPC samples. CN, copy number.
Figure 4:
Figure 4:. Methylation association with the androgen response pathway
a, Percentage of genes in MSigDB Hallmark pathways for which methylation predicted expression independently from DNA alterations in a linear model. An asterisk indicates significant enrichment (two-sided FDR ≤ 0.05) relative to the set of all housekeeping genes. Significance was assessed with a two-sided Fisher’s exact test. N=100 independent mCRPC samples. b, Sample-level gene expression levels compared to the presence of DNA alterations and methylation at the most significant promoter/gene body eHMR. Alterations predicted to be activating (KLK3, FOLH1) or inactivating (NKX3–1) are shown). Significance of methylation levels was assessed by ANOVA comparing a model predicting gene expression from DNA alterations alone to a second model with methylation as an added factor, N=100 independent mCRPC samples. c, HMRs, correlation between methylation in at loci harboring recurrent HMRs and AR expression, ChIP-seq peaks (H3K27ac, AR, ERG, FOXA1, HOXB13), and ChIA-PET interactions (AR and ERG) at the AR locus. Stars denote HMRs at which methylation was associated with AR expression (eHMRs), colored black for previously reported AR upstream enhancer, blue for the AR promoter, gold for new putative AR regulatory regions. Significance was assessed with a two-sided Spearman’s correlation test, N=100 independent mCRPC samples. “Primary” in the ChIP-seq tracks indicates localized primary prostate cancer.
Figure 5:
Figure 5:. Methylation association with TMPRSS2-ERG and MYC
a, HMRs, correlation between methylation in loci harboring recurrent HMRs and ERG expression, and ChIP-seq peaks (H3K27ac, AR, ERG, FOXA1, HOXB13) at the TMPRSS2 locus. Significance was assessed with two-sided Spearman’s correlation, N=100 independent mCRPC samples. TMPRSS2 isoform 204 was not shown as its TSS was ~20Kbp upstream of the other 5 protein coding isoforms. b, Observed ERG expression in TMPRSS2-ERG fusion positive mCRPC and ERG expression predicted in those tumors using two linear models: one including AR expression and AR mutations and another including AR expression, AR mutations, and methylation at the TMPRSS2 promoter and upstream locus. Significance was assessed by a two-sided ANOVA (N=41 independent fusion positive samples). c, HMRs, correlation between methylation in recurrent HMRs and MYC expression, ChIP-seq peaks (H3K27ac), and ChIA-PET interactions (AR and ERG) at the MYC-PVT1 locus. Significance was assessed with two-sided Spearman’s correlation, N=100 independent mCRPC samples. “Primary” in the ChIP-seq tracks indicates localized primary prostate cancer. d, Observed MYC expression and MYC expression predicted in those tumors using two linear models: one including MYC copy number alone and another including MYC copy number and methylation at the MYC-PVT1 locus. Significance was assessed by a two-sided ANOVA (N=100 independent mCRPC samples).
Figure 6:
Figure 6:. Genome-wide analysis of differential methylation
a, Differentially methylated regions (DMRs) and mutation frequency in mCRPC. Ideogram shows, for each chromosome, from left to right: DMRs comparing primary prostate cancer (N=5) to benign prostate (N=4), DMRs comparing mCRPC (adenocarcinoma, N=95) to primary prostate cancer (N=5), and mutational frequency in 1Mbp windows in the mCRPC samples (excluding two hyper-mutated samples). Maximum bar height in mutation frequency represents an average mutational frequency ≥10 mutations per Mb per sample. b, Differential methylation (comparing mCRPC (adenocarcinoma) to benign prostate) compared to mutational frequency (excluding 2 hyper-mutated samples), N=98. Each point represents a fixed 1Mbp window of the genome, and all points collectively represent all 1 Mb windows across the genome excluding centromeres and telomeres. c, Average differential methylation values across all sites identified from publicly available ChIP-seq data (AR, ERG, FOXA1, HOXB13, H3K27ac). For each ChIP-seq peak, a 20Kbp window centered on midpoint of the peak (x=0) was assessed for differential methylation between mCRPC adenocarcinoma vs. benign prostate samples.

References

    1. Jones PA & Baylin SB The fundamental role of epigenetic events in cancer. Nat Rev Genet 3, 415–28 (2002). - PubMed
    1. Feinberg AP, Koldobskiy MA & Gondor A Epigenetic modulators, modifiers and mediators in cancer aetiology and progression. Nat Rev Genet 17, 284–99 (2016). - PMC - PubMed
    1. Okano M, Bell DW, Haber DA & Li E DNA methyltransferases Dnmt3a and Dnmt3b are essential for de novo methylation and mammalian development. Cell 99, 247–57 (1999). - PubMed
    1. Rechache NS et al. DNA methylation profiling identifies global methylation differences and markers of adrenocortical tumors. J Clin Endocrinol Metab 97, E1004–13 (2012). - PMC - PubMed
    1. Skvortsova K et al. DNA Hypermethylation Encroachment at CpG Island Borders in Cancer Is Predisposed by H3K4 Monomethylation Patterns. Cancer Cell 35, 297–314 e8 (2019). - PubMed

Publication types