. 2020 Aug;17(8):852-860.
doi: 10.1038/s41592-020-0889-6. Epub 2020 Jul 13.

Novel NanoLuc substrates enable bright two-population bioluminescence imaging in animals

Affiliations

Novel NanoLuc substrates enable bright two-population bioluminescence imaging in animals

Yichi Su et al. Nat Methods. 2020 Aug.

Abstract

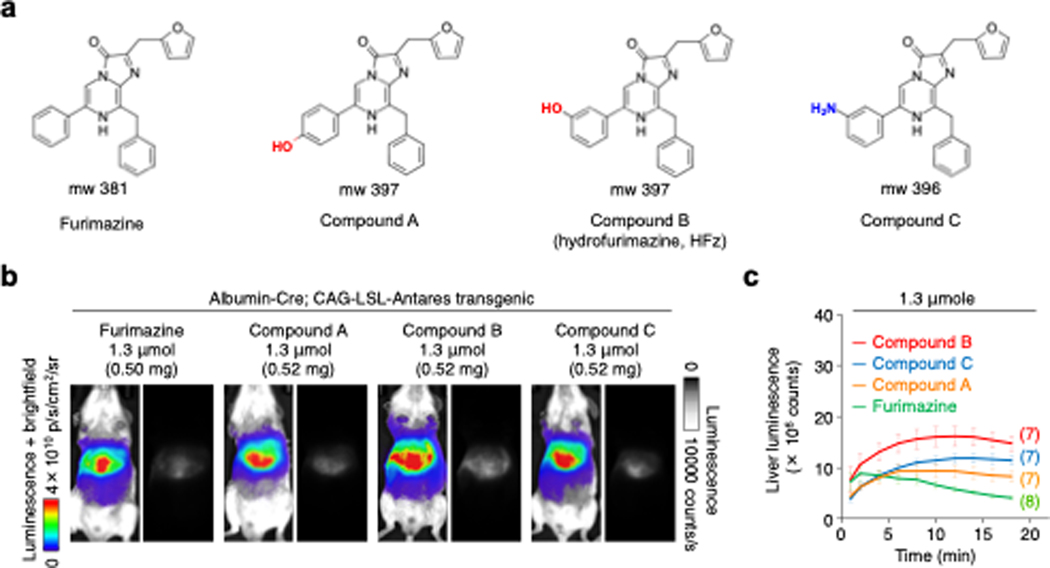
Sensitive detection of two biological events in vivo has long been a goal in bioluminescence imaging. Antares, a fusion of the luciferase NanoLuc to the orange fluorescent protein CyOFP, has emerged as a bright bioluminescent reporter with orthogonal substrate specificity to firefly luciferase (FLuc) and its derivatives such as AkaLuc. However, the brightness of Antares in mice is limited by the poor solubility and bioavailability of the NanoLuc substrate furimazine. Here, we report a new substrate, hydrofurimazine, whose enhanced aqueous solubility allows delivery of higher doses to mice. In the liver, Antares with hydrofurimazine exhibited similar brightness to AkaLuc with its substrate AkaLumine. Further chemical exploration generated a second substrate, fluorofurimazine, with even higher brightness in vivo. We used Antares with fluorofurimazine to track tumor size and AkaLuc with AkaLumine to visualize CAR-T cells within the same mice, demonstrating the ability to perform two-population imaging with these two luciferase systems.


Figures

Extended Data Fig. 1 |
Extended Data Fig. 1 |. In vitro characterization of novel furimazine analogs.
(a) Solubility of furimazine analogs at various concentrations in 35% PEG-300, 10% ethanol, 10% glycerol and 10% hydroxypropylcyclodextrin. Images were taken in ambient light, except for the right image of compound A at 28 mM, which was taken under backlit conditions to more clearly show an insoluble pellet. The experiment was repeated independently two times with similar results. (b) Spectral profiles of Antares with furimazine and analogues. The experiment was repeated independently two times with similar results. (c) Determination of kinetic parameters of relative kcat and absolute KM for Antares with each substrate. As the same concentration of purified Antares was used with each substrate, kcat relative to furimazine can be calculated from the relative asymptotic luminescence (Vmax) values. Error bars, standard error of the mean (s.e.m.). N = 3. (d) Decay of signal over time of Antares signal with furimazine substrates. The experiment was repeated independently two times with similar results. (e) Stability of furimazine substrates at 37°C in the presence and absence of 10% FBS. Colored bars, mean of three biological replicates. Gray dots, individual values. Error bars, standard error of the mean (s.e.m.). P values, two-tailed Welch’s t test. Asterisks, statistically significant differences indicated by P < 0.0167 (for an overall alpha level of 0.05 for three comparisons by the Bonferroni method).
Extended Data Fig. 2 |
Extended Data Fig. 2 |. Comparing in vivo brightness of Antares with furimazine to new substrates.
Bioluminescence imaging was performed in mice doubly hemizygous for Albumine-cre (a-b) or nestin-Cre (c-f) and CAG-loxP-stop-loxP-Antares (CAG-LSL-Antares) genes, which express Antares protein in the liver or kidney. For liver imaging (a-b), 4.2 μmol or 13.3 μmol of each substrate was injected intraperitoneally (a), with quantitation of the mean bioluminescence intensity over time shown (b). Similarly, for kidney imaging (c-f), 1.3 μmol (c-d) or 4.2 μmol (e-f) of each substrate was injected intraperitoneally. Exposure = 1 s, binning = 1, f-stop = 8. Error bars, standard error of the mean (s.e.m.). Numbers of mice are indicated in parentheses.
Extended Data Fig. 3 |
Extended Data Fig. 3 |. Individual bioluminescence traces of luciferase-luciferin pairs in deep tissues of live mice.
Traces of bioluminescence in the liver for each hydrodynamically transfected mouse for Antares + HFz (n = 10), Antares2 + DTZ (n = 6), LumiScarlet + 8pyDTZ (n = 7) and AkaLuc + AkaLumine (n = 11) Black traces and arrows indicate mice and timepoints in Fig. 2a.
Extended Data Fig. 4 |
Extended Data Fig. 4 |. Characterization of HFz in a P-407-based formulation.
(a) 4.2 μmol (1.7 mg) of HFz and 11.1 mg P-407 can be dissolved in ethanol, evaporated, redissolved in water, and lyophilized to create a lyophilized cake (top). 480 μL of water can then be added to resolubilize the HFz and P-407 (bottom). (b) Sections of lung, liver, and kidney show no signs of toxicity following administration of P-407 alone or P-407 with HFz. Mice received three daily intraperitoneal injections of 12 mg P-407 in 480 μL of water or of 12 mg P-407 and 1.7 mg HFz in 480 μL of water, then were sacrificed on the fourth day. Organs were fixed in formalin, embedded in paraffin, sectioned, de-paraffinized, and stained with hematoxylin and eosin. (c) Comparison of bioluminescence intensity and persistence in vivo between the published PEG-300-based formulation and a P-407-based extended-release formulation of HFz (compound B). (d) Mean bioluminescence intensity over time for the injected formulations. Error bars, standard error of the mean (s.e.m.). Numbers of mice are indicated in parentheses.
Extended Data Fig. 5 |
Extended Data Fig. 5 |. In vitro characterization of novel fluorinated furimazine analogs.
(a) Spectral profiles of Antares with fluorinated furimazine analogues. The experiment was repeated independently two times with similar results. (b) Decay of signal over time of Antares signal with furimazine substrates. The experiment was repeated independently two times with similar results. (c) Stability of furimazine substrates at 37°C in the presence and absence of 10% FBS. Colored bars, mean of three biological replicates. Gray dots, individual values. Error bars, standard error of the mean (s.e.m.). P values, two-tailed Welch’s t test. Asterisks, statistically significant differences indicated by P < 0.0167 (overall alpha level of 0.05 for three comparisons by the Bonferroni method). (d) Solubility of fluorinated furimazine analogs at various concentrations in an aqueous formulation containing 35% PEG-300, 10% ethanol, 10% glycerol and 10% hydroxypropylcyclodextrin, or a formulation containing 12 mg P-407 in 0.5 mL water. The experiment was repeated independently two times with similar results.
Extended Data Fig. 6 |
Extended Data Fig. 6 |. Establishing optimal dosage and vehicle for FFz administration in mice.
(a) Mean bioluminescence intensity over time for bioluminescence imaging results in mice doubly hemizygous for albumin-Cre and CAG-loxP-stop-loxP-Antares or luc2 (CAG-LSL-Antares or FLuc) genes, which express Antares or FLuc protein in the liver, and injected with indicated amount of luciferins to establish saturating dosage for each luciferin (b) Mean bioluminescence intensity over time for comparing the effects of formulation on fluorofurimazine (FFz). Error bars, standard error of the mean (s.e.m.). Numbers of mice are indicated in parentheses. (c) Renal and hepatic histologic lesions are most severe in mice receiving FFz (4.2 µmol) following 3 days of intraperitoneal administration. Mice receiving FFz (4.2 µmol) exhibited renal tubular degeneration (white arrow), renal tubular dilation (asterisks), and hepatic capsular degeneration with neutrophilic infiltrates (black arrows). Renal and hepatic lesions were minimal to absent in mice receiving compound FFz (1.3 µmol) or vehicle (P407) alone. No lesions were noted in the lungs across any groups. Hematoxylin and eosin, scale bar = 20 µm. The experiment was repeated independently three times with similar results.
Extended Data Fig. 7 |
Extended Data Fig. 7 |. Details of background and signal comparisons.
To assess background luminescence for furimazine, HFz, FFz, AkaLumine, or D-luciferin mice, lacking luciferase genes were injected with indicated substrate amounts. (a) No luminescence was observed for all substrates with low-sensitivity imaging settings (exposure = 1 s, binning = 1, f-stop = 8). The experiment was repeated independently two times with similar results. (b) With high-sensitivity settings (exposure = 60 s, Binning = 2, f-stop = 1.2), only low signals at injection sites were observed for furimazine and furimazine derivatives, while clear liver signal was observed with AkaLumine. The experiment was repeated independently two times with similar results. (c) Traces of bioluminescence in the liver for each hydrodynamically transfected mouse for AkaLuc + AkaLumine (n = 8) and Antares + FFz (n = 7). Black traces and arrows indicate mice and timepoints in Fig. 4a. (d) Mean signal intensity over time from 103 HeLa[Antares-P2A-AkaLuc] cells implanted subcutaneously after injection of FFz or AkaLumine. Note the slower kinetics compared to bioluminescence time courses in the liver. This can be explained by lack of vascularization of the implanted HeLa cells, which were imaged within 24 h of implantation. Note AkaLumine signals have reached a plateau whereas FFz signals have not at 20 min, so the peak and integrated signals of FFz relative to AkaLumine are likely underestimated. Error bars, s.e.m. Numbers of mice are indicated in parentheses.
Extended Data Fig. 8 |
Extended Data Fig. 8 |. Bioluminescence imaging engrafted luciferase-expressing EW8 tumors in nod scid mice.
(a) Flow cytometry characterization of EW8 cells stably expressing indicated luciferase. Wild-type EW8 cells were lentiviral transduced with indicated constructs, expanded, and then sorted based on CyOFP reporter fluorescence. The experiment was repeated independently two times with similar results. (b) Bioluminescence imaging in nod scid mice engrafted with luciferase-expressing EW8 tumors in one leg (at day 0). 1.3 µmol FFz (0.15 mL in P-407) or 1.5 µmol AkaLumine (0.10 mL in 0.9% saline) were injected IP on the indicated days. (c) Raw grayscale images. Imager settings: Exposure = 2 s (FFz) or 60 s (AkaLumine), binning = 2, f-stop = 1.2.
Extended Data Fig. 9 |
Extended Data Fig. 9 |. Bioluminescence imaging engrafted AkaLuc-expressing MG63.3 tumors in NSG mice.
(a) Flow cytometry characterization of MG63.3 cells stably expressing AkaLuc-P2A-mNeonGreen. Wild-type MG63.3 cells were retroviral transduced with indicated constructs, expanded, and then sorted based on mNeonGreen reporter fluorescence. The experiment was repeated independently two times with similar results. (b) Representative in vivo bioluminescence time course from grafted AkaLuc-expressing MG63.3 tumor after AkaLumine injection. Arrow indicates timepoint used for quantitation. The experiment was repeated independently ten times with similar results. (c) Bioluminescence imaging in NSG mice engrafted with AkaLuc-expressing MG63.3 tumors in one leg (at day 0). 3.0 µmol AkaLumine (0.10 mL in 0.9% saline) were injected IP on the indicated days. (d) Raw grayscale images. Imager settings: Exposure = 1 s, binning = 1, f-stop = 1.2.
Extended Data Figure 10 |
Extended Data Figure 10 |. Dual bioluminescence imaging MG63.3 tumors and non-immune T cells in NSG mice.
(a) Flow cytometry characterization of MG63.3 cells stably expressing Anatares-P2A-mNeonGreen. Wild-type MG63.3 cells were retroviral transduced with indicated constructs, expanded, and then sorted based on mNeonGreen reporter fluorescence. The experiment was repeated independently two times with similar results. (b) Representative in vivo bioluminescence time course from grafted Antares-expressing MG63.3 tumors after FFz injection. Arrow indicates timepoint used for quantitation. The experiment was repeated independently ten times with similar results. (c-d) Raw grayscale images of NSG mice engrafted with Antares-expressing MG63.3 tumors in one leg (at day 0) and intravenously injected with AkaLuc-expressing cells (d) B7-H3 CAR-T (Fig. 5a) or (e) mock CAR-T (native T) cells (Fig. 5b).
Figure 1.
Figure 1.. In vivo screening of novel furimazine analogs.
(a) Structures of bioluminescent substrates. (b) Bioluminescence images of mice doubly hemizygous for albumin-Cre and CAG-loxP-stop-loxP-Antares (CAG-LSL-Antares) genes, which express Antares protein in the liver. Representative results with peak bioluminescence from each substrate injection were shown in two images. Left, linear pseudocolored representations of bioluminescence intensity overlaid on bright-field images, which is the more commonly used display format for bioluminescence in animals. Right, raw grayscale images, allowing intuitive assessment of relative brightness and visualization of anatomical features. This display format, while standard for fluorescence imaging, is rarely used for bioluminescence in animals. Exposure 1 s, binning 1, f-stop 8. (c) Mean bioluminescence intensity over time for each amount of injected substrate. Error bars, standard error of the mean (s.e.m.). Numbers of mice are indicated in parentheses.
Figure 2.
Figure 2.. In vivo characterization and application of compound B (HFz).
(a) Representative results of bioluminescence imaging in J:NU mice hydrodynamically transfected with plasmids encoding Antares, Antares2, LumiScarlet or AkaLuc. Maximal amounts of corresponding luciferins were injected IP. Images from the time point of maximal brightness are displayed with the same intensity scaling. Exposure 1 s, binning 1, f-stop 1.2. (b) Mean signal intensity in the liver over time for luciferase-luciferin systems. Error bars, standard error of the mean (s.e.m.). Numbers of mice are indicated in parentheses. (c) Mean peak signal intensities of the three systems, calculated from the peak intensities of individual mice. (d) Signal persistence, quantified in each mouse as intensity at 20 min divided by peak intensity. (e) Total integrated signal, quantified from the sum of signals from 0 to 20 min for individual mice. (c-e) Error bars, s.e.m. P values, two-tailed Welch’s unpaired t test. Asterisks, statistically significant differences indicated by P values below 0.0167 (for an overall alpha level of 0.05 for three comparisons by the Bonferroni method). (f) Bioluminescence imaging of calcium in mouse liver with Orange CaMBI and extended-release compound B (HFz). Emission from Orange CaMBI in one region of the liver reveals calcium oscillations. Raw luminescence was corrected for substrate decay by fitting to a monoexponential decay curve. (g) Top, bioluminescence images at three time points showing localized changes in CaMBI activity. Below, bioluminescence intensity within two regions as indicated in the bioluminescence images. Arrows indicate the time points corresponding to the three images. Results in (f-g) were repeated independently two times with similar results.
Figure 3.
Figure 3.. In vitro characterization and in vivo screening of novel fluorinated furimazine analogs.
(a) Left, structures of fluorinated furimazine analogues. Right, determination of kinetic parameters of relative kcat and absolute KM for Antares with each substrate. As the same concentration of purified Antares was used with each substrate, kcat relative to furimazine can be calculated from the relative asymptotic luminescence (Vmax) values. Centre values, mean. Error bars, standard error of the mean (s.e.m.). N = 3 independent experiments. (b) Bioluminescence imaging results in mice doubly hemizygous for albumin-Cre and CAG-loxP-stop-loxP-Antares (CAG-LSL-Antares) genes, which express Antares protein in the liver, at 6–8 weeks of age, and injected with indicated amount of fluorinated furimazine analogues. Representative results with peak bioluminescence were shown in two images, with conditions of experiments and data processing same as that of Fig 1b. Exposure 1 s, binning 1, f-stop 8. (c) Mean bioluminescence intensity over time for each amount of injected substrate. Error bars, s.e.m.. Numbers of mice are indicated in parentheses.
Figure 4.
Figure 4.. In vivo characterization and application of fluorofurimazine (FFz).
(a) Background luminescence for the novel substrates, D-luciferin and Akalumine in unshaved white fur coated mice. The experiment was repeated independently two times with similar results. (b) Representative results of bioluminescence imaging in J:NU nude mice hydrodynamically transfected with plasmids encoding Antares or AkaLuc. Maximal amounts of corresponding luciferins were injected IP. Images in each type are displayed with the same intensity scaling and represent the time point of maximal brightness. Exposure 1 s, binning 1, f-stop 1.2. (c) Mean signal intensity in the liver over time for luciferase-luciferin systems. Error bars, standard error of the mean (s.e.m.). Numbers of mice are indicated in parentheses. (d) Left, mean peak signal intensities of each system. Right, Total integrated signal, quantified from the sum of signals from 0 to 20 min for individual mice. Error bars, s.e.m., P values, two-tailed Welch’s t test. (e) In vitro assay of expression of luciferase in transgenic HeLa cell lines. N = 3. (f) Representative results of bioluminescence imaging in J:NU nude mice subcutaneously implanted with 103 HeLa cells stably expressing both Antares and AkaLuc luciferases. Exposure 60 s, binning 2, f-stop 1.2. (g) Left, mean peak signal intensities. Right, total integrated signal, quantified from the sum of signals from 0 to 20 min for individual mice. N = 9. Error bars, s.e.m.. P values, two-sided Welch’s unpaired t test.
Figure 5.
Figure 5.. Dual bioluminescence imaging of tumor xenografts and CAR-T cells in vivo.
(a-b) Bioluminescence imaging in NSG mice engrafted with Antares-expressing MG63.3 tumors in one leg (at day 0) and intravenously injected with AkaLuc-expressing B7-H3 CAR-T cells (a) or native T cells (b) (at day 14). Maximal amounts of individual luciferins were injected IP on the indicated days. (c) Normalized intensities of individual mice. (d), mean signal intensity of tumor over time, normalized to day 9 post tumor cells injection (first time point). N = 5. Error bars, s.e.m.. P value, two-tailed Welch’s unpaired t test.

References

    1. Prescher JA & Contag CH. Guided by the light: visualizing biomolecular processes in living animals with bioluminescence. Current opinion in chemical biology 14, 80–89 (2010). - PubMed
    1. Genevois C, Loiseau H & Couillaud F. In Vivo Follow-up of Brain Tumor Growth via Bioluminescence Imaging and Fluorescence Tomography. Int J Mol Sci 17, (2016). - PMC - PubMed
    1. Levin RA et al. An optimized triple modality reporter for quantitative in vivo tumor imaging and therapy evaluation. PLoS One 9, e97415 (2014). - PMC - PubMed
    1. Contag CH et al. Visualizing gene expression in living mammals using a bioluminescent reporter. Photochemistry and photobiology 66, 523–531 (1997). - PubMed
    1. Iwano S et al. Single-cell bioluminescence imaging of deep tissue in freely moving animals. Science 359, 935–939 (2018). - PubMed

Publication types