. 2018 May 27;123(10):5560-5587.
doi: 10.1029/2018JD028313. Epub 2018 May 4.

Observations of the Interaction and Transport of Fine Mode Aerosols with Cloud and/or Fog in Northeast Asia from Aerosol Robotic Network (AERONET) and Satellite Remote Sensing

Affiliations

Observations of the Interaction and Transport of Fine Mode Aerosols with Cloud and/or Fog in Northeast Asia from Aerosol Robotic Network (AERONET) and Satellite Remote Sensing

T F Eck et al. J Geophys Res Atmos. .

Abstract

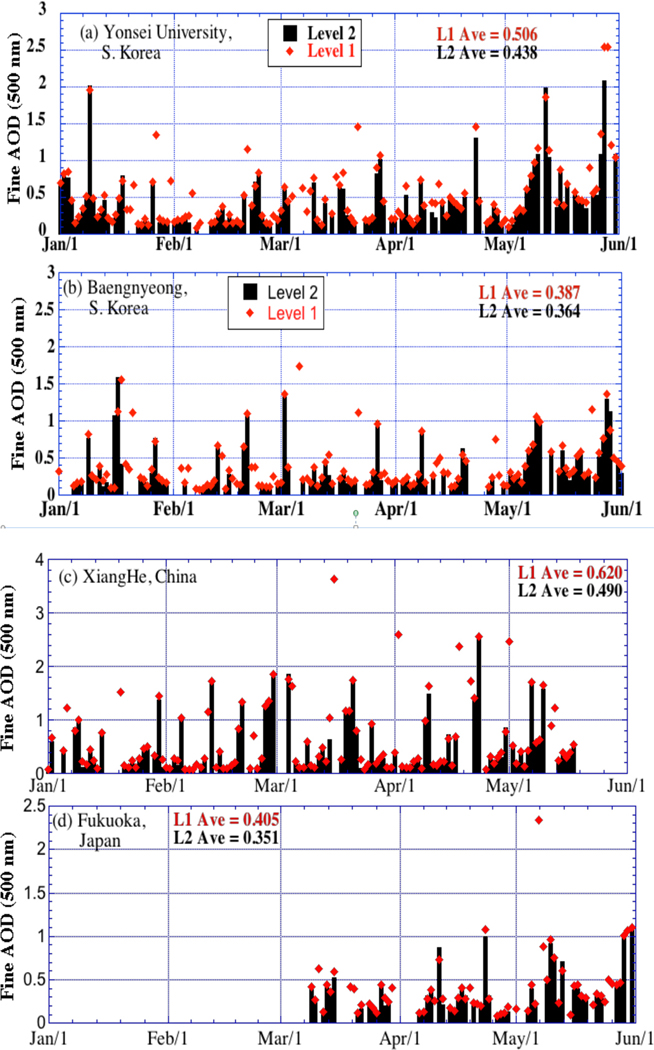
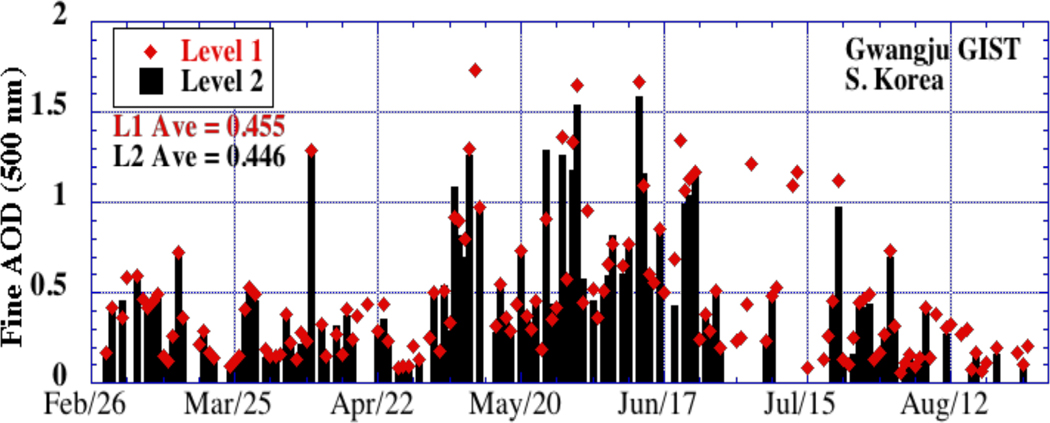
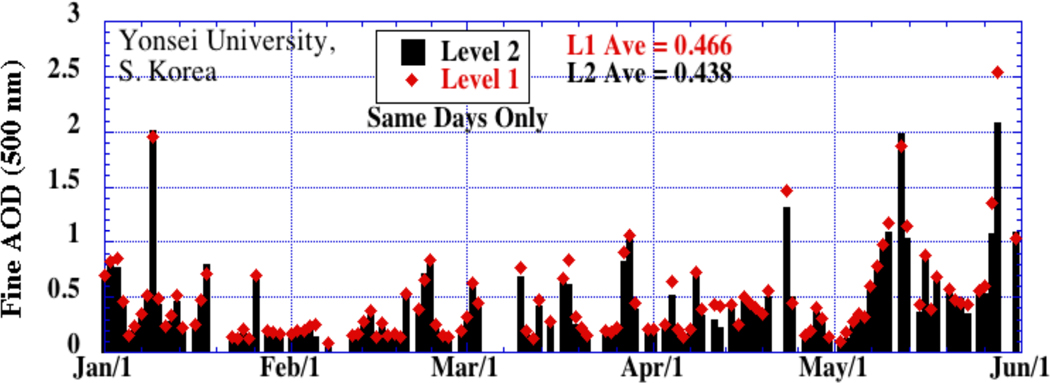
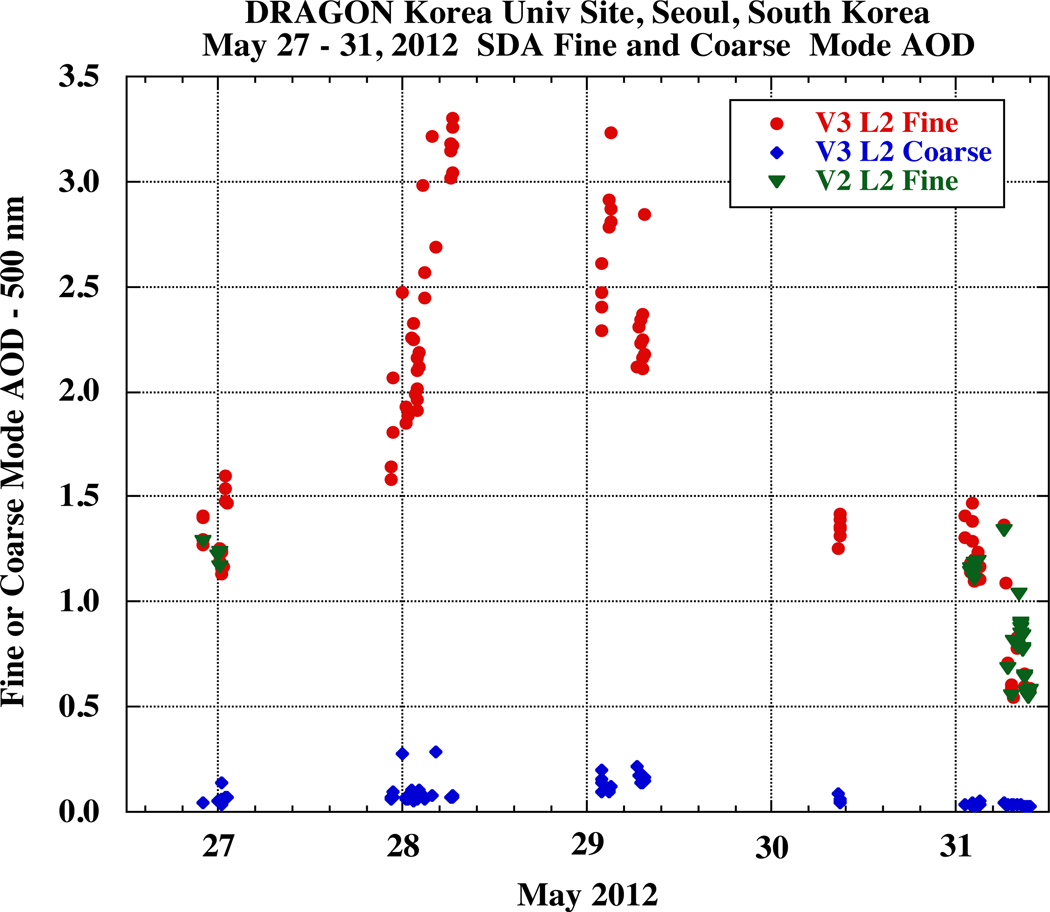
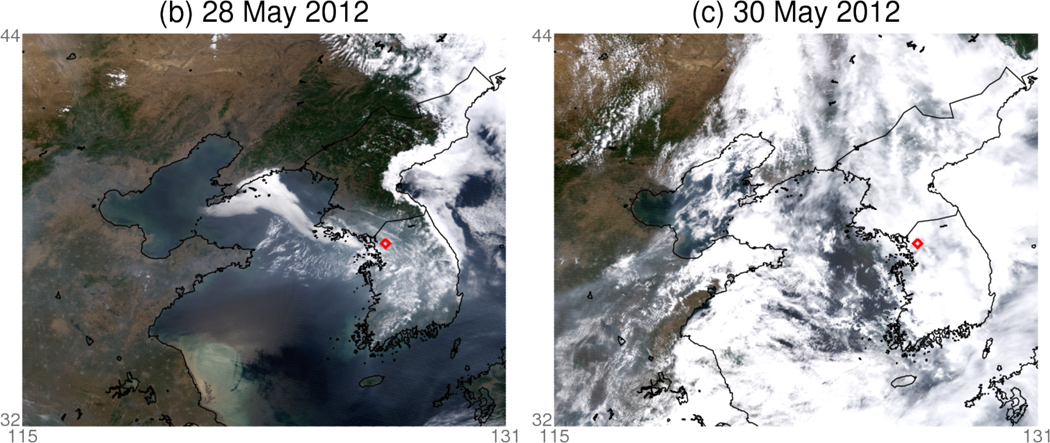
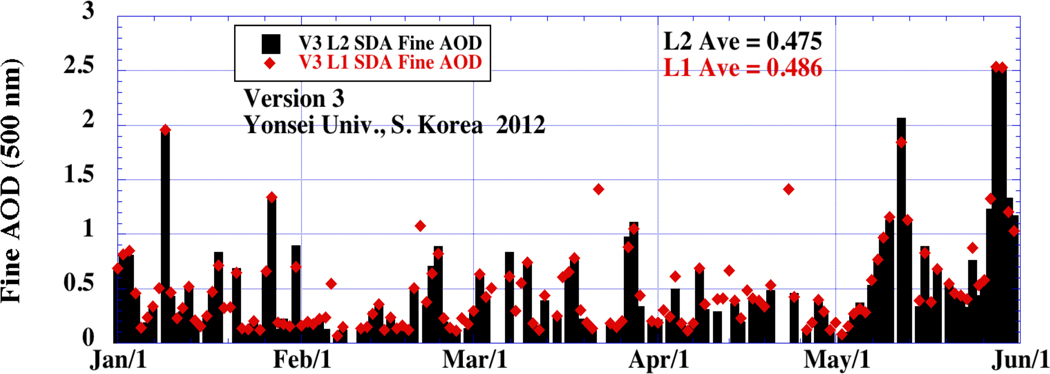
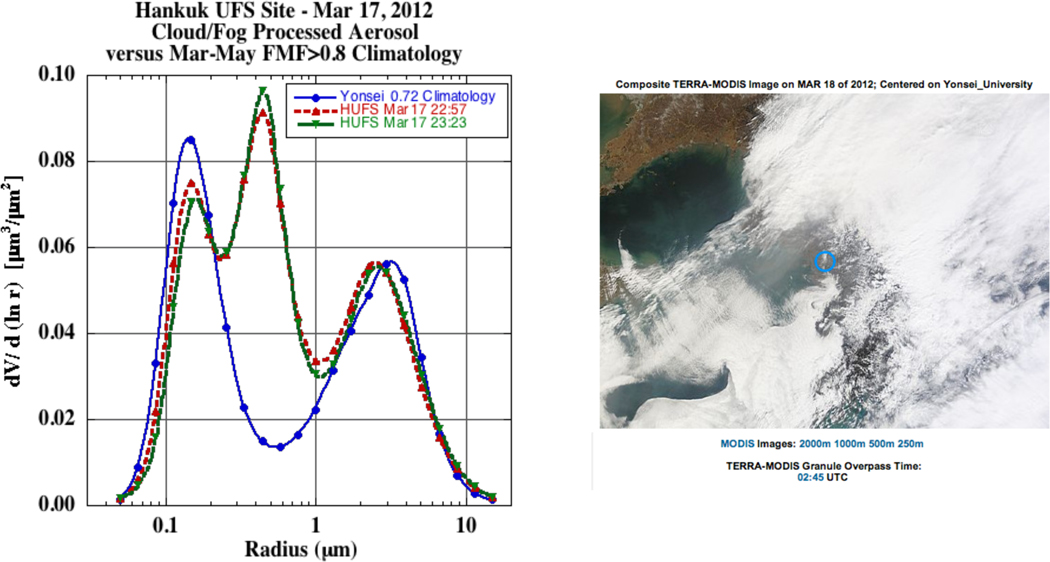
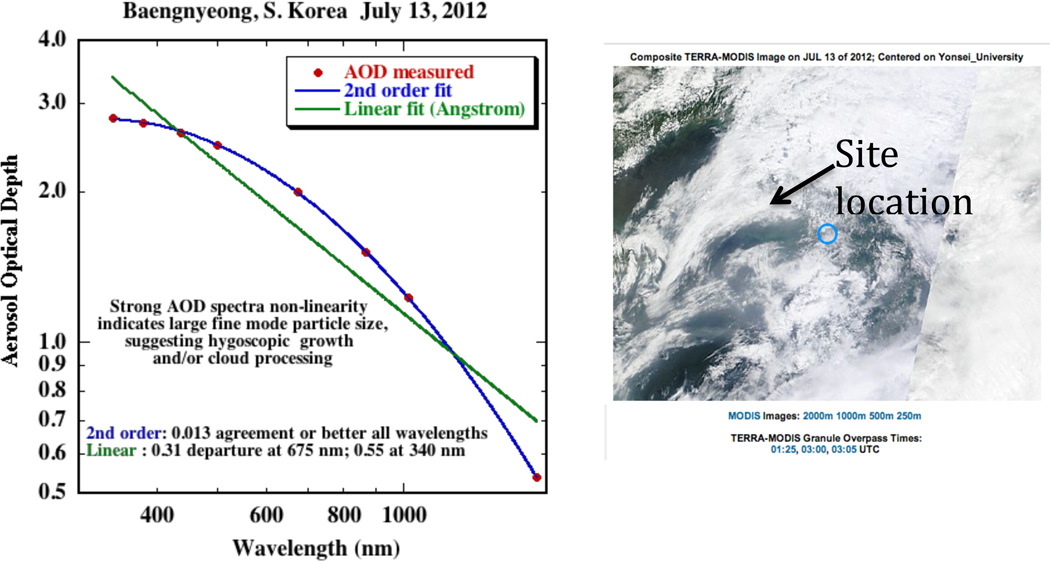
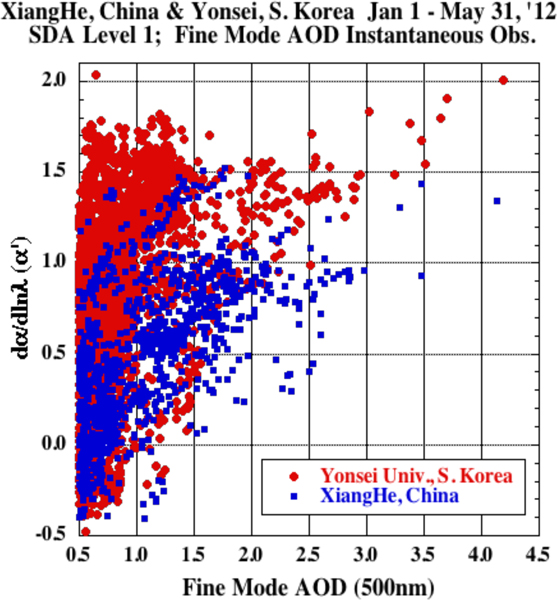
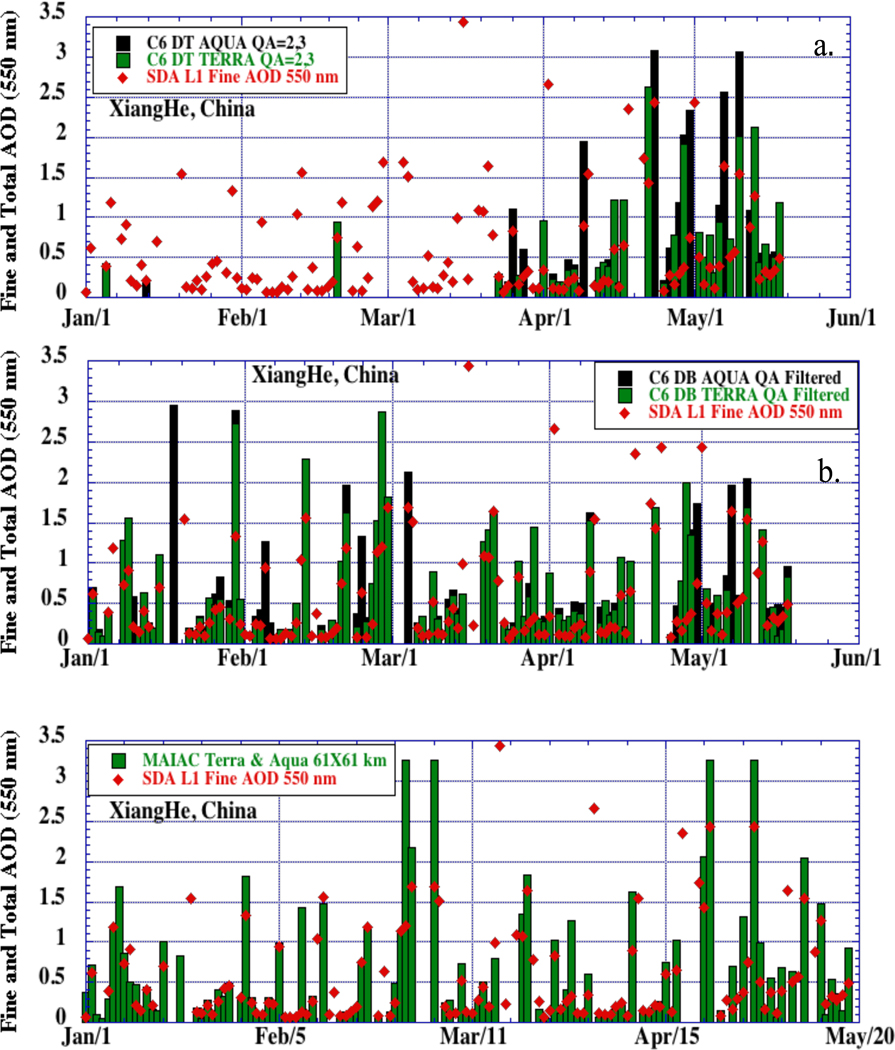
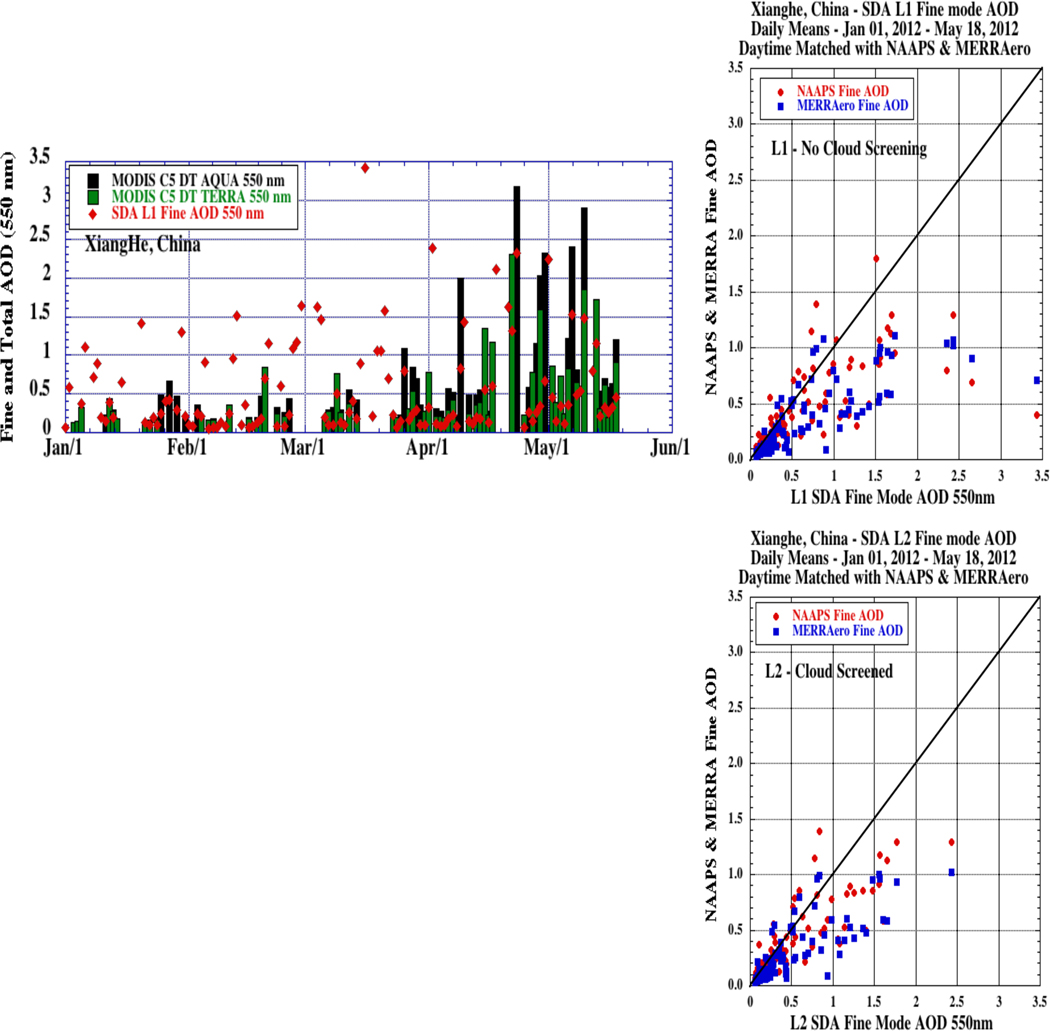
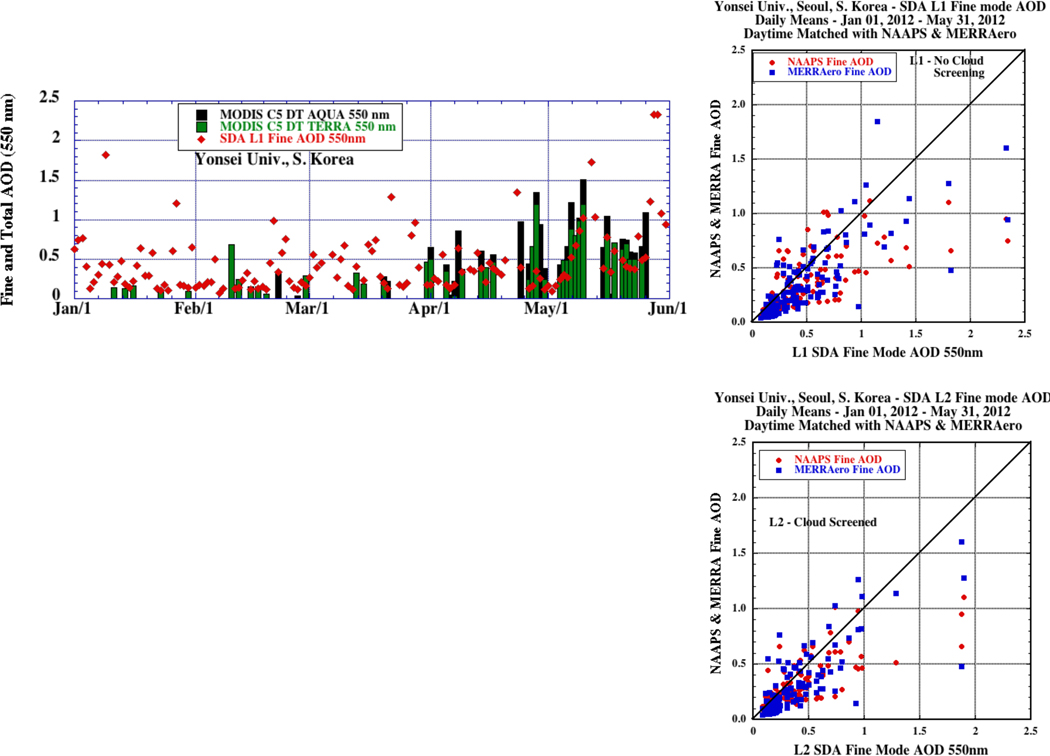
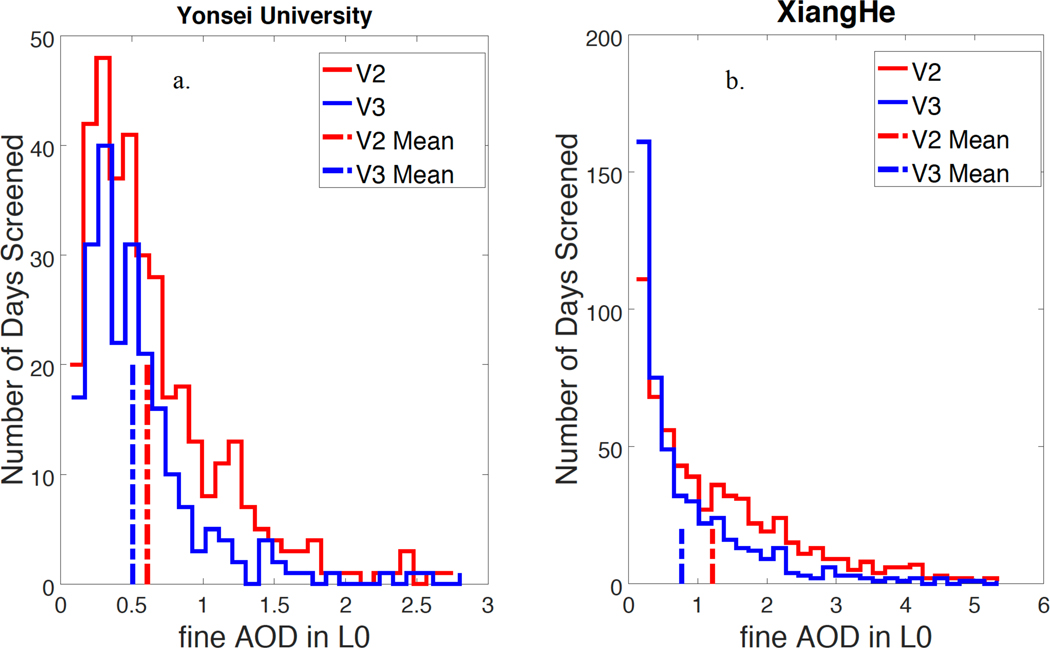
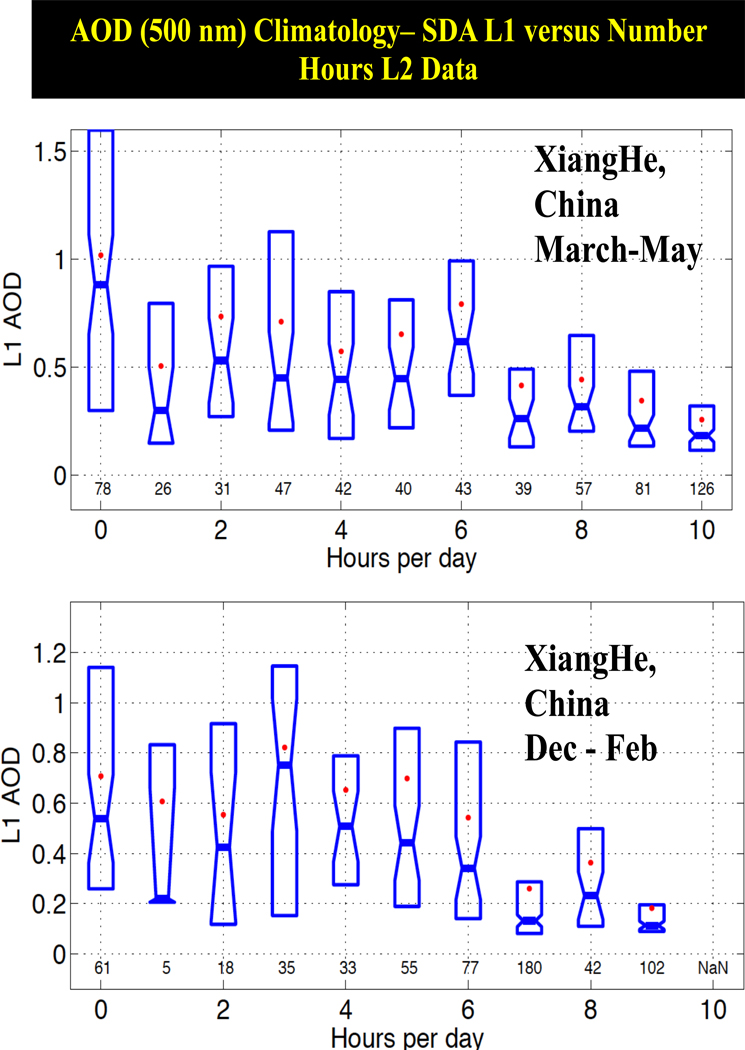
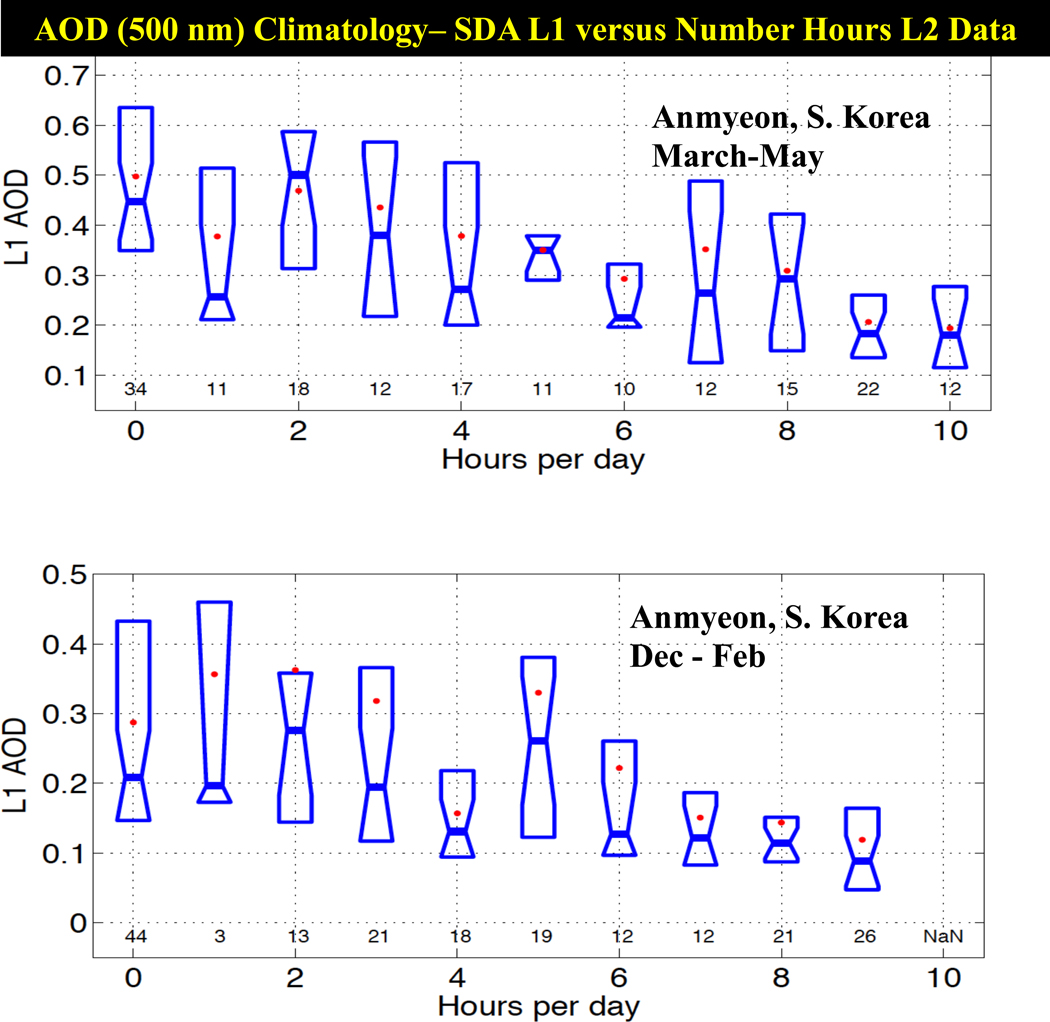
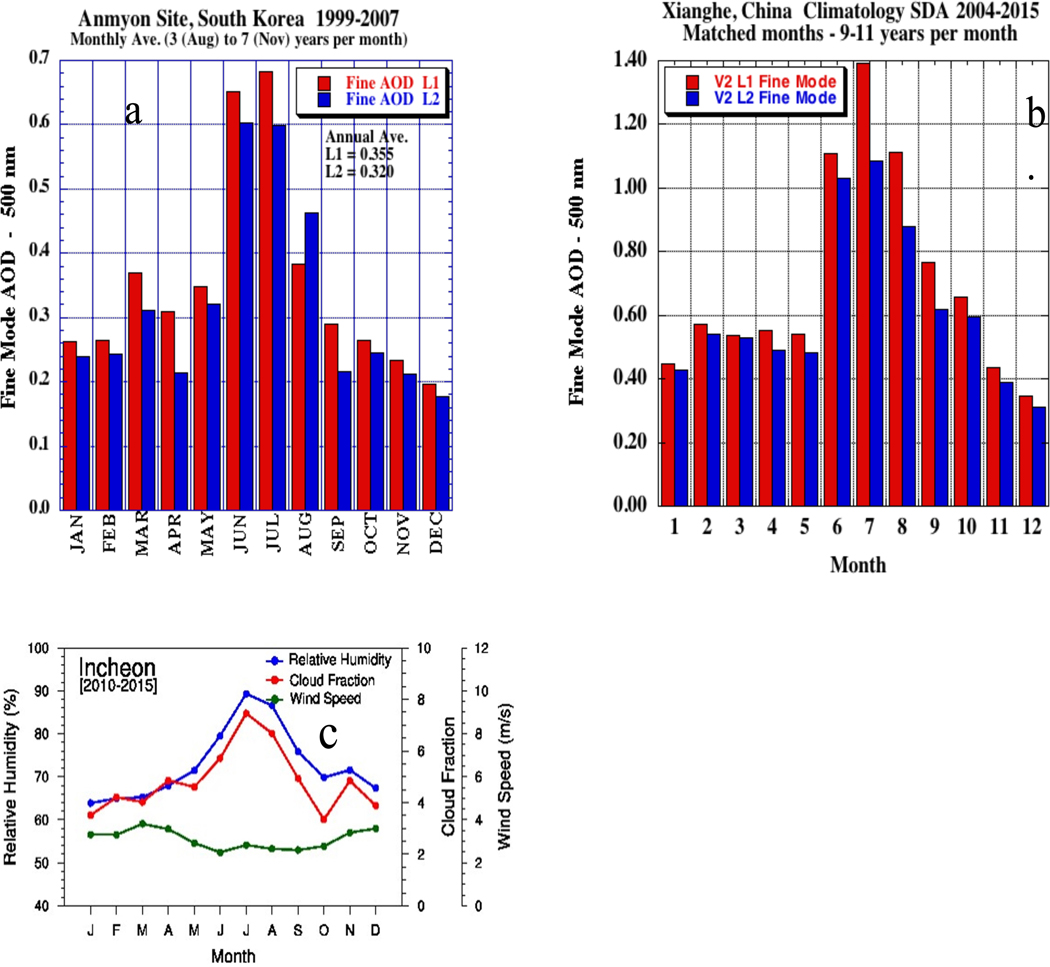
Analysis of sun photometer measured and satellite retrieved aerosol optical depth (AOD) data has shown that major aerosol pollution events with very high fine mode AOD (>1.0 in mid-visible) in the China/Korea/Japan region are often observed to be associated with significant cloud cover. This makes remote sensing of these events difficult even for high temporal resolution sun photometer measurements. Possible physical mechanisms for these events that have high AOD include a combination of aerosol humidification, cloud processing, and meteorological co-variation with atmospheric stability and convergence. The new development of Aerosol Robotic network (AERONET) Version 3 Level 2 AOD with improved cloud screening algorithms now allow for unprecedented ability to monitor these extreme fine mode pollution events. Further, the Spectral Deconvolution Algorithm (SDA) applied to Level 1 data (L1; no cloud screening) provides an even more comprehensive assessment of fine mode AOD than L2 in current and previous data versions. Studying the 2012 winter-summer period, comparisons of AERONET L1 SDA daily average fine mode AOD data showed that Moderate Resolution Imaging Spectroradiometer (MODIS) satellite remote sensing of AOD often did not retrieve and/or identify some of the highest fine mode AOD events in this region. Also, compared to models that include data assimilation of satellite retrieved AOD, the L1 SDA fine mode AOD was significantly higher in magnitude, particularly for the highest AOD events that were often associated with significant cloudiness.

Keywords: 0305 Aerosols and particles; 0345 Pollution: urban and regional; 0360 Radiation: transmission and scattering; 0394 Instruments and techniques.


Figures

Figure 1.
Figure 1.
Time series of daily averages of fine mode AOD at 500 nm (Version 2, V2) retrieved from SDA from January 1 – June 1, 2012 for AERONET sites at (a) Yonsei University, S. Korea (b) Baengnyeong, S. Korea (c) XiangHe, China and d) Fukuoaka, Japan. Note that days with only a red diamond (L1) and no black bar (L2) did not pass V2 Level 2 cloud screening.
Figure 2.
Figure 2.
Similar to Figure 1, the time series of daily averages of fine mode AOD at 500 nm (Version 2) retrieved from SDA for the AERONET site at Gwangju GIST, S. Korea. Note that cloud screening at times removes both high and low AOD days (see before and after July 15, for example), resulting in a similar time series average.
Figure 3.
Figure 3.
Similar to Figure 1, the time series of daily averages of fine mode AOD at 500 nm (Version 2) retrieved from SDA for the AERONET site at Yonsei University, S. Korea, but only showing days that have passed L2 cloud screening.
Figure 4.
Figure 4.
(a) The time series from May 27–31, 2012 of instantaneous values of fine mode AOD at 500 nm retrieved from SDA for the AERONET site at Korea University, in Seoul S. Korea, showing cloud screened Version 2 data (green) plus Version 3 cloud screened fine (red) and coarse (blue) mode AOD. MODIS Terra images for May 28 and May 30 are shown in (b) and (c), with the Korea University site marked by a red diamond.
Figure 4.
Figure 4.
(a) The time series from May 27–31, 2012 of instantaneous values of fine mode AOD at 500 nm retrieved from SDA for the AERONET site at Korea University, in Seoul S. Korea, showing cloud screened Version 2 data (green) plus Version 3 cloud screened fine (red) and coarse (blue) mode AOD. MODIS Terra images for May 28 and May 30 are shown in (b) and (c), with the Korea University site marked by a red diamond.
Figure 5.
Figure 5.
Similar to Figure 1a, the time series of daily averages of fine mode AOD at 500 nm retrieved from SDA for the AERONET site at Yonsei University, S. Korea, but for Version 3 cloud and QA screening.
Figure 6.
Figure 6.
(a.) Almucantar retrievals of aerosol size distributions from AERONET measurements made at the Hankuk UFS site on March 17, 2012, as compared to climatological mean size distributions from the Yonsei University site utilizing 42 retrievals from March through May 2011 and 2012 with average fine mode fraction (440 nm) of 0.88 and AOD(440nm) ranging from 0.6–0.8. (b.) MODIS Terra image from about 4 hours after the Hankuk UFS retrievals shown in (a). The blue circle indicates the Yonsei University site location.
Figure 7.
Figure 7.
(a.) Spectral AOD measurements at the Baengnyeong, S. Korea site on July 13, 2012, with linear and 2nd order regressions in logarithmic coordinates. (b.) MODIS Terra image from about one hour before the Baengnyeong AOD spectra shown in (a). The blue circle indicates the Yonsei University site location and the arrow shows the Baengnyeong site location.
Figure 8.
Figure 8.
Computations of the parameter dα/dlnλ(α’) from instantaneous measurements of AOD made at the Yonsei University and XiangHe AERONET sites from January 1 through May 31, 2012. This parameter is partly indicative of fine mode particle size, but also affected by coarse mode fraction of AOD.
Figure 9.
Figure 9.
Time series of daily averages of AERONET Level 1 fine mode AOD at 550 nm (Version 2) retrieved from SDA from January 1 – June 1, 2012 for the AERONET site at XiangHe, China compared to MODIS Collection 6 satellite retrievals of total AOD from (a) Dark Target, (b) Deep Blue and (c) MAIAC algorithms.
Figure 10 a-c.
Figure 10 a-c.
(a) Time series of daily averages of AERONET Level 1 fine mode AOD at 550 nm (Version 2) retrieved from SDA from January 1 – June 1, 2012 for the AERONET site at XiangHe, China compared to MODIS Collection 5 satellite retrievals of total AOD from the Dark Target algorithm. (b) Scatterplot of NAAPS and MERRAero modeled daytime average fine mode AOD compared to AERONET L1 fine mode AOD daily averages. (c) same as plot (b) but for cloud screened L2 fine mode AOD from SDA.
Figure 10 d-f.
Figure 10 d-f.
(d) Time series of daily averages of AERONET Level 1 fine mode AOD at 550 nm (Version 2) retrieved from SDA from January 1 – June 1, 2012 for the AERONET site at Yonsei University compared to MODIS Collection 5 satellite retrievals of total AOD from the Dark Target algorithm. (e) Scatterplot of NAAPS and MERRAero modeled daytime average fine mode AOD compared to AERONET L1 fine mode AOD daily averages. (f) same as plot (e) but for cloud screened L2 fine mode AOD from SDA.
Figure 11.
Figure 11.
The number of days eliminated (L1-L2=L0) as function of fine AOD bin by combined cloud screening and data quality checks for both AERONET Version 2 data and the new Version 3 database, for the Yonsei University and XiangHe sites.
Figure 12a-d.
Figure 12a-d.
Level 1 (non-cloud screened) fine mode AOD (500 nm) from SDA versus number of hours per day of data that had passed Version 2 cloud screening (Level 2). Zero hours means that none of the L1 data passed the V2 cloud screening. The pinch point on the blue bars are the medians, the upper and lower limits of the blue bars represent the 75th and 25th percentiles. The red dots are the hourly means, and the numbers above the x-axis are the number of days of data for each hour-interval bin. Figures 12 a and b show climatological data for the XiangHe site for Spring and Winter seasons respectively, while Figures 12 c and d show the same for Anmyon.
Figure 12a-d.
Figure 12a-d.
Level 1 (non-cloud screened) fine mode AOD (500 nm) from SDA versus number of hours per day of data that had passed Version 2 cloud screening (Level 2). Zero hours means that none of the L1 data passed the V2 cloud screening. The pinch point on the blue bars are the medians, the upper and lower limits of the blue bars represent the 75th and 25th percentiles. The red dots are the hourly means, and the numbers above the x-axis are the number of days of data for each hour-interval bin. Figures 12 a and b show climatological data for the XiangHe site for Spring and Winter seasons respectively, while Figures 12 c and d show the same for Anmyon.
Figure 13
Figure 13
(a.) Multi-year monthly mean fine mode AOD (500 nm; Version 2) from SDA, comparing cloud-screened (L2) to non cloud-screened (L1) data for the Anmyon site in S. Korea. (b.) Same as in a. but for the climatological means at the Xianghe site in China. (c.) Multi-year averages of cloud fraction, relative humidity and wind speed at the Inchon, S. Korea site ~110 km north of the Anmyon site.
Figure 13
Figure 13
(d.) Multi-year monthly mean fine mode AOD (500 nm) from SDA, comparing cloud-screened (L2) data from Version 2 to the newer Version 3 for the Xianghe site in China. (e.) Monthly means of the fine mode fraction of AOD (500 nm) comparing results from Version 2 to Version 3. (f.) Multi-year monthly mean fine mode and coarse mode AOD (500 nm) from SDA, from Version 2 cloud-screened (L2) data for the Xianghe site in China.

References

    1. Albrecht BA (1989), Aerosols, cloud microphysics, and fractional cloudiness, Science, 245 (4923), 1227–1230. - PubMed
    1. Arola A, Eck TF, Kokkola H, Pitkänen MRA, and Romakkaniemi S (2017), Assessment of cloud-related fine-mode AOD enhancements based on AERONET SDA product, Atmos. Chem. Phys, 17, 5991–6001, doi:10.5194/acp-17-5991-2017. - DOI
    1. Buchard V, et al. (2015), Using the OMI aerosol index and absorption aerosol optical depth to evaluate the NASA MERRA Aerosol Reanalysis, Atmos. Chem. Phys, 15, 5743–5760, doi:10.5194/acp-15-5743-2015 - DOI
    1. Buchard V, et al. (2016), Evaluation of the surface PM 2.5 in version 1 of the NASA MERRA Aerosol Reanalysis over the United States. Atmos. Environ, 125, 100–111, doi:10.1016/j.atmosenv.2015.11.004 - DOI
    1. Buchard V, Randles CA, da Silva AM, Darmenov A, Colarco PR, Govindaraju R, Ferrare R, Hair J, Beyersdorf AJ, Ziemba LD, and Yu H (2017), The MERRA-2 Aerosol Reanalysis, 1980 Onward. Part II: Evaluation and Case Studies, Journal of Climate, Vol. 30, No. 17. - PMC - PubMed

LinkOut - more resources