Observational Study
. 2020 Oct;40(7):960-969.
doi: 10.1007/s10875-020-00821-7. Epub 2020 Jul 13.

Prediction Model Based on the Combination of Cytokines and Lymphocyte Subsets for Prognosis of SARS-CoV-2 Infection

Affiliations
Observational Study

Prediction Model Based on the Combination of Cytokines and Lymphocyte Subsets for Prognosis of SARS-CoV-2 Infection

Ying Luo et al. J Clin Immunol. 2020 Oct.

Abstract

Background: There are currently rare satisfactory markers for predicting the death of patients with coronavirus disease 2019 (COVID-19). The aim of this study is to establish a model based on the combination of serum cytokines and lymphocyte subsets for predicting the prognosis of the disease.

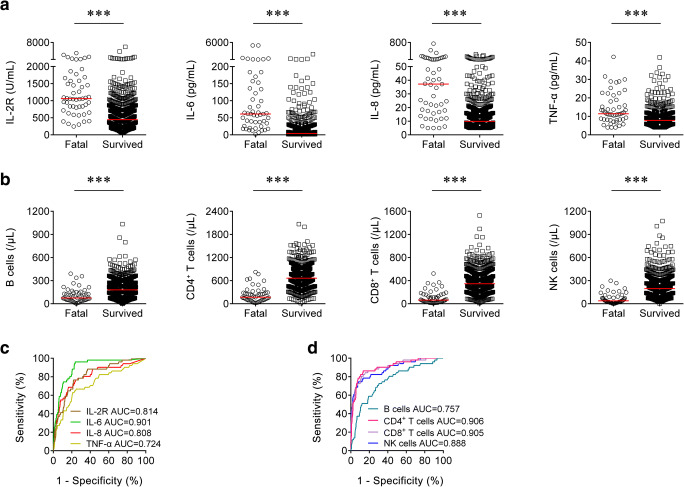
Methods: A total of 739 participants with COVID-19 were enrolled at Tongji Hospital from February to April 2020 and classified into fatal (n = 51) and survived (n = 688) groups according to the patient's outcome. Cytokine profile and lymphocyte subset analysis was performed simultaneously.

Results: The fatal patients exhibited a significant lower number of lymphocytes including B cells, CD4+ T cells, CD8+ T cells, and NK cells and remarkably higher concentrations of cytokines including interleukin-2 receptor, interleukin-6, interleukin-8, and tumor necrosis factor-α on admission compared with the survived subjects. A model based on the combination of interleukin-8 and the numbers of CD4+ T cells and NK cells showed a good performance in predicting the death of patients with COVID-19. When the threshold of 0.075 was used, the sensitivity and specificity of the prediction model were 90.20% and 90.26%, respectively. Meanwhile, interleukin-8 was found to have a potential value in predicting the length of hospital stay until death.

Conclusions: Significant increase of cytokines and decrease of lymphocyte subsets are found positively correlated with in-hospital death. A model based on the combination of three markers provides an attractive approach to predict the prognosis of COVID-19.

Keywords: Coronavirus disease 2019; cytokines; lymphocyte subsets; prognosis; severe acute respiratory syndrome coronavirus 2.


Conflict of interest statement

The authors declare that they have no conflict of interest.

Figures

Fig. 1
Fig. 1
Using cytokines and lymphocyte subsets on admission for discriminating the fatal cases from the survived patients. a Scatter plots showing the levels of IL-2R, IL-6, IL-8, and TNF-α in the fatal cases (n = 51) and the survived patients (n = 688). Horizontal lines indicate the median. ***P < 0.001 (Mann-Whitney U test). b Scatter plots showing the numbers of B cells, CD4+ T cells, CD8+ T cells, and NK cells in the fatal cases (n = 51) and the survived patients (n = 688). Horizontal lines indicate the median. ***P < 0.001 (Mann-Whitney U test). c ROC analysis showing the performance of IL-2R, IL-6, IL-8, and TNF-α in distinguishing the fatal cases from the survived patients. d ROC analysis showing the performance of B cells, CD4+ T cells, CD8+ T cells, and NK cells in distinguishing the fatal cases from the survived patients. IL-2, interleukin-2 receptor; IL-6, interleukin-6; IL-8, interleukin-8; TNF-α, tumor necrosis factor-α; ROC, receiver operating characteristic curve; AUC, area under the curve
Fig. 2
Fig. 2
Change of cytokines and lymphocyte subsets in the same patients. a Line graphs showing the levels of IL-2R, IL-6, IL-8, and TNF-α for each fatal patient on admission and death (n = 42). One line represents one patient. ***P < 0.001 (Wilcoxon’s test). b Line graphs showing the numbers of B cells, CD4+ T cells, CD8+ T cells, and NK cells for each fatal patient on admission and death (n = 16). One line represents one patient. *P < 0.05, **P < 0.01, ***P < 0.001 (Wilcoxon’s test). c Line graphs showing the levels of IL-2R, IL-6, IL-8, and TNF-α for each survived patient on admission and discharge (n = 86). One line represents one patient. *P < 0.05, **P < 0.01, ***P < 0.001 (Wilcoxon’s test). d Line graphs showing the numbers of B cells, CD4+ T cells, CD8+ T cells, and NK cells for each survived patient on admission and discharge (n = 62). One line represents one patient. **P < 0.01, ***P < 0.001 (Wilcoxon’s test). IL-2, interleukin-2 receptor; IL-6, interleukin-6; IL-8, interleukin-8; TNF-α, tumor necrosis factor-α
Fig. 3
Fig. 3
Correlation between cytokines and lymphocyte subsets on admission and days from hospital admission to death in the fatal patients. a Correlation between the levels of IL-2R, IL-6, IL-8, and TNF-α and days from admission onset to death (n = 51). b Correlation between the numbers of B cells, CD4+ T cells, CD8+ T cells, and NK cells and days from admission onset to death (n = 51). Each symbol represents an individual fatal patient. *Days from admission onset to death. IL-2, interleukin-2 receptor; IL-6, interleukin-6; IL-8, interleukin-8; TNF-α, tumor necrosis factor-α
Fig. 4
Fig. 4
Establishment of prediction model for prognosis of SARS-CoV-2 infection based on combination of cytokines and lymphocyte subsets. a Scatter plots showing the score of prediction model in the fatal cases (n = 51) and the survived patients (n = 688). Horizontal lines indicate the median. ***P < 0.001 (the Mann-Whitney U test). Blue dotted lines indicate the cutoff value in distinguishing these two groups. b ROC analysis showing the performance of prediction model in distinguishing the fatal cases from the survived patients. ROC, receiver operating characteristic curve; AUC, area under the curve

References

    1. Wu F, Zhao S, Yu B, Chen YM, Wang W, Song ZG, Hu Y, Tao ZW, Tian JH, Pei YY, Yuan ML, Zhang YL, Dai FH, Liu Y, Wang QM, Zheng JJ, Xu L, Holmes EC, Zhang YZ. A new coronavirus associated with human respiratory disease in China. Nature. 2020;579:265–269. doi: 10.1038/s41586-020-2008-3. - DOI - PMC - PubMed
    1. World Health Organization, Novel coronavirus (2019-ncov) situation report 103. Available online:https://www.who.int/emergencies/diseases/novel-coronavirus-2019/situatio... (accessed on 3 May 2020).
    1. Gralinski LE, Menachery VD. Return of the Coronavirus: 2019-nCoV. Viruses. 2020;12(2). - PMC - PubMed
    1. Wu C, Chen X, Cai Y, Xia J, Zhou X, Xu S, et al. Risk factors associated with acute respiratory distress syndrome and death in patients with coronavirus disease 2019 pneumonia in Wuhan, China. JAMA Intern Med. 2020. - PMC - PubMed
    1. Yuan M, Yin W, Tao Z, Tan W, Hu Y, et al. Association of radiologic findings with mortality of patients infected with 2019 novel coronavirus in Wuhan, China. PLoS One. 2020;15(3):e0230548. doi: 10.1371/journal.pone.0230548. - DOI - PMC - PubMed

Publication types

MeSH terms