

Clinical, radiological, and laboratory characteristics and risk factors for severity and mortality of 289 hospitalized COVID-19 patients
- PMID: 32662525
- PMCID: PMC7404752
- DOI: 10.1111/all.14496
Clinical, radiological, and laboratory characteristics and risk factors for severity and mortality of 289 hospitalized COVID-19 patients
Abstract
Background: The coronavirus disease 2019 (COVID-19) has become a global pandemic, with 10%-20% of severe cases and over 508 000 deaths worldwide.
Objective: This study aims to address the risk factors associated with the severity of COVID-19 patients and the mortality of severe patients.
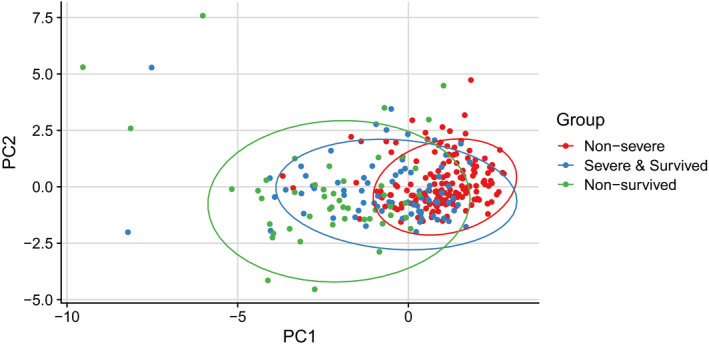
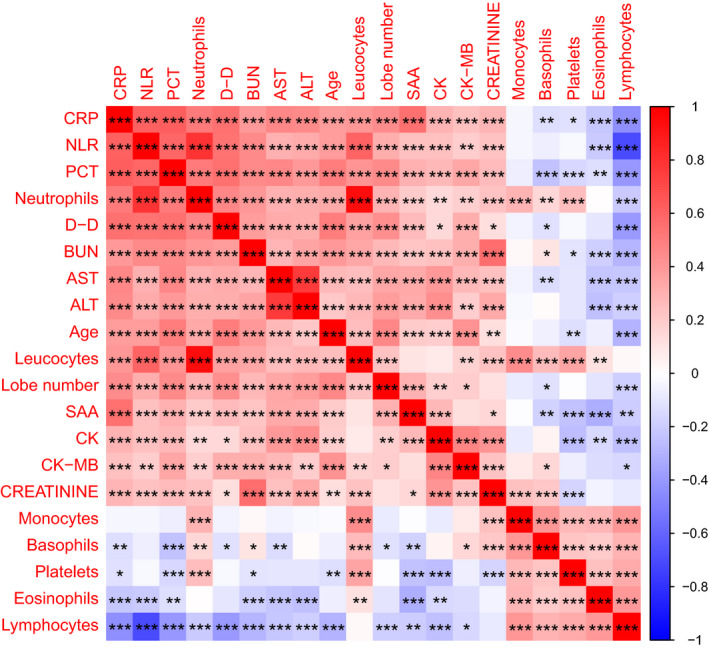
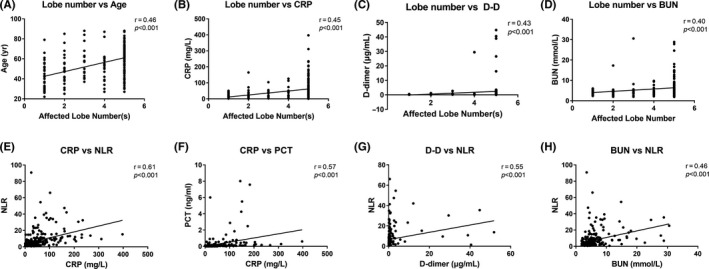
Methods: 289 hospitalized laboratory-confirmed COVID-19 patients were included in this study. Electronic medical records, including patient demographics, clinical manifestation, comorbidities, laboratory tests results, and radiological materials, were collected and analyzed. According to the severity and outcomes of the patients, they were divided into three groups: nonsurvived (n = 49), survived severe (n = 78), and nonsevere (n = 162) groups. Clinical, laboratory, and radiological data were compared among these groups. Principal component analysis (PCA) was applied to reduce the dimensionality and visualize the patients on a low-dimensional space. Correlations between clinical, radiological, and laboratory parameters were investigated. Univariate and multivariate logistic regression methods were used to determine the risk factors associated with mortality in severe patients. Longitudinal changes of laboratory findings of survived severe cases and nonsurvived cases during hospital stay were also collected.
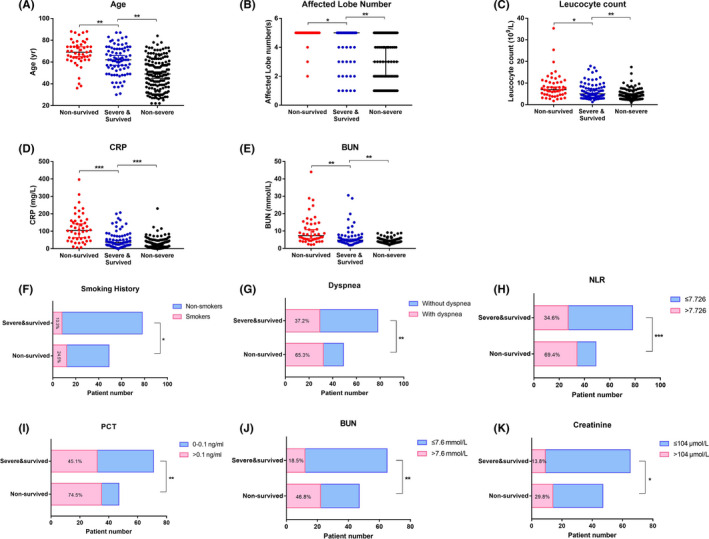
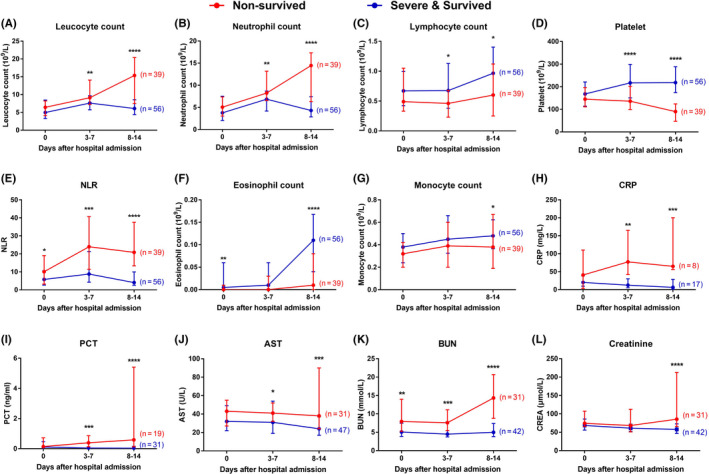
Results: Of the 289 patients, the median age was 57 years (range, 22-88) and 155 (53.4%) patients were male. As of the final follow-up date of this study, 240 (83.0%) patients were discharged from the hospital and 49 (17.0%) patients died. Elder age, underlying comorbidities, and increased laboratory variables, such as leukocyte count, neutrophil count, neutrophil-to-lymphocyte ratio (NLR), C-reactive protein (CRP), procalcitonin (PCT), D-dimer, alanine aminotransferase (ALT), aspartate aminotransferase (AST), and blood urea nitrogen (BUN) on admission, were found in survived severe cases compared to nonsevere cases. According to the multivariate logistic regression analysis, elder age, a higher number of affected lobes, elevated CRP levels on admission, increased prevalence of chest tightness/dyspnea, and smoking history were independent risk factors for death of severe patients. A trajectory in PCA was observed from "nonsevere" toward "nonsurvived" via "severe and survived" patients. Strong correlations between the age of patients, the affected lobe numbers, and laboratory variables were identified. Dynamic changes of laboratory findings of survived severe cases and nonsurvived cases during hospital stay showed that continuing increase of leukocytes and neutrophil count, sustained lymphopenia and eosinopenia, progressing decrease in platelet count, as well as high levels of NLR, CRP, PCT, AST, BUN, and serum creatinine were associated with in-hospital death.
Conclusions: Survived severe and nonsurvived COVID-19 patients had distinct clinical and laboratory characteristics, which were separated by principle component analysis. Elder age, increased number of affected lobes, higher levels of serum CRP, chest tightness/dyspnea, and smoking history were risk factors for mortality of severe COVID-19 patients. Longitudinal changes of laboratory findings may be helpful in predicting disease progression and clinical outcome of severe patients.
Keywords: clinical characteristics; coronavirus disease 2019; mortality; risk factors; severity.
© 2020 EAACI and John Wiley and Sons A/S. Published by John Wiley and Sons Ltd.
Conflict of interest statement
CA reports grants from Allergopharma, Idorsia, Swiss National Science Foundation, Christine Kühne‐Center for Allergy Research and Education, European Commission's Horizon's 2020 Framework Programme, Cure, Novartis Research Institutes, AstraZeneca, Scibase, and advisory role in Sanofi/Regeneron. All other authors declare no conflict of interest outside the submitted work.
Figures
References
-
- World Health Organization (WHO) . Coronavirus disease (COVID‐2019) situation reports. https://www.who.int/emergencies/diseases/novel‐coronavirus‐2019/situatio.... Accessed July 2, 2020.
-
- Health Commission of Hubei Province . Epidemic situation report of COVID‐19 in Hubei Province on May 30, 2020. In Chinese. http://wjw.hubei.gov.cn/fbjd/dtyw/202005/t20200531_2372659.shtml. Accessed June 8, 2020.
MeSH terms
Substances
LinkOut - more resources
Full Text Sources
Medical
Research Materials
Miscellaneous
