. 2020 Oct 1;130(10):5380-5396.
doi: 10.1172/JCI137110.

Targeting tumor-associated macrophages and granulocytic myeloid-derived suppressor cells augments PD-1 blockade in cholangiocarcinoma

Affiliations

Targeting tumor-associated macrophages and granulocytic myeloid-derived suppressor cells augments PD-1 blockade in cholangiocarcinoma

Emilien Loeuillard et al. J Clin Invest. .

Abstract

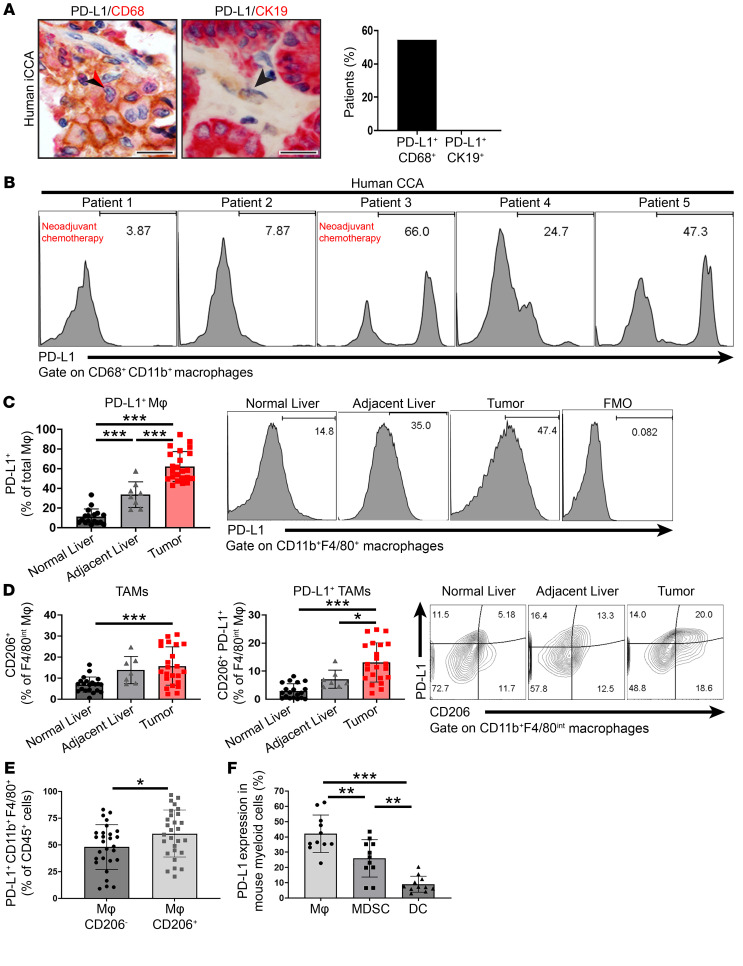
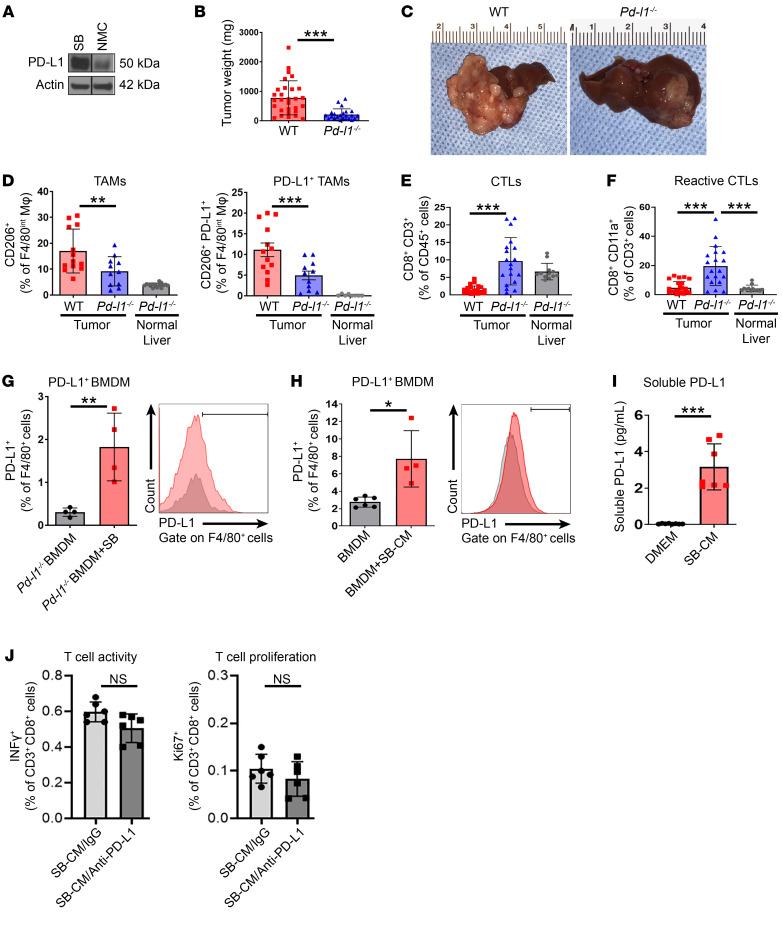
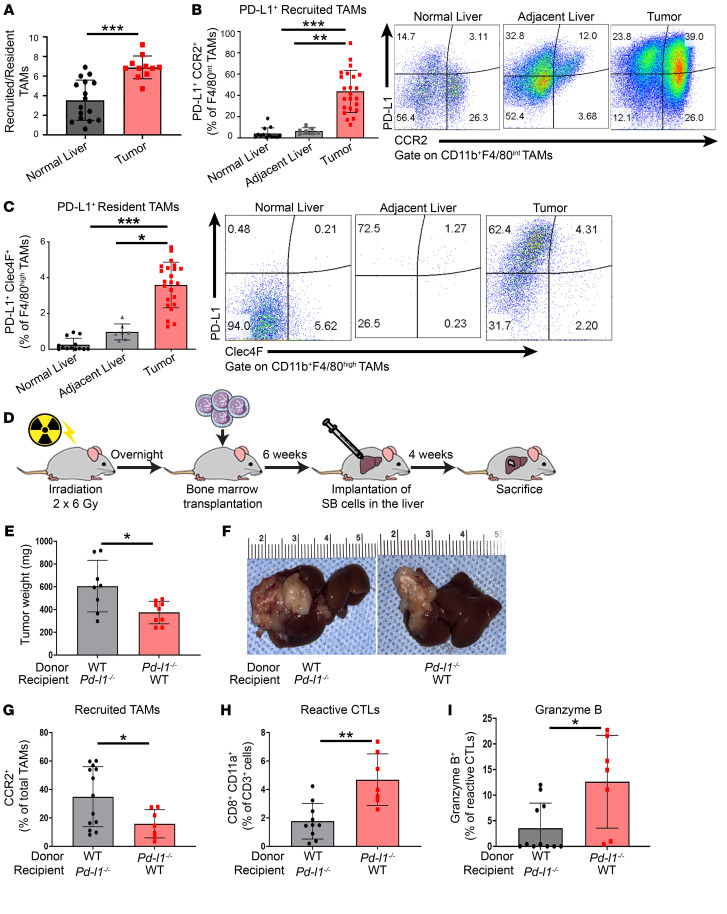
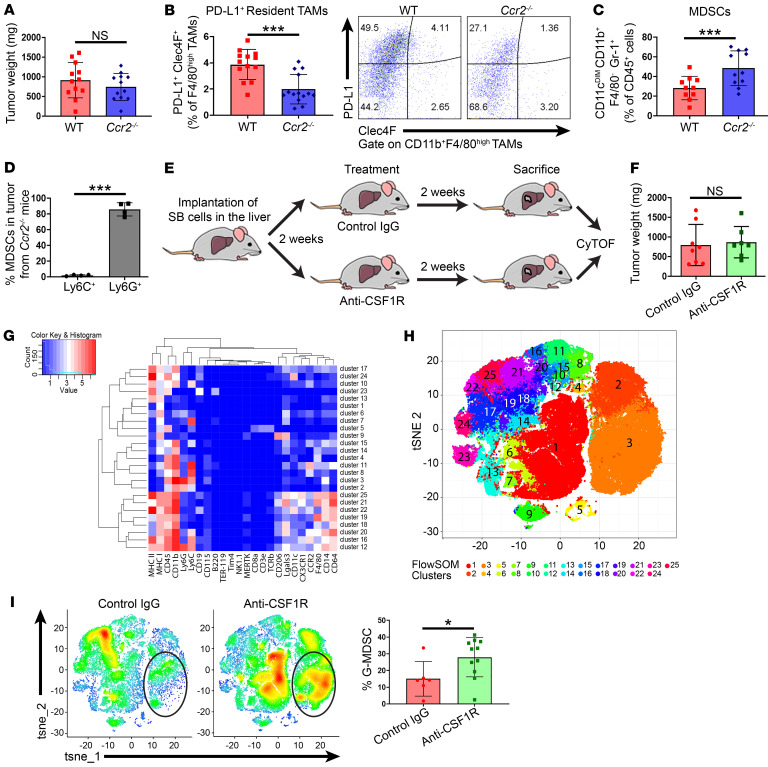
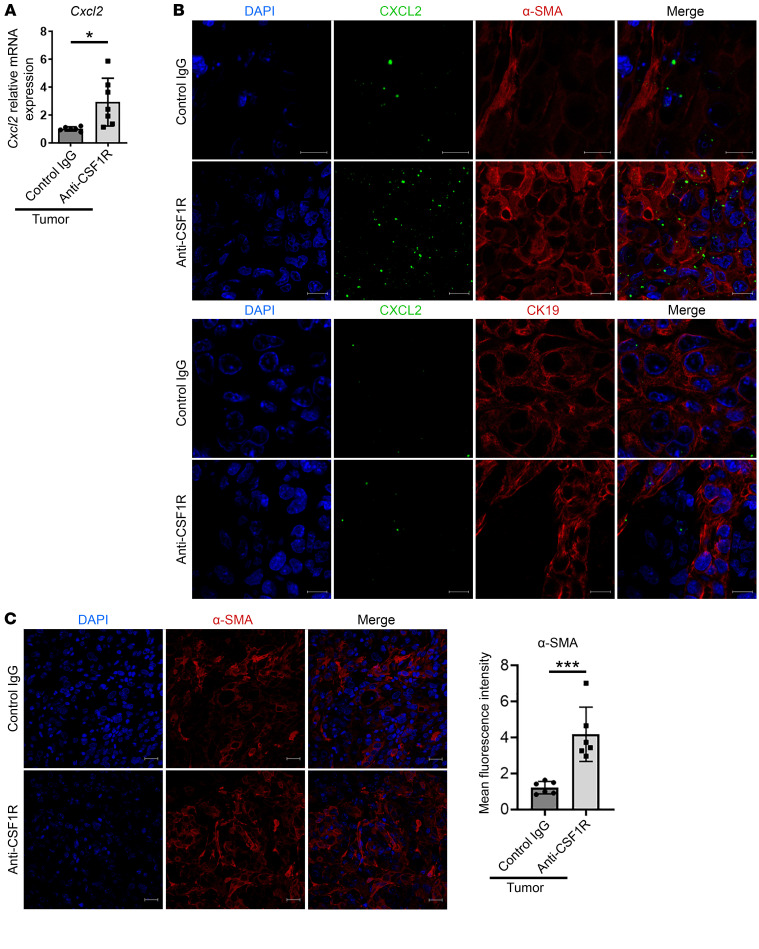
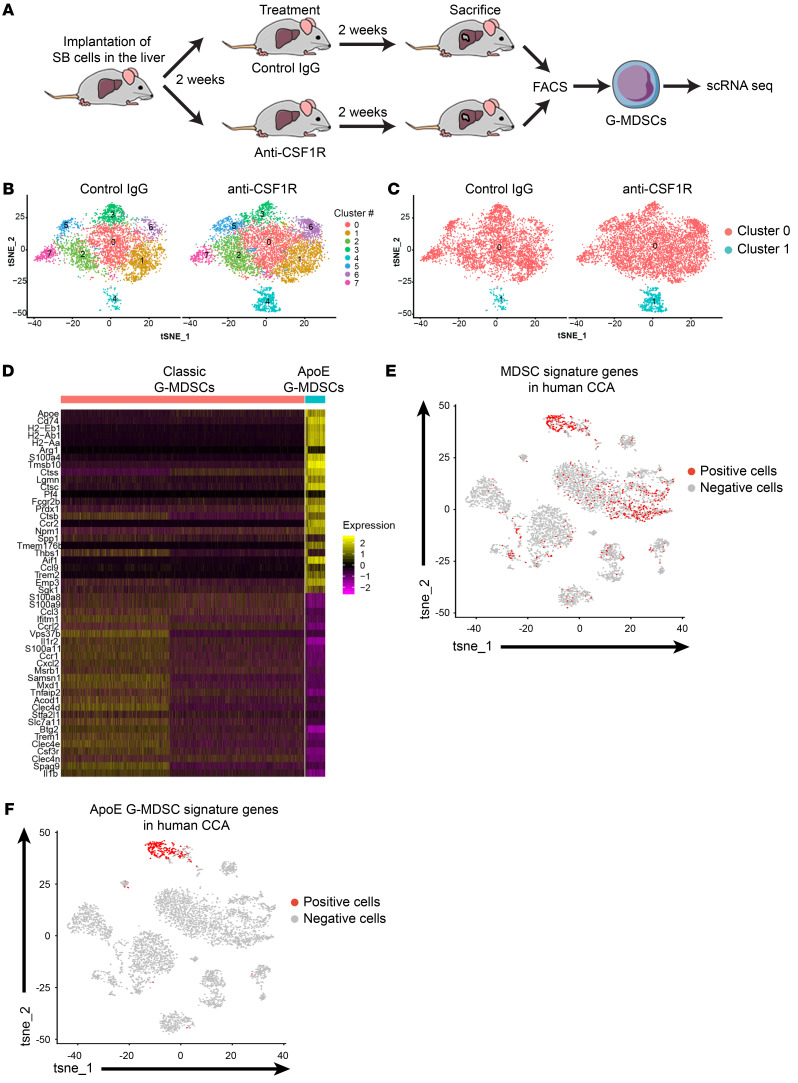
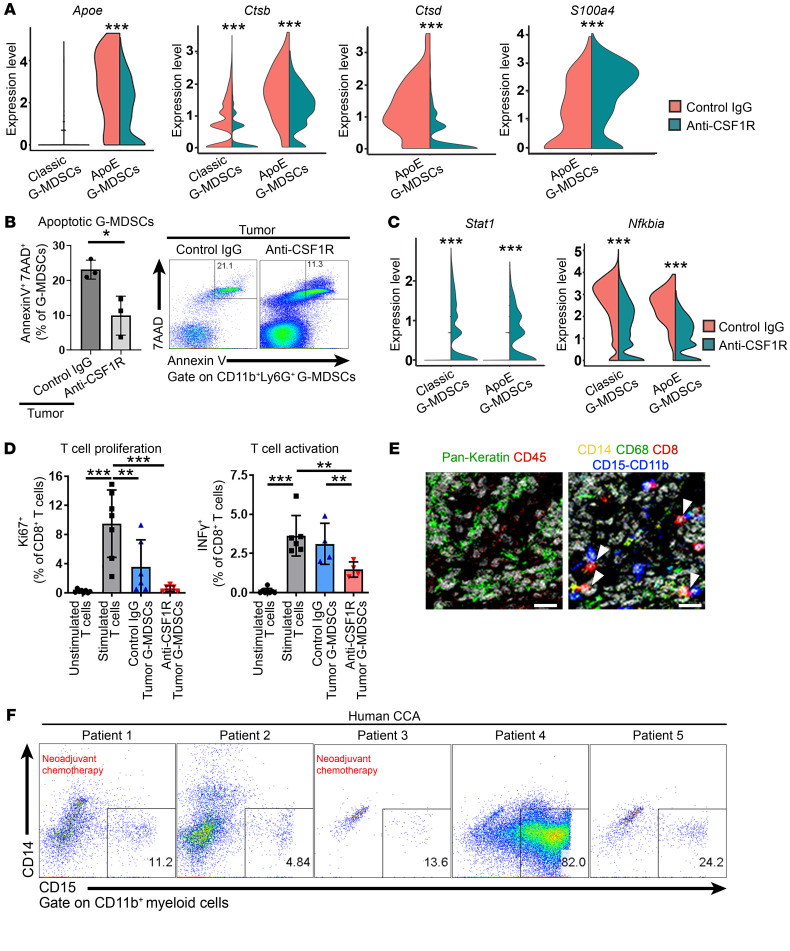
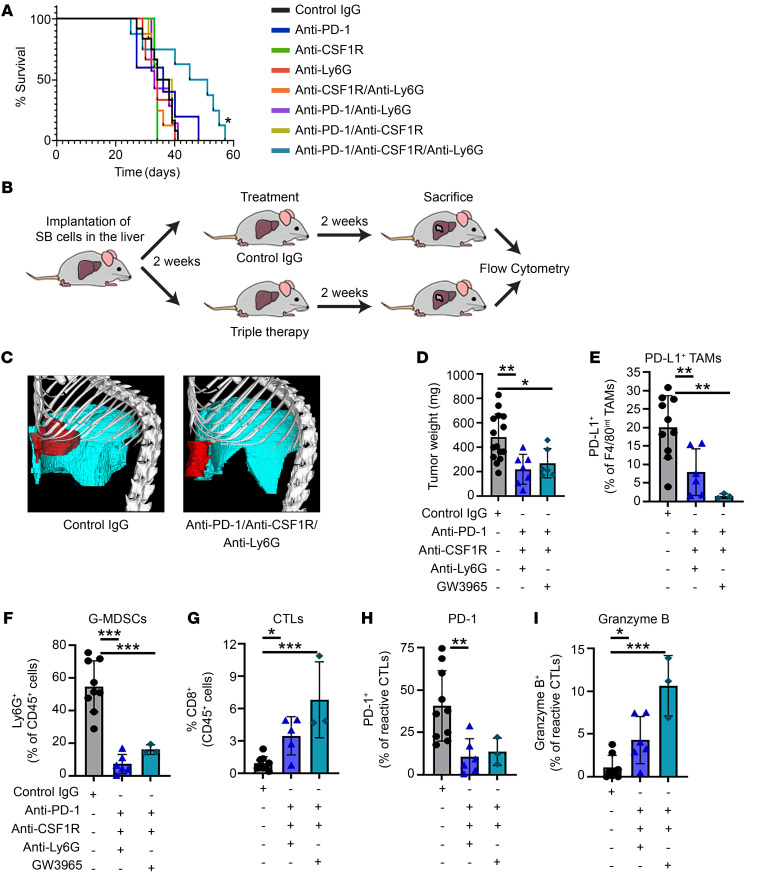
Immune checkpoint blockade (ICB) has revolutionized cancer therapeutics. Desmoplastic malignancies, such as cholangiocarcinoma (CCA), have an abundant tumor immune microenvironment (TIME). However, to date, ICB monotherapy in such malignancies has been ineffective. Herein, we identify tumor-associated macrophages (TAMs) as the primary source of programmed death-ligand 1 (PD-L1) in human and murine CCA. In a murine model of CCA, recruited PD-L1+ TAMs facilitated CCA progression. However, TAM blockade failed to decrease tumor progression due to a compensatory emergence of granulocytic myeloid-derived suppressor cells (G-MDSCs) that mediated immune escape by impairing T cell response. Single-cell RNA sequencing (scRNA-Seq) of murine tumor G-MDSCs highlighted a unique ApoE G-MDSC subset enriched with TAM blockade; further analysis of a human scRNA-Seq data set demonstrated the presence of a similar G-MDSC subset in human CCA. Finally, dual inhibition of TAMs and G-MDSCs potentiated ICB. In summary, our findings highlight the therapeutic potential of coupling ICB with immunotherapies targeting immunosuppressive myeloid cells in CCA.

Keywords: Cancer immunotherapy; Gastroenterology; Liver cancer; Macrophages; Oncology.


Conflict of interest statement

Conflict of interest: The authors have declared that no conflict of interest exists.

Figures

Figure 1
Figure 1. TAMs are the predominant source of PD-L1 in CCA.
(A) Representative images (left and middle panels) of PD-L1 (brown staining, black arrowhead) plus CD68 (red staining, red arrowhead) coimmunostaining (n = 33) and PD-L1 (brown staining) plus CK-19 (red staining) coimmunostaining (n = 18) in human resected CCA specimens. Percentage of patients with positive PD-L1/CD68 costaining and PD-L1/CK19 costaining, respectively (right panel). Scale bars: 40 μm. (B) Histograms show expression of PD-L1+ macrophages in human CCA tumors. (CF) Flow cytometry analysis of normal WT mouse livers (from WT mice without tumors) as well as adjacent livers and tumors of mice 28 days after orthotopic implantation of 1 × 10⁶ SB (murine CCA) cells. (C) Percentage of PD-L1+ macrophages (Mφ) of total macrophages (CD45+ CD11b+F4/80+) in WT mouse normal liver, tumor-adjacent liver, or tumor. Fluorescence Minus One (FMO) controls were used for each independent experiment to establish gates (See Supplemental Figure 1A for gating strategy) (n ≥ 8). Representative histograms show expression of PD-L1+ macrophages. (D) Percentage of CD206+ TAMs (left panel) and PD-L1+CD206+ TAMs (middle panel) of F4/80int macrophages (CD45+ CD11b+F4/80int) in WT mouse liver, tumor-adjacent liver, or tumor. Representative contour plots (right panel) show CD206 and PD-L1 expression of F4/80int macrophages (n ≥ 7). (E) Percentage of PD-L1+CD206 macrophages or PD-L1+CD206+ macrophages (CD11b+F4/80+) of CD45+ cells from SB tumors (n = 28). (F) Percentage of PD-L1 expression in myeloid cells from SB tumors. Macrophages, CD45+PD-L1+CD11b+F4/80+; MDSCs, CD45+PD-L1+CD11cCD11b+F4/80GR-1+; DCs, CD45+PD-L1+CD11chi; (n = 11). Data are represented as mean ± SD. Unpaired Student’s t test (E) and 1-way ANOVA with Bonferroni’s post hoc test (C, D, and F) were used. *P < 0.05; **P < 0.01; ***P < 0.001.
Figure 2
Figure 2. Host PD-L1 contributes to CCA progression.
(A) Immunoblot analysis of PD-L1 in mouse CCA cells (SB) and normal mouse cholangiocytes (NMC). (BF) Tumor growth of 28 days after orthotopic implantation of 1 × 10⁶ SB cells in WT or Pd-l1–/– mouse livers. (B) Average tumor weights in mg of WT or Pd-l1–/– mice (n ≥ 23). (C) Representative photographs of livers from B. (D) Percentage of CD206+ TAMs (left panel) and CD206+PD-L1+ TAMs (right panel) of F4/80int TAMs (CD45+ CD11b+F4/80in) in Pd-l1–/– normal liver (from mice without tumors) and tumors from WT and Pd-l1–/– mice (n ≥ 8). (E) Percentage of CD8+CD3+ T CTLs of CD45+ cells in Pd-l1–/– normal liver and tumors from WT and Pd-l1–/– mice (n ≥ 12). (F) Percentage of CD8+CD11a+ reactive CTLs of CD45+CD3+ cells in Pd-l1–/– normal liver and tumors from WT and Pd-l1–/– mice (n ≥ 12). (G) Percentage of PD-L1+ F4/80+ BMDMs after 72 hours of coculture in vitro with SB cells (ratio 1:1). BMDMs were isolated from WT mice (n = 4). (H) Percentage of PD-L1+F4/80+ BMDMs after 24 hours of treatment with conditioned medium (CM) from SB cells (1 mL). BMDMs were isolated from WT mice (n = 4). (I) Concentration (pg/mL) of soluble PD-L1 in conditioned medium of SB cells after 24 hours of culture (n = 8). (J) Percentage of INF-γ+ T cells and Ki67+ T cells after 24 hours of treatment with conditioned medium from SB cells (1 mL) with IgG or anti–PD-L1 neutralizing antibody (SB-CM/IgG or SB-CM/anti–PD-L1). T cells were isolated from WT mice (n ≥ 5). Data are represented as mean ± SD. Unpaired Student’s t test (B and GI) and 1-way ANOVA with Bonferroni’s post hoc test (DF and J) were used. *P < 0.05; **P < 0.01; ***P < 0.001.
Figure 3
Figure 3. PD-L1+ TAMs are recruited from the BM in CCA.
(AC and EI) Tumor growth of 28 days after orthotopic implantation of 1 × 10⁶ SB (murine CCA) cells in WT or Pd-l1–/– mouse livers. (A) Ratio of recruited TAMs (CD45+CD11b+F4/80intCCR2+) to resident TAMs (CD45+CD11b+F4/80hiClec4F+) in WT mouse liver (from mice without tumors) or SB tumor (n ≥ 11). (B) Percentage of PD-L1+CCR2+ recruited TAMs of F4/80int TAMs (CD45+CD11b+F4/80int) in WT mouse liver, tumor-adjacent liver, or tumor. Representative flow plots show expression of CCR2 and PD-L1 in F4/80int TAMs (n ≥ 7). (C) Percentage of PD-L1+Clec4F+ resident TAMs of F4/80hi TAMs (CD45+CD11b+F4/80hi) in WT mouse liver, tumor-adjacent liver, or tumor. Representative flow plots show expression of Clec4F and PD-L1 in F4/80hi TAMs (n ≥ 7). (D) Schematic of mouse BM transplantation. (E) Average tumor weights in mg of Pd-l1–/–mice transplanted with WT BM (WT–Pd-l1–/–) or WT mice transplanted with Pd-l1–/– BM (Pd-l1–/––WT) (n ≥ 8). (F) Representative photographs of livers from E. (G) Percentage of CCR2+ recruited TAMs of total TAMs (CD45+CD11b+F4/80+) in tumors from WT–Pd-l1–/– or Pd-l1–/––WT mice (n ≥ 7). (H) Percentage of CD8+CD11a+ reactive CTLs of CD45+CD3+ cells in tumors from WT–Pd-l1–/– or Pd-l1–/––WT mice (n ≥ 7). (I) Percentage of granzyme B expressed in CD8+CD11a+ reactive CTLs (CD45+CD3+CD8+ CD11a+) in tumors from WT–Pd-l1–/– or Pd-l1–/––WT mice (n ≥ 7). Data are represented as mean ± SD. Unpaired Student’s t test (A, E, and GI) and 1-way ANOVA with Bonferroni’s post hoc test (B and C) were used. *P < 0.05; **P < 0.01; ***P < 0.001.
Figure 4
Figure 4. TAM blockade promotes a compensatory infiltration of G-MDSCs.
(AF and I) Tumor growth of 28 days after orthotopic implantation of 1 × 10⁶ SB (murine CCA) cells in WT or Ccr2–/– mouse livers. (A) Average tumor weights in mg of WT and Ccr2–/– mice (n = 12). (B) Percentage of PD-L1+Clec4F+ resident TAMs of F4/80hi TAMs (CD45+CD11b+F4/80hi) in WT or Ccr2–/– tumors (n = 14). Representative flow plots show expression of Clec4F and PD-L1 in F4/80hi TAMs. (C) Percentage of CD11cDimF4/80CD11b+Gr-1+MDSCs of CD45+ cells in WT or Ccr2–/– tumors (n = 14). (D) Percentage of CD11cDimF4/80CD11b+Ly6C+ M-MDSCs and CD11cDimF4/80CD11b+Ly6G+ G-MDSCs of CD45+ cells in Ccr2–/– tumors (n = 4). (E) Schematic of myeloid cell analysis in anti-CSF1R– and control-treated mouse tumors. (F) Average tumor weights in mg of WT mice treated every 3 days from days 14 to 28 (after orthotopic SB cell implantation) with a control rat IgG isotype or anti-mouse CSF1R (AFS98) (n ≥ 7). (G) Heatmap showing average marker expression intensity in the different CyTOF clusters. (H) tSNE plots of CyTOF data sets show different clusters of immune cell populations identified by selected markers. (I) tSNE plots of CyTOF data sets show different clusters of immune cell populations identified by selected markers in tumor from WT mice treated with control IgG (n = 6) or anti-CSF1R (n = 11). Cells are color coded and represent the mean of cell density in each cluster. Black circles outline the G-MDSC cluster (cluster 3). Percentage of G-MDSCs identified by markers expressed in cluster 3 in tumor from WT mice treated with control IgG or anti-CSF1R (n ≥ 6). Data are represented as mean ± SD. One-way ANOVA with Bonferroni’s post hoc test was used. *P < 0.05; ***P < 0.001.
Figure 5
Figure 5. CAF-derived CXCL2 is increased in the context of TAM blockade.
(AC) Tumor growth of 28 days after orthotopic implantation of 1 × 10⁶ SB (murine CCA) cells in WT mouse livers. (A) Relative mRNA expression of Cxcl2 in control or anti-CSF1R–treated SB tumors (n ≥ 6). (B) Representative immunofluorescence images of α-SMA (upper panels) or CK-19 (lower panels) in red, Cxcl2 by in situ hybridization in green, and nuclei counterstained with DAPI in control or anti-CSF1R–treated mouse tumor. Scale bars: 10 μm. (C) Representative immunofluorescence images of α-SMA (left panel) in red, counterstained nuclei with DAPI in control or anti-CSF1R treated-mouse tumor. Scale bars: 20 μm. Quantification of mean fluorescence intensity of α-SMA signal in control or anti-CSF1R–treated mouse liver (right panel). Data are represented as mean ± SD. Unpaired Student’s t test was used. *P < 0.05; ***P < 0.001.
Figure 6
Figure 6. Single-cell transcriptomics demonstrates accumulation of unique G-MDSC subsets with TAM blockade.
(A) Schematic depicting scRNA-Seq study of FACS-sorted G-MDSCs from control and anti-CSF1R–treated murine tumors. (B and C) Tumor growth of 28 days after orthotopic implantation of 1 × 10⁶ SB (murine CCA) cells in WT mice. Mice were treated from day 14 to day 28 after implantation with control rat IgG isotype or anti-CSF1R (AFS98). (B) Cell clustering based on tSNE algorithm for WT mouse samples treated with control IgG or anti-CSF1R. Eight clusters were initially identified with high resolution (resolution = 0.5) based on a shared nearest neighbor clustering algorithm as implemented in Seurat. (C) Cell clusters with similar expression profiles were further combined with resultant 2 distinct cell clusters. Percentage of cells in cluster 0 was 98% for control sample and 86% for anti-CSF1R sample. P < 0.01, Fisher’s exact test. (D) Heatmap of gene expression profiles for selected top cluster-specific genes (n = 25 for cluster 0 and cluster 1). Expression values for each gene were Z scored across all cells. (E) Enrichment analysis for 40 signature human MDSC genes using AUCell in human CCA (n = 10). Significantly enriched cells are highlighted in red. (F) Enrichment analysis for 40 ApoE G-MDSC signature genes using AUCell in human CCA (n = 10). Significantly enriched cells are highlighted in red.
Figure 7
Figure 7. TAM blockade facilitates accumulation of G-MDSC subsets with survival and immunosuppressive properties.
(AD) Tumor growth of 28 days after orthotopic implantation of 1 × 10⁶ SB (murine CCA) cells in WT mice. Mice were treated from day 14 to day 28 after implantation with control IgG isotype or anti-CSF1R (AFS98). (A) Violin plots of expression levels for differentially expressed genes (Apoe, Ctsb, Ctsd, and S100a4) compared between control and anti-CSF1R–treated tumors. Colors indicate control and anti-CSF1R–treated samples. P values indicate significance of expression differences between control and treatment. (B) Percentage of Annexin V+7AAD+ G-MDSCs in control or anti-CSF1R–treated tumors (n ≥ 3). Representative flow plots show expression of Annexin V and 7AAD in G-MDSCs. (C) Violin plot of expression levels for differentially expressed genes (Stat1 and Nfkbia) compared between control and anti-CSF1R–treated tumors. P values indicate significance of expression differences between control and treatment. (D) Percentage of Ki67+ cells of CD8+ T cells (CD3+CD8+) (left panel) and percentage of INF-γ+ cells of CD8+ T cells (CD3+CD8+) (right panel) after 48 hours of coculture with G-MDSCs. (E) Hyperion multiplexed images show several immune cell markers using formalin-fixed, paraffin-embedded tissues from human CCA. Pseudo-colored raw ion images representing the markers of immune cells detected in the region of interest. Left panel shows pan-keratin (green), a CCA marker, and CD45 (red), a leukocyte marker. Right panel shows CD14 (yellow), a monocyte marker; CD68 (green), a macrophage marker; CD8 (red), a CTL marker; CD11b-CD15 (blue), G-MDSC markers. White arrowheads indicate CD8+ T cell (red) and G-MDSC (blue) interaction. Scale bars: 10 μm. (F) Flow plots show expression of CD15CD14+ G-MDSCs in human CCA. Data are represented as mean ± SD. Unpaired Student’s t test (AC) and 1-way ANOVA with Bonferroni’s post hoc test (D) were used. *P < 0.05; **P < 0.01; ***P < 0.001.
Figure 8
Figure 8. Dual inhibition of G-MDSCs and TAMs potentiates anti–PD-1 therapy.
(AI) Tumor growth of 28 days after orthotopic implantation of 1 × 10⁶ SB (murine CCA) cells in WT mice. Mice were treated from day 14 to day 28 after implantation. (A) Survival curves in mice treated with control rat IgG isotype, anti–PD-1 (G4), anti-CSF1R (AFS98), anti-Ly6G (1A8), GW3965 alone, or in the depicted combinations (n ≥ 5). (B) Schematic of mouse immunotherapy treatment and characterization. (C) Representative CT image of liver tumor from a contrast reagent–injected mouse treated with control IgG isotype or anti–PD-1+anti-CSF1R+anti-Ly6G 28 days after implantation. The liver is depicted in blue and the tumor in red. (D) Average tumor weights in mg of WT mice treated with control IgG isotype, anti–PD-1+anti-CSF1R+anti-Ly6G, or anti–PD-1+anti-CSF1R+GW3965 (n ≥ 6) (E) Percentage of PD-L1+ TAMs of F4/80int TAMs (CD45+CD11b+F4/80int) in tumors from WT mice treated with control IgG isotype or anti–PD-1+anti-CSF1R+anti-Ly6G or anti–PD-1+anti-CSF1R+GW3965 (n ≥ 3). (F) Percentage of CD11cDimF4/80CD11b+Ly6G+ G-MDSCs of CD45+ cells in tumors from WT mice treated with control IgG isotype or anti–PD-1+anti-CSF1R+anti-Ly6G or anti–PD-1+anti-CSF1R+GW3965 (n ≥ 3). (G) Percentage of CD8+ CTLs of CD45+ cells in tumors from WT mice treated with control IgG isotype or anti–PD-1+anti-CSF1R+anti-Ly6G or anti–PD-1+anti-CSF1R+GW3965 (n ≥ 3). (H) Percentage of PD-1+ expressed in CD8+CD11a+ reactive CTLs (CD3+CD8+CD11a+) in tumors from WT mice treated with control IgG isotype or anti–PD-1+anti-CSF1R+anti-Ly6G or anti–PD-1+anti-CSF1R+GW3965 (n ≥ 3). (I) Percentage of granzyme B expressed in CD8+CD11a+ reactive CTLs (CD45+CD3+CD8+CD11a+) in tumors from WT mice treated with control IgG isotype or anti–PD-1+anti-CSF1R+anti-Ly6G or anti–PD-1+anti-CSF1R+GW3965 (n ≥ 3). Data are represented as mean ± SD. The log-rank Mantel-Cox test (A) and ANOVA with Bonferroni’s post hoc test (CH) were used. *P < 0.05; **P < 0.01; ***P < 0.001.

References

    1. Rizvi S, Khan SA, Hallemeier CL, Kelley RK, Gores GJ. Cholangiocarcinoma - evolving concepts and therapeutic strategies. Nat Rev Clin Oncol. 2018;15(2):95–111. doi: 10.1038/nrclinonc.2017.157. - DOI - PMC - PubMed
    1. Bertuccio P, et al. Global trends in mortality from intrahepatic and extrahepatic cholangiocarcinoma. J Hepatol. 2019;71(1):104–114. doi: 10.1016/j.jhep.2019.03.013. - DOI - PubMed
    1. Everhart JE, Ruhl CE. Burden of digestive diseases in the United States Part III: Liver, biliary tract, and pancreas. Gastroenterology. 2009;136(4):1134–1144. doi: 10.1053/j.gastro.2009.02.038. - DOI - PubMed
    1. Valle J, et al. Cisplatin plus gemcitabine versus gemcitabine for biliary tract cancer. N Engl J Med. 2010;362(14):1273–1281. doi: 10.1056/NEJMoa0908721. - DOI - PubMed
    1. Dong H, Zhu G, Tamada K, Chen L. B7-H1, a third member of the B7 family, co-stimulates T-cell proliferation and interleukin-10 secretion. Nat Med. 1999;5(12):1365–1369. doi: 10.1038/70932. - DOI - PubMed

Publication types

MeSH terms