. 2020 Aug 4;32(2):215-228.e7.
doi: 10.1016/j.cmet.2020.06.017. Epub 2020 Jul 13.

PHD3 Loss Promotes Exercise Capacity and Fat Oxidation in Skeletal Muscle

Affiliations

PHD3 Loss Promotes Exercise Capacity and Fat Oxidation in Skeletal Muscle

Haejin Yoon et al. Cell Metab. .

Abstract

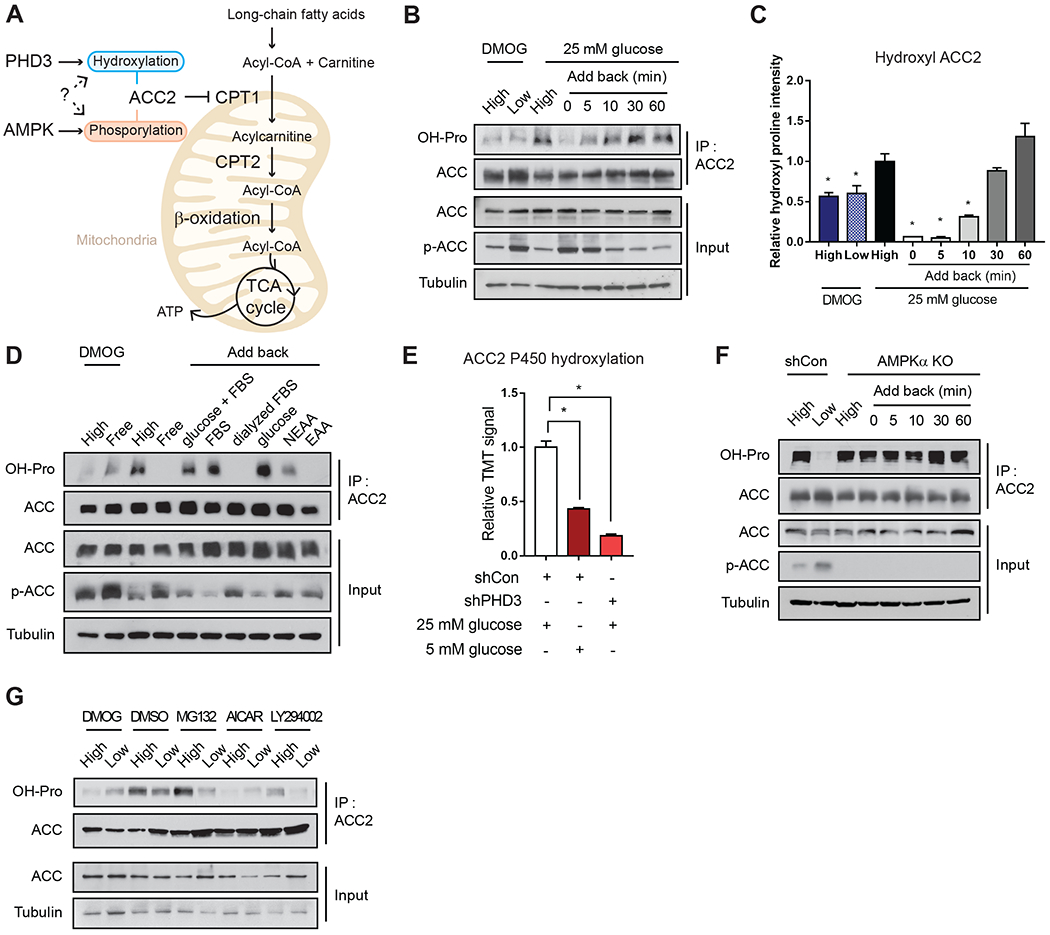
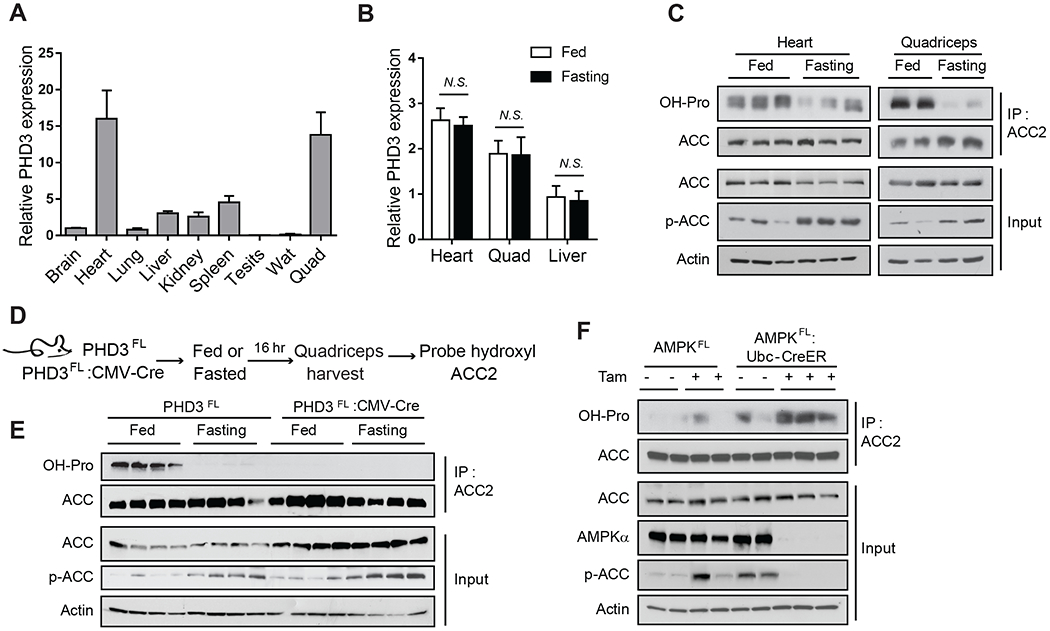
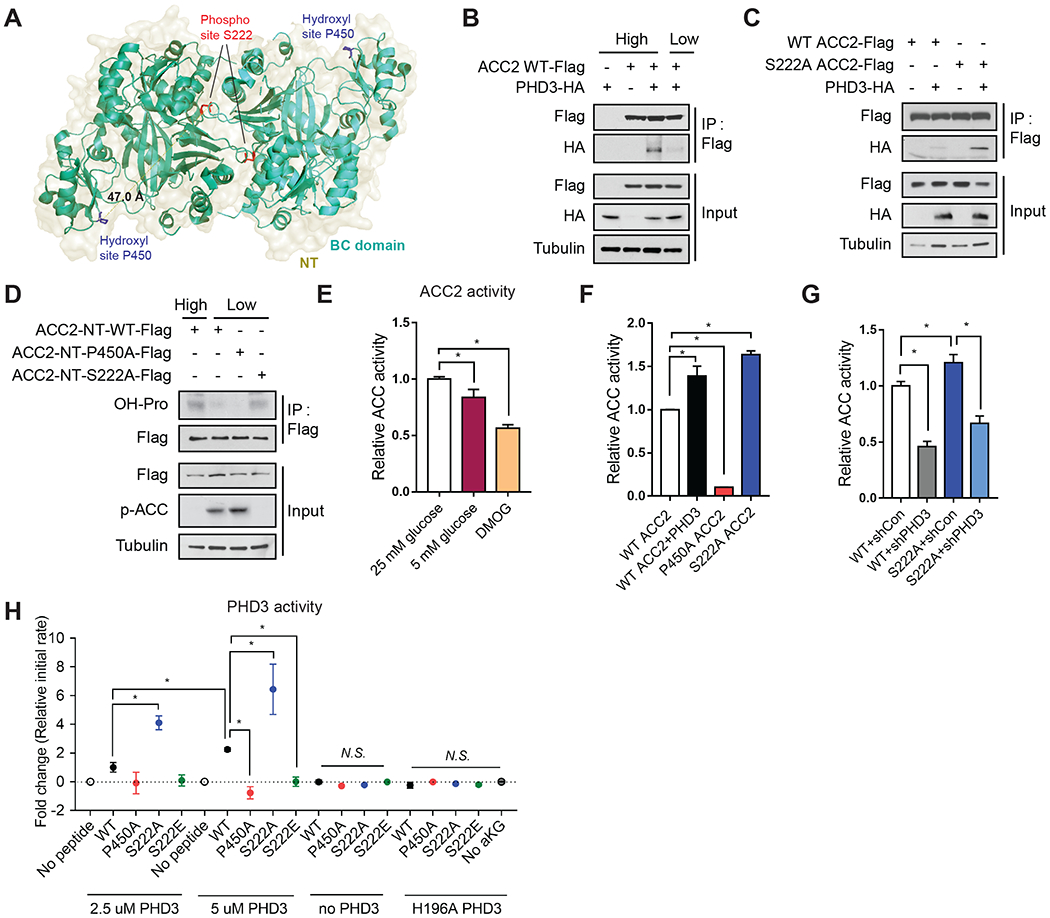
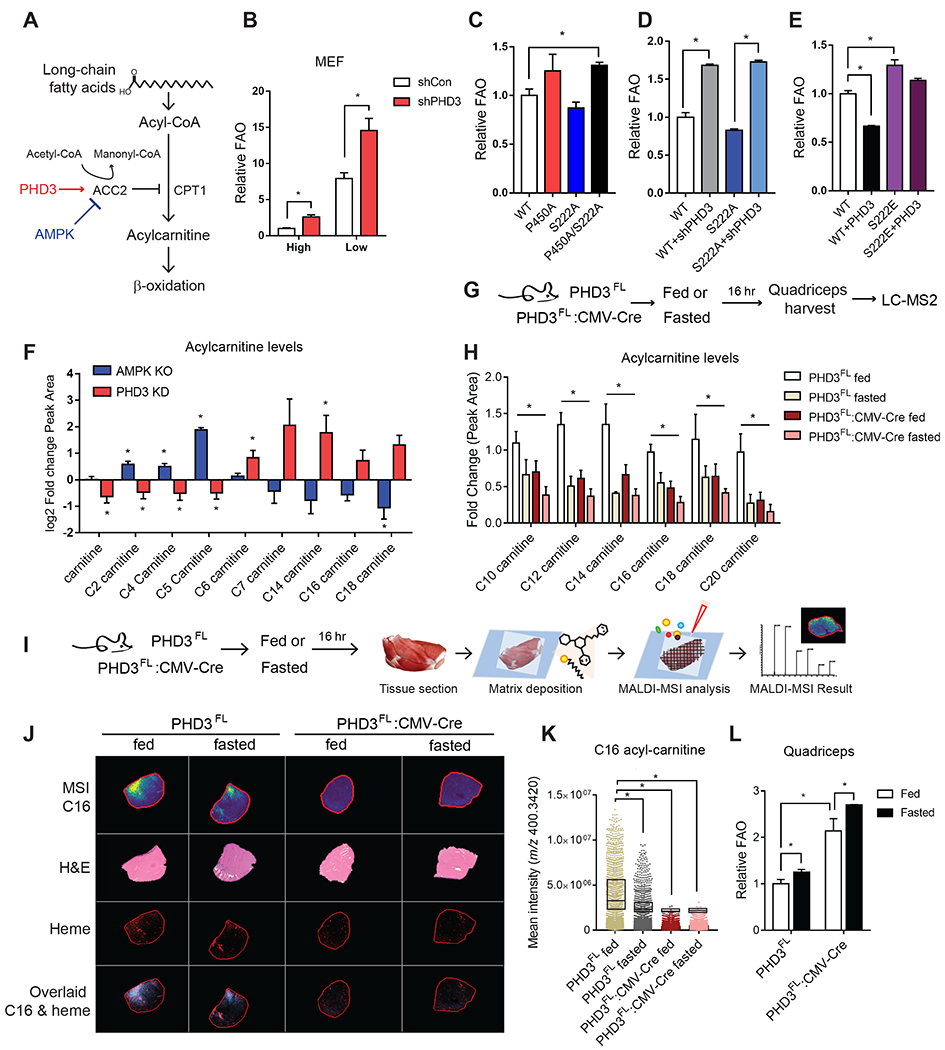
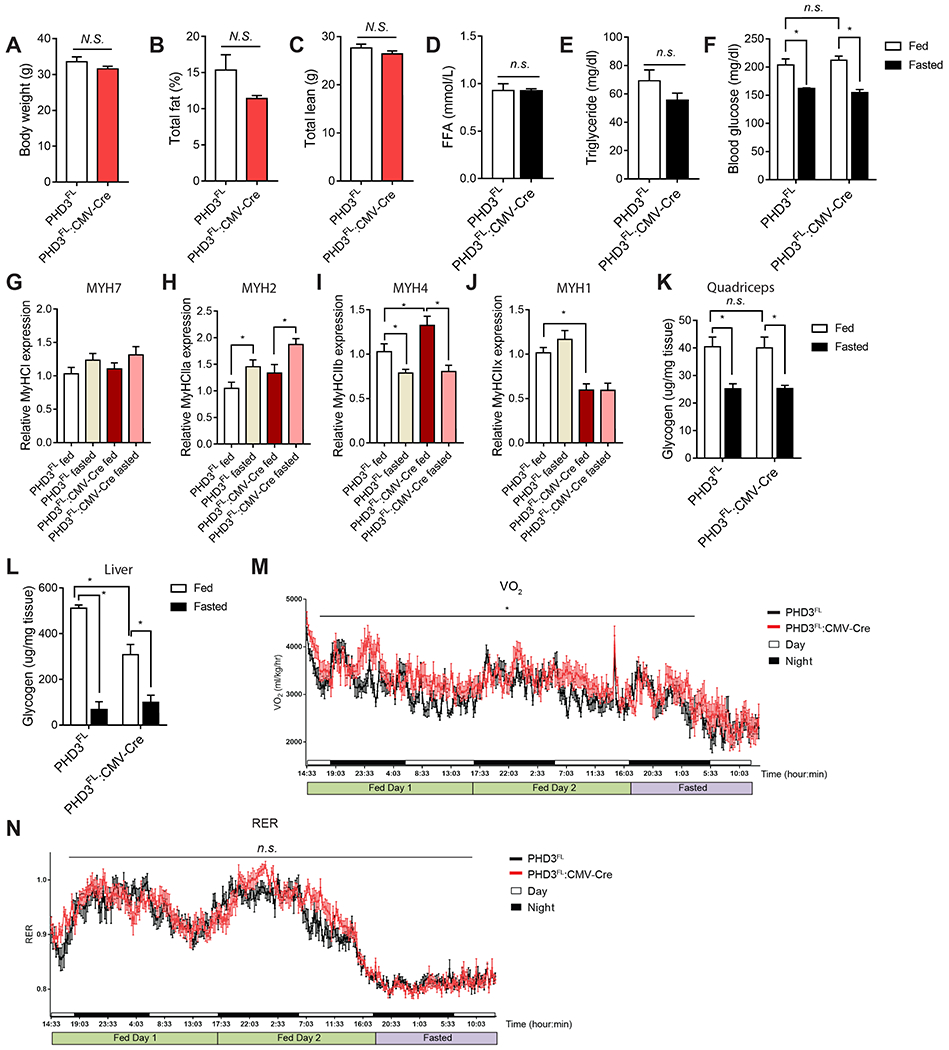
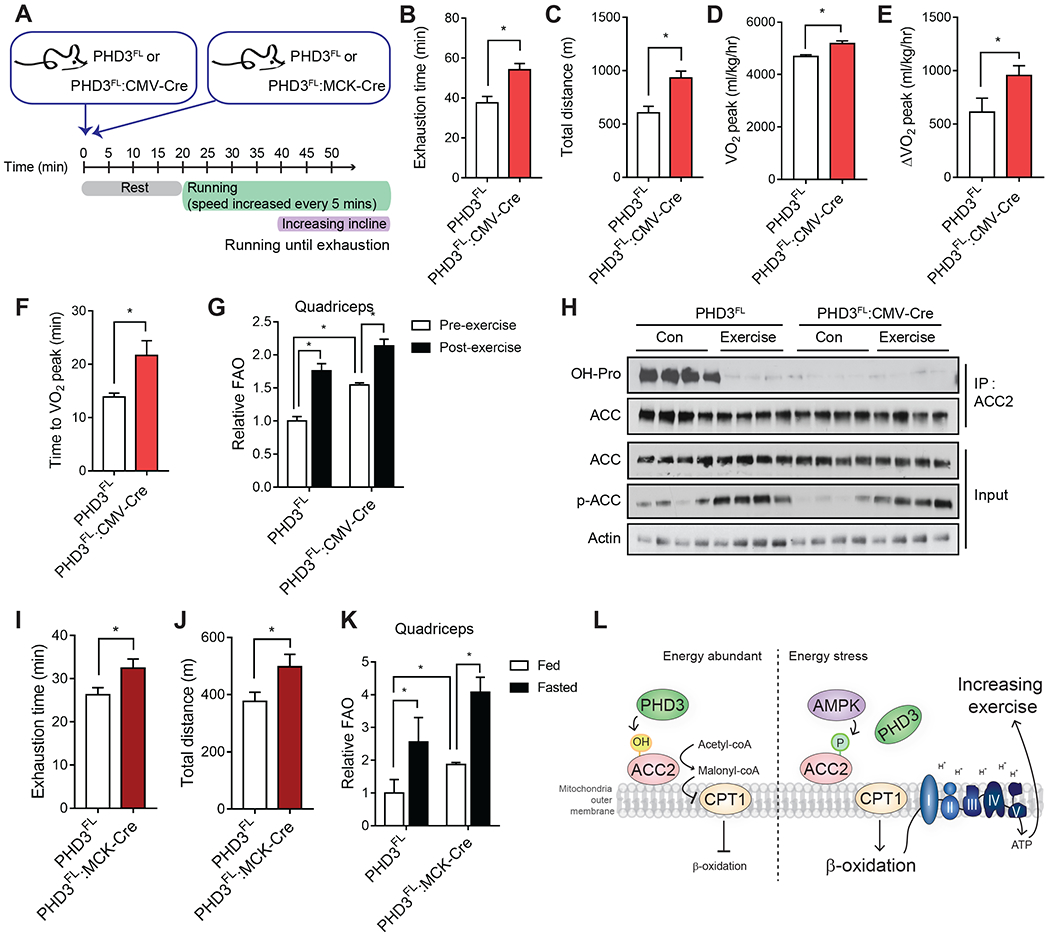
Rapid alterations in cellular metabolism allow tissues to maintain homeostasis during changes in energy availability. The central metabolic regulator acetyl-CoA carboxylase 2 (ACC2) is robustly phosphorylated during cellular energy stress by AMP-activated protein kinase (AMPK) to relieve its suppression of fat oxidation. While ACC2 can also be hydroxylated by prolyl hydroxylase 3 (PHD3), the physiological consequence thereof is poorly understood. We find that ACC2 phosphorylation and hydroxylation occur in an inverse fashion. ACC2 hydroxylation occurs in conditions of high energy and represses fatty acid oxidation. PHD3-null mice demonstrate loss of ACC2 hydroxylation in heart and skeletal muscle and display elevated fatty acid oxidation. Whole body or skeletal muscle-specific PHD3 loss enhances exercise capacity during an endurance exercise challenge. In sum, these data identify an unexpected link between AMPK and PHD3, and a role for PHD3 in acute exercise endurance capacity and skeletal muscle metabolism.

Keywords: Prolyl hydroxylase 3; acetyl-CoA carboxylase 2 modification; exercise capacity; fat catabolism.


Conflict of interest statement

Declaration of Interests J.A. is a scientific advisory board member of Mitobridge/Astellas, Metro Biotech, and TES Pharma. The other authors do not declare a potential conflict of interest.

Figures

Figure 1.
Figure 1.
ACC2 hydroxylation is energy-sensitive and negatively regulated by AMPK. (A) Schematic of the potential roles for ACC2 phosphorylation and hydroxylation in mitochondrial fat oxidation. (B) MEFs were cultured in high (25 mM) or low (5 mM) glucose media for 12 hr with or without DMOG (1 mM). Then, cells were cultured in 25 mM glucose for the indicated times. ACC2 hydroxylation was detected following ACC2 immunoprecipitation and western blotting with pan-hydroxyproline antibody. Whole cell lysates (input) were probed with anti-ACC2, anti-phospho-ACC or anti-tubulin antibodies. A representative blot from three independent experiments is shown. (C) Quantitation of 3 independent western blots is shown in (B). Hydroxyl ACC2 was normalized to the level of total, immunoprecipitated ACC. The ratio of hydroxyl ACC2:total ACC2 was normalized to the level of respective tubulin level (n=3). (D) ACC2 hydroxylation was assessed in cells that were cultured for 8 hours in the indicated fuel conditions (further described in Figure S1A): 1 mM DMOG; High, 25 mM glucose with serum; Free, media without Glu, FBS, or glucose; glucose+FBS, 25 mM glucose with serum; FBS, no glucose with serum; Dialyzed FBS, no glucose with dialyzed FBS; glucose, 25 mM glucose without serum; NEAA, no glucose with 1% non essential amino acids; EAA, no glucose with 1% essential amino acid. (E) Representative Tandem Mass Tag (TMT) signals identifying hydroxylated P450 on ACC2 in 293T cells in cultured in 25 mM glucose media (white), 5 mM glucose media (dark red) or PHD3 knockdown cells cultured in 25 mM glucose media (red). (F) Hydroxylation was measured from ACC2 immunoprecipitates from wild type control or AMPKα knockout MEFs cultured in 25 versus 5 mM glucose, as in panel B. (G) ACC2 hydroxylation in MEFs in high or low glucose, in the presence of DMOG (1 mM for 1 h), DMSO, MG132 (10 mM for 1 h), AICAR (1 mM for 1 h) and LY294002 (50 mM for 1 h).
Figure 2.
Figure 2.
PHD3-mediated ACC2 hydroxylation in mouse tissues. (A) PHD3 mRNA expression in mouse brain, heart, lung, liver, kidney, spleen, testis, white adipose tissue, and quadriceps (n=4), normalized to the expression of β–actin. (B) PHD3 mRNA expression in heart, quadriceps, and liver isolated from fed or fasted (16 h) mice (n=4). (C) ACC2 hydroxylation, ACC2 level, and ACC2 phosphorylation was assessed by western blotting from heart and quadriceps muscle isolated from animals that were fed or fasted (16 h). For hydroxylation, ACC2 was immunoprecipitated from tissue lysates in the presence of DMOG, and then hydroxylation was detected using antibodies against pan-hydroxyproline and compared to the amount of immunoprecipitated ACC2. ACC2 input levels, ACC2 phosphorylation, and actin were measured in tissue lysates by immunoblotting. (D) Schematic of the detection of ACC2 hydroxylation in PHD3FL or PHD3FL:CMV-Cre mouse quadriceps under fed or fasted condition. (E) Immunoprecipitation and western blot analysis of ACC2 hydroxylation and phosphorylation in PHD3FL or PHD3FL:CMV-Cre mouse quadricep muscles from fed and fasted animals (n=4). (F) Immunoprecipitation and western blot analysis of ACC2 hydroxylation in quadriceps from AMPKFL and AMPKFL;Ubc-CreER mice. AMPKFL;Ubc-CreER mice were treated with tamoxifen (4 mg per day, for 5 days) to induce knockout of AMPK. Quadriceps were harvested 3 weeks post-tamoxifen treatment and protein was extracted.
Figure 3.
Figure 3.
The effect of ACC2 phosphorylation on ACC2 hydroxylation and activity. (A) P450 (hydroxylation site, blue) is located in the ACC2 BC domain (green and cyan, PDB: 3JRW). The distance between S222 (phosphorylation site, red) and hydroxylation sites in this modeled structure is ~50 Å. This model was generated by superposition of human ACC2 biotin carboxylase domain (PDB: 3JRW) with the yeast cryo-electron microscopy structure of entire ACC (PDB: 5CSL). (B) HEK293T cells were transfected with ACC2-Flag and/or PHD3-HA. Cells were incubated with 25 mM (high) or 5 mM glucose (low) media for 8 h and complexes were immunoprecipitated using anti-Flag antibody and immunoblotted with the indicated antibodies. (C) IP and western blot analysis of PHD3 and ACC2 interaction from HEK293T cells overexpressing PHD3-HA, ACC2-WT-Flag, or S222A ACC2-Flag. (D) ACC2 N-terminus (NT)-WT-Flag, ACC2 NT-P450A-Flag, ACC2 NT-S222A-Flag and/or PHD3-HA were transfected into HEK293T cells. Complexes were immunoprecipitated using anti-Flag antibody and proteins were detected by immunoblotting using the indicated antibodies. (E) Endogenous ACC2 was immunoprecipitated from HEK293T cells cultured in 25 mM glucose, 5 mM glucose, or DMOG for 8 hours. ACC activity was assessed by measuring [14C]malonyl-CoA production from [14C]sodium bicarbonate and acetyl-CoA. Activity was normalized to the amount of immunoprecipitated ACC2 (n=4). (F-G) ACC activity assay was performed as described in panel in (F) MEFs overexpressing full length WT ACC2-Flag, P450A ACC2-Flag, S222A ACC2-Flag, or PHD3-HA (n = 3) and in (G) shcontrol or shPHD3 MEFs overexpressing full length WT ACC2-Flag or S222A ACC2-Flag (n=4). (H) In vitro hydroxylation assay was performed to assess PHD3 activity be measuring succinate production using recombinant PHD3 incubated with the immunoprecipitated N-terminus domain of WT ACC2-Flag (aa 1-763), P450A ACC2-Flag, S222A ACC2-Flag, or S222E ACC2-Flag, which were eluted using Flag peptide. 2.5 uM or 5 uM of PHD3 was added to reactions containing 20 uM of ACC2. Initial rates were determined and normalized using controls which contained no peptide to account for uncoupled decarboxylation. Additional negative controls included ACC2 only, lacking PHD3 and reactions with the catalytic inactive variant H196A PHD3 (n=3 independent experiments).
Figure 4.
Figure 4.
Loss of PHD3 results in increased fatty acid catabolism in mouse muscle. (A) Schematic of the regulation of long-chain fatty acid oxidation by PHD3 and AMPK. (B) Palmitate oxidation in WT or PHD3 knockdown MEFs under high or low nutrient condition using FAO analysis (n = 3). (C) Palmitate oxidation assay in MEFs with overexpressed ACC2 WT, P450A ACC2, S222A ACC2 or P450A/S222A ACC2 double mutant (n = 3) using FAO analysis. (D) FAO analysis in MEFs overexpressed WT ACC2 or S222A ACC2 with PHD3 silencing (n = 3). (E) Palmitate oxidation assay in MEF cell lines with overexpression WT ACC2, S222E, or PHD3 (n=3). (F) Relative abundance of acyl-carnitines in MEFs depleted of PHD3 (red) and AMPK (blue) compared to control cells. For all comparisons two-tailed t test was used. N = 4, P < 0.05. (G) Flowchart of the metabolomic analysis using LC-MS in PHD3FL or PHD3FL:CMV-Cre mouse under fed or fasted condition. (H) The relative metabolite abundance of long chain acyl-carnitines in PHD3FL or PHD3FL:CMV-Cre mouse quadriceps under fed or fasted condition (n = 4). (I) Flowchart of the metabolomics analysis in PHD3FL or PHD3FL:CMV-Cre mouse quadriceps under fed or fasted condition. (J) Matrix-assisted laser desorption/ionization mass spectrometry imaging (MALDI-MSI) of palmitoylcarnitine (C16 acyl-carnitine, m/z 400.3420, Δppm = 1.16) in PHD3FL or PHD3FL:CMV-Cre mouse quadriceps under fed or fasted conditions, alongside H&E stained serial sections. Comparison of how distribution of different ions - acyl-carnitine distribution correlates with vasculature. (K) The scatter dot plot indicates the relative abundance of palmitoyl-carnitine under each condition. (L) Palmitate oxidation in PHD3FL or PHD3FL: CMV-Cre mice quadriceps under fed or fasted condition using [14C]-palmitate as a substrate and measuring 14CO2 capture on filter membrane as readout for FAO (n=4).
Figure 5.
Figure 5.
Characterization of PHD3FL:CMV-Cre mice. Metabolic parameters were assessed in 20 week-old male PHD3FL or PHD3FL:CMV-Cre mice. Body weight (A), total fat (B), and total lean mass (C) were measured using DEXA imaging analysis (n = 9 mice per group). Blood FFA (D) and triglyceride (E) levels (n=4). (F) Blood glucose levels in PHD3FL or PHD3FL:CMV-Cre mice were measured under ad libitum feeding or after a 16 h fast (n=9 per condition). The mRNA levels of MYH7 (G), MYH2 (H), MYH4 (I) and MYH1 (J) in PHD3FL or PHD3FL:CMV-Cre mouse quadriceps under fed or fasting conditions (n = 4). Glycogen levels were measured and normalized by tissue weight of PHD3FL or PHD3FL:CMV-Cre mice quadriceps (K) or liver (L) under fed or fasted condition (n=4). (M) Mean whole body maximum oxygen consumption rate (VO2) was measured in 20 week old PHD3FL or PHD3FL:CMV-Cre mice using Comprehensive Lab Animal Monitoring System (CLAMS) (n=9). Animals were fed ad libitum for 48 hours and fasted for 16 hours. (N) Respiratory exchange ratio (RER) using CLAMS. Data represented means ± SEM. *P < 0.05.
Figure 6.
Figure 6.
Loss of PHD3 increases exercise capacity. (A) Flowchart of the endurance exercise experiments. PHD3FL:CMV-Cre mice demonstrated increased exercise tolerance compared to PHD3FL control mice after repetitive treadmill running (n = 8 mice per group). The individual exhaustion time (B), total running distance (C), mean whole body maximum oxygen consumption rate (D) of both genotypes was calculated from the individual performances during treadmill running. (E) △VO2 peak was calculated by subtracting the mean basal VO2 from the maximal VO2 peak for each indicated animal. (F) Time to maximum oxygen consumption rate. Data represent mean ± SEM. *P < 0.05. (G) Palmitate oxidation was determined in mitochondrial homogenates isolated from PHD3FL or PHD3FL: CMV-Cre mice quadriceps in pre- or post-exercise conditions using [14C]-palmitate as a substrate and measuring 14CO2 capture on filter membrane as readout for FAO (n=3). (H) Immunoprecipitation and western blotting analysis of ACC2 hydroxylation and phosphorylation in PHD3FL or PHD3FL:CMV-Cre mouse quadriceps under pre- or post-exercise conditions (n = 4). The individual exhaustion time (I), total distance for running (J) during treadmill running with PHD3FL and PHD3 muscle-specific knockout mice (PHD3FL:MCK-Cre). (K) Palmitate oxidation in mitochondrial homogenates isolated from control or PHD3FL:MCK-Cre mice quadriceps under fed or fasted condition using [14C]palmitate as a substrate and measuring 14CO2 capture on filter membrane as readout for FAO (n=4). (L) Model summary. PHD3 hydroxylates ACC2 to repress FAO. By contrast, AMPK phosphorylates ACC2 and induces FAO. Phosphorylated ACC2 is a poor PHD3 substrate. PHD3 loss of function increases exercise capacity.

References

    1. Abu-Elheiga L, Oh W, Kordari P, and Wakil SJ (2003). Acetyl-CoA carboxylase 2 mutant mice are protected against obesity and diabetes induced by high-fat/high-carbohydrate diets. Proc. Natl. Acad. Sci. USA. 100, 10207–10212. - PMC - PubMed
    1. Bakay M, Wang Z, Melcon G, Schiltz L, Xuan J, Zhao P, Sartorelli V, Seo J, Pegoraro E, Angelini C, et al. (2006). Nuclear envelope dystrophies show a transcriptional fingerprint suggesting disruption of Rb-MyoD pathways in muscle regeneration. Brain. 129, 996–1013. - PubMed
    1. Berberich MJ, Paulo JA, and Everley RA (2018). MS3-IDQ: Utilizing MS3 Spectra beyond Quantification Yields Increased Coverage of the Phosphoproteome in Isobaric Tag Experiments. J. Proteome Res. 17, 1741–1747. - PMC - PubMed
    1. Bloemberg D, and Quadrilatero J (2012). Rapid determination of myosin heavy chain expression in rat, mouse, and human skeletal muscle using multicolor immunofluorescence analysis. PLoS One. 7, e35273. - PMC - PubMed
    1. Bujak AL, Crane JD, Lally JS, Ford RJ, Kang SJ, Rebalka IA, Green AE, Kemp BE, Hawke TJ, Schertzer JD, et al. (2015). AMPK activation of muscle autophagy prevents fasting-induced hypoglycemia and myopathy during aging. Cell Metab. 21, 883–890. - PMC - PubMed

Publication types

LinkOut - more resources