. 2020 Jul 10;10(7):1030.
doi: 10.3390/biom10071030.

Ampicillin/Sulbactam Treatment Modulates NMDA Receptor NR2B Subunit and Attenuates Neuroinflammation and Alcohol Intake in Male High Alcohol Drinking Rats

Affiliations

Ampicillin/Sulbactam Treatment Modulates NMDA Receptor NR2B Subunit and Attenuates Neuroinflammation and Alcohol Intake in Male High Alcohol Drinking Rats

Fawaz Alasmari et al. Biomolecules. .

Abstract

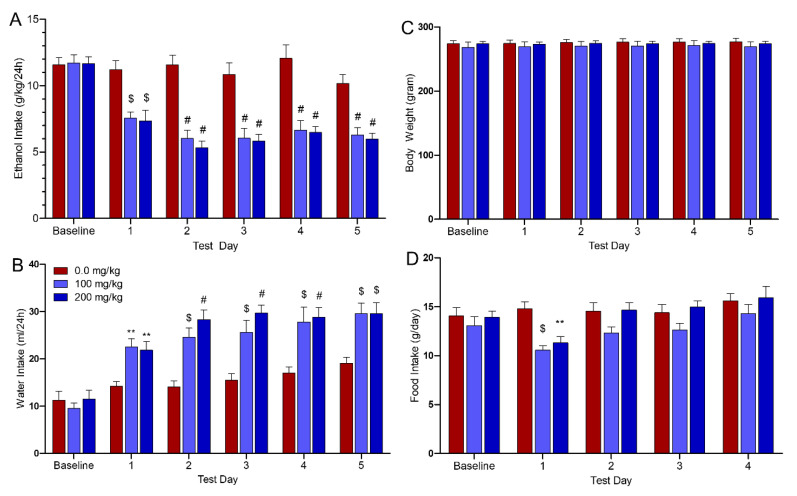
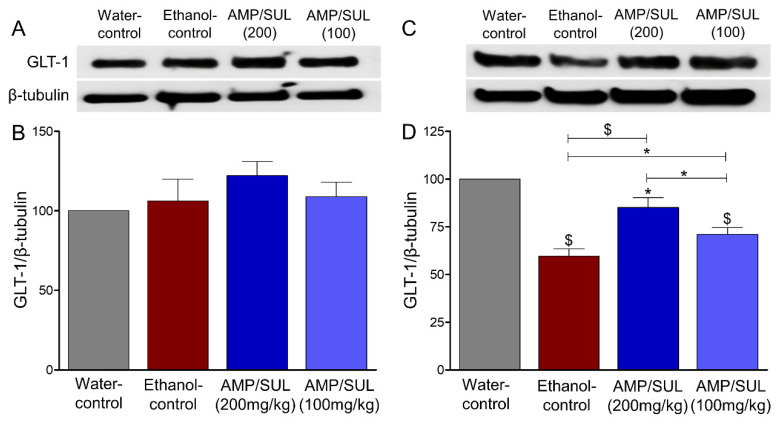
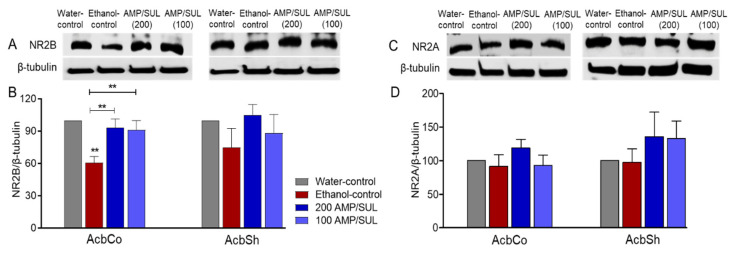
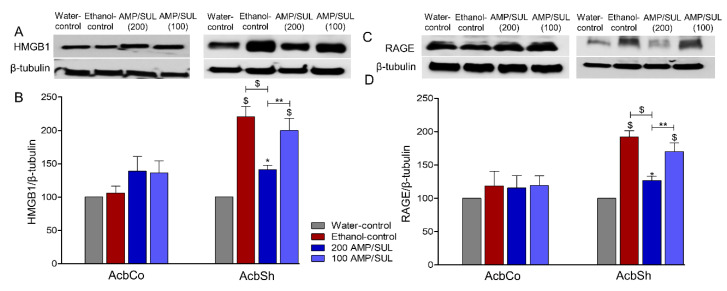
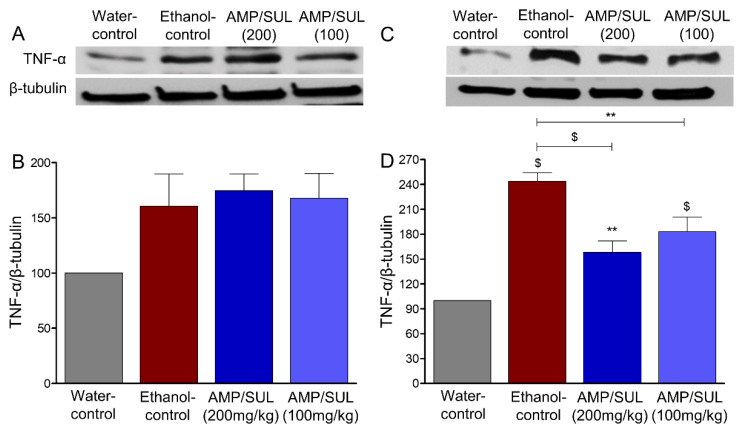
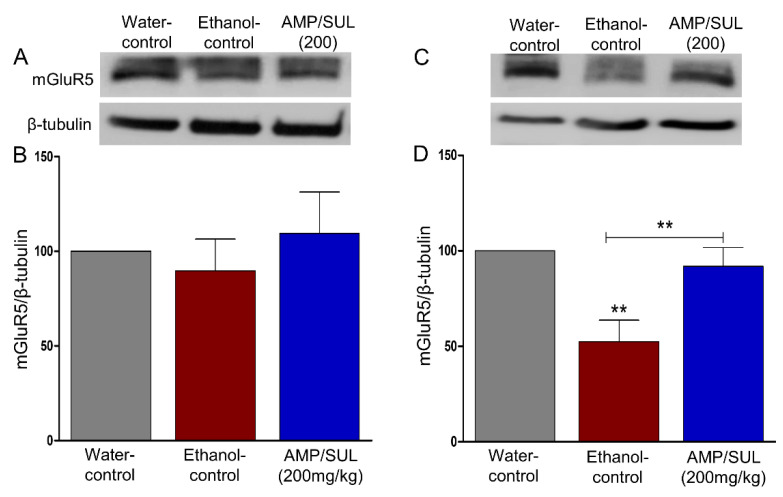
Exposure to ethanol commonly manifests neuroinflammation. Beta (β)-lactam antibiotics attenuate ethanol drinking through upregulation of astroglial glutamate transporters, especially glutamate transporter-1 (GLT-1), in the mesocorticolimbic brain regions, including the nucleus accumbens (Acb). However, the effect of β-lactam antibiotics on neuroinflammation in animals chronically exposed to ethanol has not been fully investigated. In this study, we evaluated the effects of ampicillin/sulbactam (AMP/SUL, 100 and 200 mg/kg, i.p.) on ethanol consumption in high alcohol drinking (HAD1) rats. Additionally, we investigated the effects of AMP/SUL on GLT-1 and N-methyl-d-aspartate (NMDA) receptor subtypes (NR2A and NR2B) in the Acb core (AcbCo) and Acb shell (AcbSh). We found that AMP/SUL at both doses attenuated ethanol consumption and restored ethanol-decreased GLT-1 and NR2B expression in the AcbSh and AcbCo, respectively. Moreover, AMP/SUL (200 mg/kg, i.p.) reduced ethanol-increased high mobility group box 1 (HMGB1) and receptor for advanced glycation end-products (RAGE) expression in the AcbSh. Moreover, both doses of AMP/SUL attenuated ethanol-elevated tumor necrosis factor-alpha (TNF-α) in the AcbSh. Our results suggest that AMP/SUL attenuates ethanol drinking and modulates NMDA receptor NR2B subunits and HMGB1-associated pathways.

Keywords: AMP/SUL; GLT-1; NMDA; ethanol; neuroinflammation.


Conflict of interest statement

The authors declare no conflicts of interest.

Figures

Figure 1
Figure 1
Effects of ampicillin/sulbactam (AMP/SUL) treatments (100 mg/kg and 200 mg/kg, i.p.) for five consecutive days on (A) Ethanol consumption (g/kg of average body weight/day), (B) Water intake (mL/day), (C) Body weight, and (D) Food intake. Statistical analyses revealed that AMP/SUL consistently reduced ethanol intake with a concomitant increase in water intake. However, there was an increase in water intake on Day 5 as compared to baseline (p < 0.01) in ethanol-control group. While food intake was transiently reduced on the 1st day of treatment, there were no other significant effects of AMP/SUL. In addition, AMP/SUL did not affect body weight. The values are expressed as mean ± SEM (n = 9/group), (* p < 0.05 and ** p < 0.01, $ p < 0.001 and # p < 0.0001).
Figure 2
Figure 2
Effects of AMP/SUL treatments (100 mg/kg and 200 mg/kg, i.p.) for five days on the expression of GLT-1 in the AcbCo and AcbSh. (A) Immunoblot of GLT-1 and β-tubulin in the AcbCo. (B) Quantitative analysis using one-way ANOVA followed by Newman-Keuls test indicated that there were no significant differences in the expression of GLT-1 among water-control, ethanol-control, ethanol-AMP/SUL (100 mg/kg), and ethanol-AMP/SUL (200 mg/kg) in the AcbCo. (C) Immunoblot of GLT-1 and β-tubulin in the AcbSh. (D) Quantitative analysis using one-way ANOVA followed by Newman-Keuls test indicated that there was a significant decrease in GLT-1 expression in the ethanol control group compared to water-control group, while post-treatments with AMP/SUL (100 and 200 mg/kg) upregulated GLT-1 expression compared to ethanol-control group in the AcbSh. Ethanol-AMP/SUL (100 and 200 mg/kg) groups had lower GLT-1 expression compared to water-control group. The symbol of statistical significance between any group and water-control group is shown on the bar of the group. Water-control group data were represented as 100% (relative to water-control). The values are expressed as mean ± SEM (n = 5/group), (* p < 0.05, ** p < 0.01 and $ p < 0.001).
Figure 3
Figure 3
Effects of AMP/SUL treatments (100 mg/kg and 200 mg/kg, i.p.) for five days on the expression of NR2B and NR2A in the AcbCo and AcbSh. (A) Immunoblot of NR2B and β-tubulin in the AcbCo and AcbSh. (B) Quantitative analysis using one-way ANOVA followed by Newman-Keuls test indicated that there was a significant decrease in the NR2B expression in the ethanol-control group compared to the water-control group, while post-treatments with AMP/SUL (100 and 200 mg/kg) for five days normalized NR2B expression in the AcbCo. Quantitative analysis using one-way ANOVA followed by Newman-Keuls test indicated that there were no significant differences in the expression of NR2B among the water-control, ethanol-control, ethanol-AMP/SUL (100 mg/kg), and ethanol-AMP/SUL (200 mg/kg) in the AcbSh. (C) Immunoblot of NR2A and β-tubulin in the AcbCo and AcbSh. (D) Quantitative analysis using one-way ANOVA followed by Newman-Keuls test indicated that there were no significant differences in the expression of NR2A between water-control, ethanol-control, ethanol-AMP/SUL (100 mg/kg), and ethanol-AMP/SUL (200 mg/kg) in the AcbCo. Quantitative analysis using one-way ANOVA followed by Newman-Keuls test indicated that there were also no significant differences in the expression of NR2A among water-control, ethanol-control, ethanol-AMP/SUL (100 mg/kg), and ethanol-AMP/SUL (200 mg/kg) rats in the AcbSh. The symbol of statistical significance between any group and water-control group is shown on the bar of the group. Water-control group data were represented as 100% (relative to water-control). The values are expressed as mean ± SEM (n = 5/group), (** p < 0.01).
Figure 4
Figure 4
Effects of AMP/SUL treatments (100 mg/kg and 200 mg/kg, i.p.) for five days on the expression of HMGB1 in the AcbCo and AcbSh. (A) Immunoblot of HMGB1 and β-tubulin in the AcbCo and AcbSh. (B) Quantitative analysis using one-way ANOVA followed by Newman-Keuls test indicated that there were no significant differences in the expression of HMGB1 among the water-control, ethanol-control, ethanol-AMP/SUL (100 mg/kg), and ethanol-AMP/SUL (200 mg/kg) groups in the AcbCo. Quantitative analysis using one-way ANOVA followed by Newman-Keuls test indicated that there was a significant increase in HMGB1 expression in the ethanol-control group compared to water-control group, while post-treatment with AMP/SUL (200 mg/kg, but not 100 mg/kg) for five days normalized HMGB1 expression in the AcbSh. Ethanol-AMP/SUL (100 and 200 mg/kg) groups had higher HMGB1 expression compared to water-control group. (C) Immunoblot of RAGE and β-tubulin in the AcbCo and AcbSh. (D) Quantitative analysis using one-way ANOVA followed by Newman-Keuls test indicated that there were no significant differences in the expression of RAGE among the water-control, ethanol-control, ethanol-AMP/SUL (100 mg/kg), and ethanol-AMP/SUL (200 mg/kg) groups in the AcbCo. Quantitative analysis using one-way ANOVA followed by Newman-Keuls test indicated that there was a significant increase in RAGE expression in the ethanol-control group compared to the water-control group, while post-treatment with AMP/SUL (200 mg/kg, but not 100 mg/kg) for five days decreased RAGE expression in the AcbSh. Ethanol-AMP/SUL (100 and 200 mg/kg) groups had higher RAGE expression compared to water-control group. The symbol of statistical significance between any group and water-control group is shown on the bar of the group. Water-control group data were represented as 100% (relative to water-control). The values are expressed as mean ± SEM (n = 5/group), (* p < 0.05, ** p < 0.01 and $ p < 0.001).
Figure 5
Figure 5
Effects of AMP/SUL treatments (100 mg/kg and 200 mg/kg, i.p.) for five days on the expression of TNF-α in the AcbCo and AcbSh. (A) Immunoblot of TNF-α and β-tubulin in the AcbCo. (B) Quantitative analysis using one-way ANOVA followed by Newman-Keuls test indicated that there were no significant differences in the expression of TNF-α among water-control, ethanol-control, ethanol-AMP/SUL (100 mg/kg), and ethanol-AMP/SUL (200 mg/kg) rats in the AcbCo. (C) Immunoblot of TNF-α and β-tubulin in the AcbSh. (D) Quantitative analysis using one-way ANOVA followed by Newman-Keuls test indicated that there was a significant increase in the TNF-α expression in the ethanol control group compared to the water-control group, while post-treatment with AMP/SUL (100 and 200 mg/kg) for five days decreased TNF-α expression in the AcbSh. Ethanol-AMP/SUL (100 and 200 mg/kg) groups had higher TNF-α expression compared to water-control group. The symbol of statistical significance between any group and water-control group is shown on the bar of the group. Water-control group data were represented as 100% (relative to water-control). The values are expressed as mean ± SEM (n = 5/group), (** p < 0.01 and $ p < 0.001).
Figure 6
Figure 6
Effects of AMP/SUL treatments (200 mg/kg, i.p.) for five days on the expression of mGluR5 in the AcbCo and AcbSh. (A) Immunoblot of mGluR5 and β-tubulin in the AcbCo. (B) Quantitative analysis using one-way ANOVA followed by Newman-Keuls test indicated that there were no significant differences in the expression of mGluR5 among water-control, ethanol-control, and ethanol-AMP/SUL (200 mg/kg) groups in the AcbCo. (C) Immunoblot of mGluR5 and β-tubulin in the AcbSh. (D) Quantitative analysis using one-way ANOVA followed by Newman-Keuls test indicated that there was a significant decrease in the mGluR5 expression in the ethanol-control group compared to the water-control group, while post-treatment with AMP/SUL (200 mg/kg) for five days increased mGluR5 expression in the AcbSh. The symbol of statistical significance between any group and water-control group is shown on the bar of the group. Water-control group data were represented as 100% (relative to water-control). The values are expressed as mean ± SEM (n = 5/group), (** p < 0.01).

References

    1. World Health Organization . Global Status Report on Alcohol and Health 2018. World Health Organization; Geneva, Switzerland: 2018.
    1. Goodwani S., Rao P.S., Bell R.L., Sari Y. Amoxicillin and amoxicillin/clavulanate reduce ethanol intake and increase GLT-1 expression as well as AKT phosphorylation in mesocorticolimbic regions. Brain Res. 2015;1622:397–408. doi: 10.1016/j.brainres.2015.07.008. - DOI - PMC - PubMed
    1. Das S.C., Yamamoto B.K., Hristov A.M., Sari Y. Ceftriaxone attenuates ethanol drinking and restores extracellular glutamate concentration through normalization of GLT-1 in nucleus accumbens of male alcohol-preferring rats. Neuropharmacology. 2015;97:67–74. doi: 10.1016/j.neuropharm.2015.05.009. - DOI - PMC - PubMed
    1. Ding Z.M., Rodd Z.A., Engleman E.A., Bailey J.A., Lahiri D.K., McBride W.J. Alcohol drinking and deprivation alter basal extracellular glutamate concentrations and clearance in the mesolimbic system of alcohol-preferring (P) rats. Addict. Biol. 2013;18:297–306. doi: 10.1111/adb.12018. - DOI - PMC - PubMed
    1. Griffin W.C., III, Haun H.L., Hazelbaker C.L., Ramachandra V.S., Becker H.C. Increased extracellular glutamate in the nucleus accumbens promotes excessive ethanol drinking in ethanol dependent mice. Neuropsychopharmacology. 2014;39:707–717. doi: 10.1038/npp.2013.256. - DOI - PMC - PubMed

Publication types

MeSH terms