. 2020 Jul 11;25(14):3176.
doi: 10.3390/molecules25143176.

Fabrication and Plasma Surface Activation of Aligned Electrospun PLGA Fiber Fleeces with Improved Adhesion and Infiltration of Amniotic Epithelial Stem Cells Maintaining their Teno-inductive Potential

Affiliations

Fabrication and Plasma Surface Activation of Aligned Electrospun PLGA Fiber Fleeces with Improved Adhesion and Infiltration of Amniotic Epithelial Stem Cells Maintaining their Teno-inductive Potential

Mohammad El Khatib et al. Molecules. .

Abstract

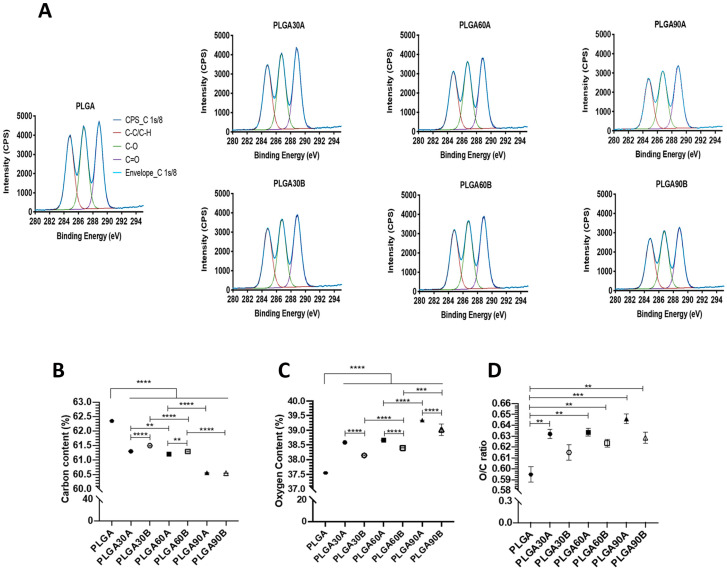
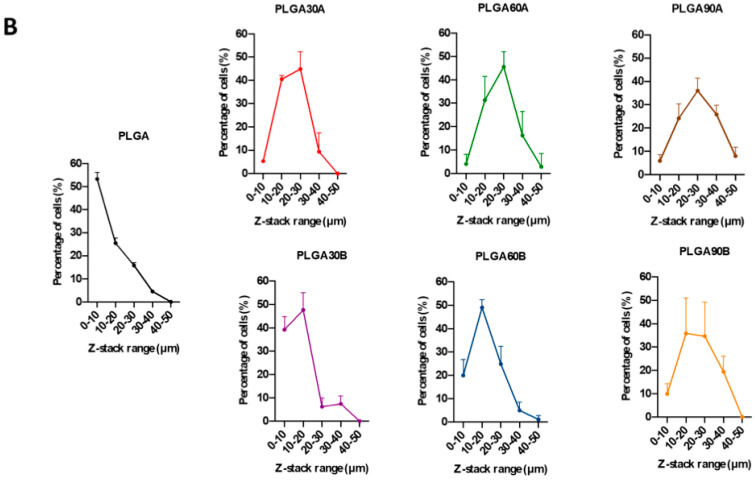
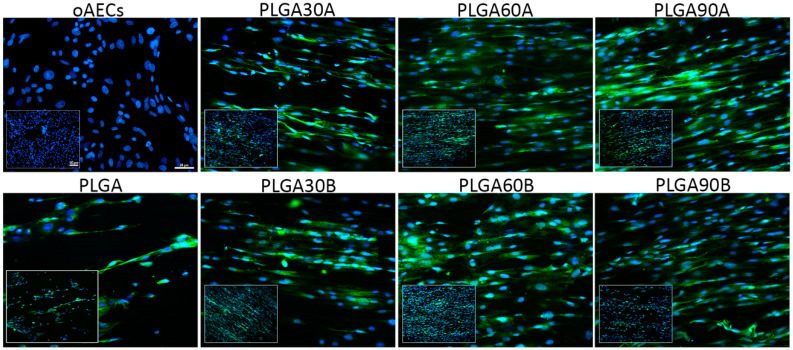
Electrospun PLGA microfibers with adequate intrinsic physical features (fiber alignment and diameter) have been shown to boost teno-differentiation and may represent a promising solution for tendon tissue engineering. However, the hydrophobic properties of PLGA may be adjusted through specific treatments to improve cell biodisponibility. In this study, electrospun PLGA with highly aligned microfibers were cold atmospheric plasma (CAP)-treated by varying the treatment exposure time (30, 60, and 90 s) and the working distance (1.3 and 1.7 cm) and characterized by their physicochemical, mechanical and bioactive properties on ovine amniotic epithelial cells (oAECs). CAP improved the hydrophilic properties of the treated materials due to the incorporation of new oxygen polar functionalities on the microfibers' surface especially when increasing treatment exposure time and lowering working distance. The mechanical properties, though, were affected by the treatment exposure time where the optimum performance was obtained after 60 s. Furthermore, CAP treatment did not alter oAECs' biocompatibility and improved cell adhesion and infiltration onto the microfibers especially those treated from a distance of 1.3 cm. Moreover, teno-inductive potential of highly aligned PLGA electrospun microfibers was maintained. Indeed, cells cultured onto the untreated and CAP treated microfibers differentiated towards the tenogenic lineage expressing tenomodulin, a mature tendon marker, in their cytoplasm. In conclusion, CAP treatment on PLGA microfibers conducted at 1.3 cm working distance represent the optimum conditions to activate PLGA surface by improving their hydrophilicity and cell bio-responsiveness. Since for tendon tissue engineering purposes, both high cell adhesion and mechanical parameters are crucial, PLGA treated for 60 s at 1.3 cm was identified as the optimal construct.

Keywords: PLGA; aligned microfibers; amniotic epithelial stem cells; cold atmospheric plasma; electrospinning; exposure time; tendon tissue engineering; working distance.


Conflict of interest statement

The authors declare that the research was conducted in the absence of any commercial or financial relationships that could be construed as a potential conflict of interest.

Figures

Figure 1
Figure 1
Experimental design of electrospun PLGA microfibers fabrication and Cold Atmospheric Plasma (CAP) performance. (“d” is the distance between the needle and the collector in the electrospinning process machine (left) and the distance between the plasma handled device and the collector during the plasma treatment process (right)).
Figure 2
Figure 2
(A) SEM investigations of the untreated and plasma-treated electrospun microfibers and the distribution of the fiber orientation. The SEM images showed that the CAP treatment did not affect the morphology neither the alignment of the electrospun microfibers (p > 0.05). The insets represent the histograms of each sample showing the angle distribution of the electrospun fibers on untreated and CAP treated PLGA samples. It can be noticed that fiber alignment after CAP treatment, by varying the plasma process’ parameters (exposure time and working distance), was maintained as the curves obtained from the analyses showed a sharp Gaussian curve confirming the aligned topography of the microfibers. Scale bars = 10 mm. (B) Infrared spectra for untreated and CAP treated PLGA microfibers at different exposure times (30, 60, and 90 s) and working distances (1.3 and 1.7 cm) reported in the 650 and 4000 cm−1. (C) Molar mass distribution of untreated and CAP treated electrospun PLGA microfibers.
Figure 2
Figure 2
(A) SEM investigations of the untreated and plasma-treated electrospun microfibers and the distribution of the fiber orientation. The SEM images showed that the CAP treatment did not affect the morphology neither the alignment of the electrospun microfibers (p > 0.05). The insets represent the histograms of each sample showing the angle distribution of the electrospun fibers on untreated and CAP treated PLGA samples. It can be noticed that fiber alignment after CAP treatment, by varying the plasma process’ parameters (exposure time and working distance), was maintained as the curves obtained from the analyses showed a sharp Gaussian curve confirming the aligned topography of the microfibers. Scale bars = 10 mm. (B) Infrared spectra for untreated and CAP treated PLGA microfibers at different exposure times (30, 60, and 90 s) and working distances (1.3 and 1.7 cm) reported in the 650 and 4000 cm−1. (C) Molar mass distribution of untreated and CAP treated electrospun PLGA microfibers.
Figure 3
Figure 3
(A) The deconvoluted C1s XPS spectra of the untreated and CAP treated electrospun PLGA microfibers with different process’ parameters. Atomic content of (B) carbon, (C) oxygen and (D) O/C ratio obtained by XPS technique for the untreated and CAP treated PLGA microfibers. Bonds percentages of the C1s deconvolution regarding (E) C-C/C-H, (F) C-O and (G) C=O obtained by XPS technique for the untreated and CAP treated PLGA microfibers. (H) Changes in the Water contact angles (WCA) between untreated and CAP treated PLGA microfibers by varying the exposure time and working distance. (I) Ageing analysis to assess the stability of the CAP treated PLGA microfibers between day 0 and day 14. *, **, ***, and **** Statistically significant between the groups (p < 0.05, p < 0.01, p < 0.001, and p < 0.0001, respectively).
Figure 3
Figure 3
(A) The deconvoluted C1s XPS spectra of the untreated and CAP treated electrospun PLGA microfibers with different process’ parameters. Atomic content of (B) carbon, (C) oxygen and (D) O/C ratio obtained by XPS technique for the untreated and CAP treated PLGA microfibers. Bonds percentages of the C1s deconvolution regarding (E) C-C/C-H, (F) C-O and (G) C=O obtained by XPS technique for the untreated and CAP treated PLGA microfibers. (H) Changes in the Water contact angles (WCA) between untreated and CAP treated PLGA microfibers by varying the exposure time and working distance. (I) Ageing analysis to assess the stability of the CAP treated PLGA microfibers between day 0 and day 14. *, **, ***, and **** Statistically significant between the groups (p < 0.05, p < 0.01, p < 0.001, and p < 0.0001, respectively).
Figure 4
Figure 4
Mechanical properties (A) Ultimate Tensile Strength, (B) Elongation at break, and (C) Young’s Modulus of the untreated and CAP treated PLGA microfibers. *, ** and *** Statistically significant between the groups (p < 0.05, p < 0.01, and p < 0.001, respectively).
Figure 5
Figure 5
Ovine amniotic epithelial stem cell (oAECs) viability on Petri dishes, untreated and CAP treated electrospun PLGA microfibers. (A) Representative images of oAECs survival on Petri dishes, untreated PLGA and CAP treated PLGA microfibers stained with Calcein AM/propidium iodide stains (green and red fluorescence, respectively) after 48 h of culture. Nuclei were counterstained with Hoechst 3342 (blue fluorescence). In these figures the red channel (TRITC) is not shown since the stained cells were all negative to propidium iodide (dead cell marker, red fluorescence) confirming the high vitality of oAECs within the different groups of PLGA microfibers; scale bar = 50 µm. (B) Representative image showing few red dead nuclei (propidium iodide, red fluorescence) in electrospun PLGA microfibers. (C) Histogram showing oAECs viability of cells cultured on Petri dish (oAECs), seeded on untreated PLGA (PLGA) and different CAP treated PLGA microfibers, after 24 h and 48 h days of culture. All untreated and CAP treated PLGA microfibers are biocompatible for oAECs since no statistical difference was evident among the different groups (p > 0.05); (n = 3 for each type of fleece/time point, fleece size: 15 mm × 7 mm).
Figure 6
Figure 6
Ovine amniotic epithelial stem cell (oAECs) distribution on untreated and treated PLGA microfibers. (A) On the left, representative images assessing oAECs positivity to phalloidin stain (red fluorescence) in oAECs cultured on Petri dishes (scale bar = 50 µm) or on untreated (PLGA) and different CAP treated PLGA (PLGA30A, PLGA30B, PLGA60A, PLGA60B, PLGA90A and PLGA90B) microfibers after 48 h of culture. On the right, phalloidin marked cells were analyzed with the MaxIP. Representative XY confocal images showing oAECs distribution within untreated (PLGA) and different type of CAP treated PLGA microfibers. The depth coded MaxIP analysis was used to assess cell penetration within the microfibers by defining the gradient color related to the direction of the cytoplasm of the cells. The purple color of the gradient scale refers to the surface of the microfibers, while the red color is attributed to the bottom of the surface. Thus, the cytoplasm of the most superficial cells is shown with a green color, whereas the cytoplasm of the cells localized at the bottom of the microfibers are shown in orange/red. It is evident that oAECs have an optimal distribution within the microfibers, especially in PLGA30A, PLGA30B, PLGA60A and PLGA90A. (B) Quantification of cell penetration. Cell penetration was quantified on depth coded MaxIP modified images. The Z-stack acquisitions were divided into 5 layers (10 µm each) (3 different fields/3 different samples/each group).
Figure 6
Figure 6
Ovine amniotic epithelial stem cell (oAECs) distribution on untreated and treated PLGA microfibers. (A) On the left, representative images assessing oAECs positivity to phalloidin stain (red fluorescence) in oAECs cultured on Petri dishes (scale bar = 50 µm) or on untreated (PLGA) and different CAP treated PLGA (PLGA30A, PLGA30B, PLGA60A, PLGA60B, PLGA90A and PLGA90B) microfibers after 48 h of culture. On the right, phalloidin marked cells were analyzed with the MaxIP. Representative XY confocal images showing oAECs distribution within untreated (PLGA) and different type of CAP treated PLGA microfibers. The depth coded MaxIP analysis was used to assess cell penetration within the microfibers by defining the gradient color related to the direction of the cytoplasm of the cells. The purple color of the gradient scale refers to the surface of the microfibers, while the red color is attributed to the bottom of the surface. Thus, the cytoplasm of the most superficial cells is shown with a green color, whereas the cytoplasm of the cells localized at the bottom of the microfibers are shown in orange/red. It is evident that oAECs have an optimal distribution within the microfibers, especially in PLGA30A, PLGA30B, PLGA60A and PLGA90A. (B) Quantification of cell penetration. Cell penetration was quantified on depth coded MaxIP modified images. The Z-stack acquisitions were divided into 5 layers (10 µm each) (3 different fields/3 different samples/each group).
Figure 7
Figure 7
Cellularity and Proliferation index (PI) of untreated and treated PLGA microfibers. (A) Cellularity quantified within the analyzed PLGA microfibers, expressed as the total number of nuclei (DAPI stained) in a field of × 400 magnification after 24 h and 48 h of culture. (B) Proliferation index (PI) of oAECs cultured on Petri dishes (oAECs) or within the analyzed untreated (PLGA) or treated CAP samples. (C) Representative images of oAECs within the analyzed PLGA microfibers and Petri dishes showing Ki-67 positivity (green fluorescence) and cell nuclei counterstained in blue (DAPI); Scale bars = 50 μm. The insets show details of each sample (white arrows indicate the corresponding cells present in the insets at lower magnification) in which it is evident the co-localization of Ki-67 expression and nuclei (n = 3 for each type of sample/ time point, sample size: 15 mm × 7 mm). *, **, *** and **** Statistically different values between different studied groups for p < 0.05, p < 0.01, p < 0.001 and p < 0.0001, respectively.
Figure 7
Figure 7
Cellularity and Proliferation index (PI) of untreated and treated PLGA microfibers. (A) Cellularity quantified within the analyzed PLGA microfibers, expressed as the total number of nuclei (DAPI stained) in a field of × 400 magnification after 24 h and 48 h of culture. (B) Proliferation index (PI) of oAECs cultured on Petri dishes (oAECs) or within the analyzed untreated (PLGA) or treated CAP samples. (C) Representative images of oAECs within the analyzed PLGA microfibers and Petri dishes showing Ki-67 positivity (green fluorescence) and cell nuclei counterstained in blue (DAPI); Scale bars = 50 μm. The insets show details of each sample (white arrows indicate the corresponding cells present in the insets at lower magnification) in which it is evident the co-localization of Ki-67 expression and nuclei (n = 3 for each type of sample/ time point, sample size: 15 mm × 7 mm). *, **, *** and **** Statistically different values between different studied groups for p < 0.05, p < 0.01, p < 0.001 and p < 0.0001, respectively.
Figure 8
Figure 8
Teno-inductive properties of untreated and CAP treated PLGA microfibers on AECs. Immunocytochemical analysis revealed TNMD protein expression (green fluorescence) in oAECs seeded onto untreated and CAP treated PLGA microfibers after 24 h; whereas cells cultured on Petri dishes do not express this protein. DAPI (blue fluorescence) counterstained nuclei. Positivity to TNMD was evident in the cytoplasm of the oAECs. Scale bars = 20 μm. Insets show the same images at a lower magnification; scale bars = 50 µm; (n = 3 for each type of sample/ time point, sample size: 15 mm × 7 mm).

References

    1. Lomas A.J., Ryan C.N.M., Sorushanova A., Shologu N., Sideri A.I., Tsioli V., Fthenakis G.C., Tzora A., Skoufos I., Quinlan L.R., et al. The past, present and future in scaffold-based tendon treatments. Adv. Drug Deliv. Rev. 2015;84:257–277. doi: 10.1016/j.addr.2014.11.022. - DOI - PubMed
    1. Longo U.G., Lamberti A., Petrillo S., Maffulli N., Denaro V. Scaffolds in tendon tissue engineering. Stem Cells Int. 2012;2012:1–8. doi: 10.1155/2012/517165. - DOI - PMC - PubMed
    1. Abbah S.A., Spanoudes K., O’Brien T., Pandit A., Zeugolis D.I. Assessment of stem cell carriers for tendon tissue engineering in pre-clinical models. Stem Cell Res. Ther. 2014;5:38. doi: 10.1186/scrt426. - DOI - PMC - PubMed
    1. Klepps S., Bishop J., Lin J., Cahlon O., Strauss A., Hayes P., Flatow E.L. Prospective evaluation of the effect of rotator cuff integrity on the outcome of open rotator cuff repairs. Am. J. Sports Med. 2004;32:1716–1722. doi: 10.1177/0363546504265262. - DOI - PubMed
    1. Krueger-Franke M., Siebert C.H., Scherzer S. Surgical treatment of ruptures of the Achilles tendon: A review of long-term results. Br. J. Sports Med. 1995;29:121–125. doi: 10.1136/bjsm.29.2.121. - DOI - PMC - PubMed

Substances