. 2020 Jul 14;21(1):482.
doi: 10.1186/s12864-020-06832-3.

Seamless integration of image and molecular analysis for spatial transcriptomics workflows

Affiliations

Seamless integration of image and molecular analysis for spatial transcriptomics workflows

Joseph Bergenstråhle et al. BMC Genomics. .

Abstract

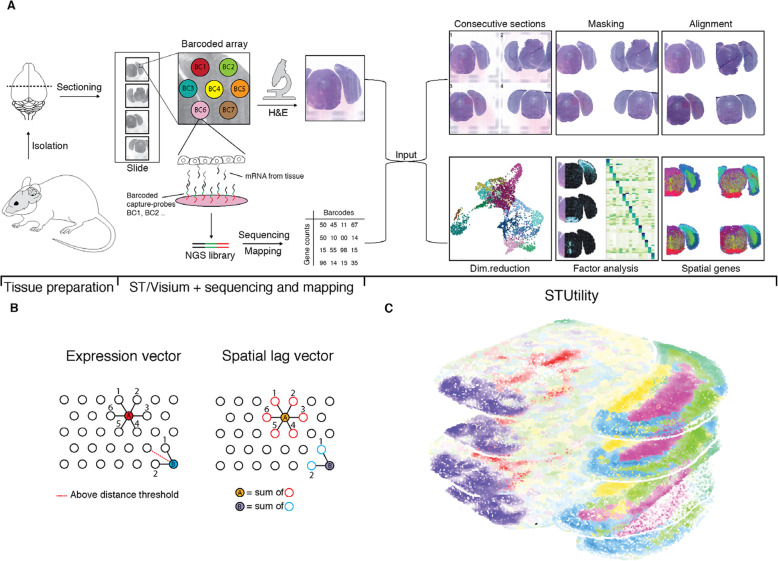
Background: Recent advancements in in situ gene expression technologies constitute a new and rapidly evolving field of transcriptomics. With the recent launch of the 10x Genomics Visium platform, such methods have started to become widely adopted. The experimental protocol is conducted on individual tissue sections collected from a larger tissue sample. The two-dimensional nature of this data requires multiple consecutive sections to be collected from the sample in order to construct a comprehensive three-dimensional map of the tissue. However, there is currently no software available that lets the user process the images, align stacked experiments, and finally visualize them together in 3D to create a holistic view of the tissue.

Results: We have developed an R package named STUtility that takes 10x Genomics Visium data as input and provides features to perform standardized data transformations, alignment of multiple tissue sections, regional annotation, and visualizations of the combined data in a 3D model framework.

Conclusions: STUtility lets the user process, analyze and visualize multiple samples of spatially resolved RNA sequencing and image data from the 10x Genomics Visium platform. The package builds on the Seurat framework and uses familiar APIs and well-proven analysis methods. An introduction to the software package is available at https://ludvigla.github.io/STUtility_web_site/ .

Keywords: 3D; Data analysis; Genomics; Image processing; R-package; Software; Spatial transcriptomics; Transcriptomics; Visualization.


Conflict of interest statement

J.L is a scientific advisor at 10x Genomics Inc., which holds IP rights to the ST technology.

Figures

Fig. 1
Fig. 1
Schematic overview of the procedure, from tissue collection to final visualization of the data analysis results. a Thin tissue sections are placed on the ST/Visium array. Barcoded capture-probes store spatial information which is added to the captured transcript prior to sequencing. Imaging data is obtained by microscopy of stained tissue sections. The sequencing data is used as input to demultiplexing and transcript quantification pipelines. The count data together with the image data are used as inputs to STUtility. Image processing (including masking and alignment), and all further data analysis (e.g. dimensionality reduction, factor analysis, identification of spatially correlated genes) is conducted within R. b Spatial autocorrelation. Two vectors are defined: (i) the original expression vector for each gene and each capture-spot and (ii) the Spatial lag expression vector, which for each capture-spot and gene takes the summed expression of up to six neighbors. Spatial autocorrelation is defined as the Pearson correlation between the two vectors (i) and (ii) with the rationale that genes with spatial structure will display a higher correlation to their neighbors. c The aligned images can be visualized in a turntable 3D model within R in which a combination of features can be visualized. Here, the NMF factors of the tissue are shown in the HSV color scale
Fig. 2
Fig. 2
Spatial analysis of sagittal mouse brain and human breast cancer samples. a NMF identifies multiple spatially distinct factors within the mouse brain (4 separate tissue sections) that are visualized in the HSV color scale. b Visualization of driver genes of some of the NMF factors seen in (a). c NMF factor with clear histological relevance corresponding to a tumor area within the breast cancer samples. d Example of a top-ranking gene, Fth1, according to the proposed spatial autocorrelation metric performed on two adjacent sections to increase the robustness of the analysis. e NMF factors were clustered in Seurat, and capture-spots neighboring to one of the tumor clusters were automatically extracted by STUtility (left) for a differential expression analysis between core and tumor edge. The core and tumor edge display significant differences in expression of various immunoglobulin and Extracellular Matrix (ECM) related genes (right)

References

    1. Ståhl PL, Salmén F, Vickovic S, Lundmark A, Navarro JF, Magnusson J, Giacomello S, Asp M, Westholm JO, Huss M, et al. Visualization and analysis of gene expression in tissue sections by spatial transcriptomics. Science. 2016;353:78–82. doi: 10.1126/science.aaf2403. - DOI - PubMed
    1. Maniatis S, Äijö T, Vickovic S, Braine C, Kang K, Mollbrink A, Fagegaltier D, Andrusivová Ž, Saarenpää S, Saiz-Castro G, et al. Spatiotemporal dynamics of molecular pathology in amyotrophic lateral sclerosis. Science. 2019;364:89–93. doi: 10.1126/science.aav9776. - DOI - PubMed
    1. Asp M, Giacomello S, Larsson L, Wu C, Fürth D, Qian X, Wärdell E, Custodio J, Reimegård J, Salmén F, et al. A spatiotemporal organ-wide gene expression and cell atlas of the developing human heart. Cell. 2019;179:1647–1660.e1619. doi: 10.1016/j.cell.2019.11.025. - DOI - PubMed
    1. Svensson V, Teichmann SA, Stegle O. SpatialDE: identification of spatially variable genes. Nat Methods. 2018;15:343–346. doi: 10.1038/nmeth.4636. - DOI - PMC - PubMed
    1. Queen R, Cheung K, Lisgo S, Coxhead J, Cockell S. Spaniel: analysis and interactive sharing of spatial transcriptomics data. bioRxiv. 2019:619197..

LinkOut - more resources