

Early epidemiological assessment of the transmission potential and virulence of coronavirus disease 2019 (COVID-19) in Wuhan City, China, January-February, 2020
- PMID: 32664866
- PMCID: PMC7360469
- DOI: 10.1186/s12916-020-01691-x
Early epidemiological assessment of the transmission potential and virulence of coronavirus disease 2019 (COVID-19) in Wuhan City, China, January-February, 2020
Abstract
Background: Since the first cluster of cases was identified in Wuhan City, China, in December 2019, coronavirus disease 2019 (COVID-19) rapidly spreads globally. Scientists have made strides in estimating key transmission and epidemiological parameters. In particular, accumulating evidence points to a substantial fraction of asymptomatic or subclinical infections, which influences our understanding of the transmission potential and severity of this emerging disease. In this study, we derive estimates of the transmissibility and virulence of COVID-19 in Wuhan City, China, by reconstructing the underlying transmission dynamics using multiple data sources.
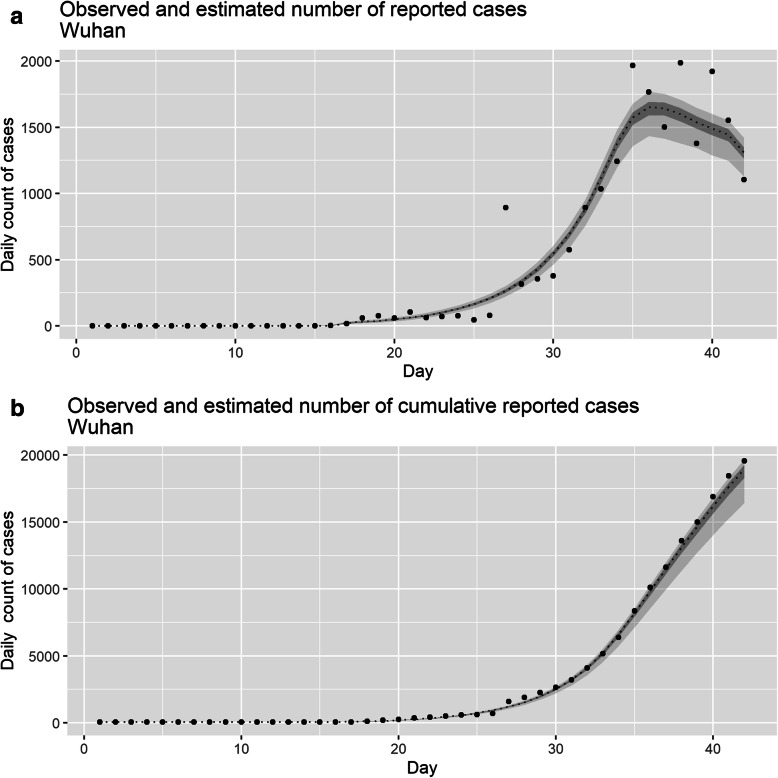
Methods: We employ statistical methods and publicly available epidemiological datasets to jointly derive estimates of transmissibility and severity associated with the novel coronavirus. For this purpose, the daily series of laboratory-confirmed COVID-19 cases and deaths in Wuhan City together with epidemiological data of Japanese repatriated from Wuhan City on board government-chartered flights were integrated into our analysis.
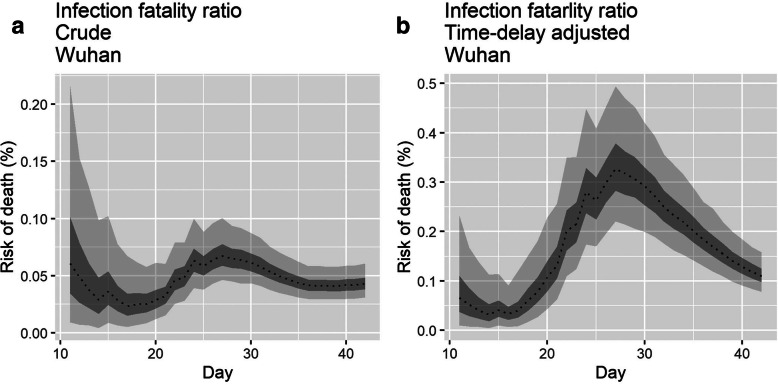
Results: Our posterior estimates of basic reproduction number (R) in Wuhan City, China, in 2019-2020 reached values at 3.49 (95% CrI 3.39-3.62) with a mean serial interval of 6.0 days, and the enhanced public health intervention after January 23 in 2020 was associated with a significantly reduced R at 0.84 (95% CrI 0.81-0.88), with the total number of infections (i.e., cumulative infections) estimated at 1,906,634 (95% CrI 1,373,500-2,651,124) in Wuhan City, elevating the overall proportion of infected individuals to 19.1% (95% CrI 13.5-26.6%). We also estimated the most recent crude infection fatality ratio (IFR) and time-delay adjusted IFR at 0.04% (95% CrI 0.03-0.06%) and 0.12% (95% CrI 0.08-0.17%), respectively, estimates that are substantially smaller than the crude CFR estimated at 4.06%.
Conclusions: We have estimated key epidemiological parameters of the transmissibility and virulence of COVID-19 in Wuhan, China, during January-February 2020 using an ecological modeling approach that is suitable to infer epidemiological parameters with quantified uncertainty from partial observations collected by surveillance systems. Our estimate of time-delay adjusted IFR falls in the range of the median IFR estimates based on multiple serological studies conducted in several areas of the world.
Keywords: COVID-19; China; Epidemic; Statistical model; Transmissibility.
Conflict of interest statement
The authors declare that they have no competing interests.
Figures

References
-
- Jon Cohen. Mining coronavirus genomes for clues to the outbreak’s origins. Science. 2020. https://www.sciencemag.org/news/2020/01/mining-coronavirus-genomes-clues.... Accessed 3 Feb 2020.
-
- World Health Organization (WHO). Novel coronavirus (2019-nCoV) situation reports. Available from: https://www.who.int/emergencies/diseases/novel-coronavirus-2019/situatio... Accessed, [cited 2020 May 10th ].
-
- The State Council, The People’s Republic of China. http://www.gov.cn/. [cited 2020 May 10th ].
Publication types
MeSH terms
Grants and funding
LinkOut - more resources
Full Text Sources
