

Oscillations in U.S. COVID-19 Incidence and Mortality Data Reflect Diagnostic and Reporting Factors
- PMID: 32665331
- PMCID: PMC7363007
- DOI: 10.1128/mSystems.00544-20
Oscillations in U.S. COVID-19 Incidence and Mortality Data Reflect Diagnostic and Reporting Factors
Abstract
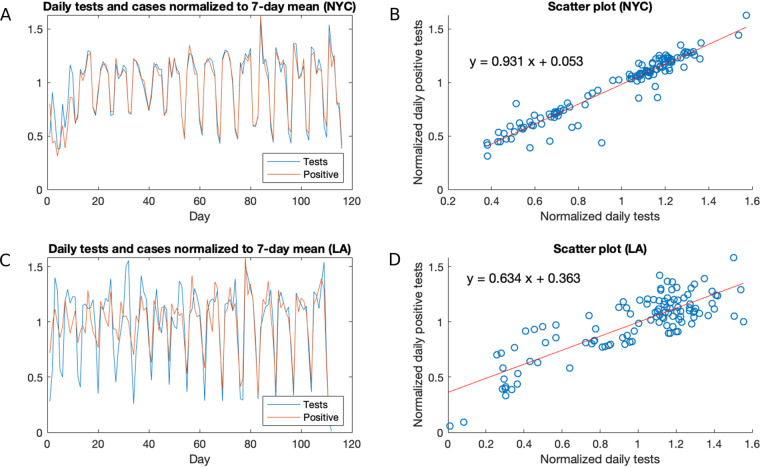
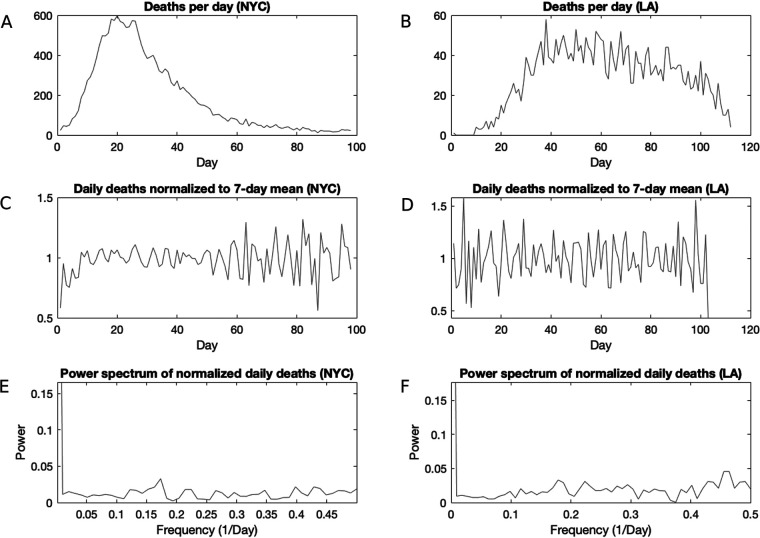
The coronavirus disease 2019 (COVID-19) pandemic currently in process differs from other infectious disease calamities that have previously plagued humanity in the vast amount of information that is produced each day, which includes daily estimates of the disease incidence and mortality data. Apart from providing actionable information to public health authorities on the trend of the pandemic, the daily incidence reflects the process of disease in a susceptible population and thus reflects the pathogenesis of COVID-19, the public health response, and diagnosis and reporting. Both new daily cases and daily mortality data in the United States exhibit periodic oscillatory patterns. By analyzing New York City (NYC) and Los Angeles (LA) testing data, we demonstrate that this oscillation in the number of cases can be strongly explained by the daily variation in testing. This seems to rule out alternative hypotheses, such as increased infections on certain days of the week, as driving this oscillation. Similarly, we show that the apparent oscillation in mortality in the U.S. data are mostly an artifact of reporting, which disappears in data sets that record death by episode date, such as the NYC and LA data sets. Periodic oscillations in COVID-19 incidence and mortality data reflect testing and reporting practices and contingencies. Thus, these contingencies should be considered first prior to suggesting biological mechanisms.IMPORTANCE The incidence and mortality data for the COVID-19 data in the United States show periodic oscillations, giving the curve a distinctive serrated pattern. In this study, we show that these periodic highs and lows in incidence and mortality data are due to daily differences in testing for the virus and death reporting, respectively. These findings are important because they provide an explanation based on public health practices and shortcomings rather than biological explanations, such as infection dynamics. In other words, when oscillations occur in epidemiological data, a search for causes should begin with how the public health system produces and reports the information before considering other causes, such as infection cycles and higher incidences of events on certain days. Our results suggest that when oscillations occur in epidemiological data, this may be a signal that there are shortcomings in the public health system generating that information.
Keywords: COVID-19; coronavirus; epidemiology.
Copyright © 2020 Bergman et al.
Figures

References
-
- Ricon-Becker I, Tarrasch R, Blinder P, Ben-Eliyahu S. 2020. A seven-day cycle in COVID-19 infection and mortality rates: are inter-generational social interactions on the weekends killing susceptible people? medRxiv https://www.medrxiv.org/content/10.1101/2020.05.03.20089508v1. - DOI
-
- Hotz T, Glock M, Heyder S, Semper S, Böhle A, Krämer A. 2020. Monitoring the spread of COVID-19 by estimating reproduction numbers over time. arXiv 200408557 https://arxiv.org/abs/2004.08557.
-
- Kulp AWNBJ. 2016. Characterization of time series data, p 131 In Skiadas CHSC. (ed), Applications of chaos theory. CRC Press, Boca Raton, FL.
Grants and funding
LinkOut - more resources
Full Text Sources
