. 2020 Jul 28;117(30):17727-17736.
doi: 10.1073/pnas.2002880117. Epub 2020 Jul 14.

Erythrocyte-driven immunization via biomimicry of their natural antigen-presenting function

Affiliations

Erythrocyte-driven immunization via biomimicry of their natural antigen-presenting function

Anvay Ukidve et al. Proc Natl Acad Sci U S A. .

Abstract

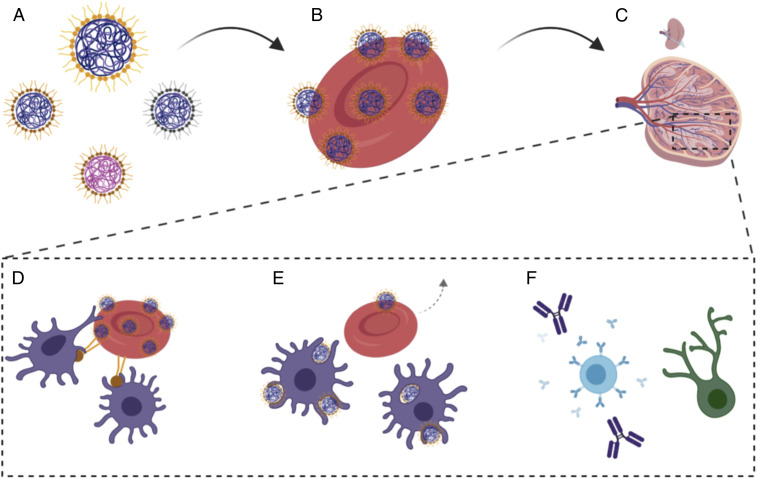
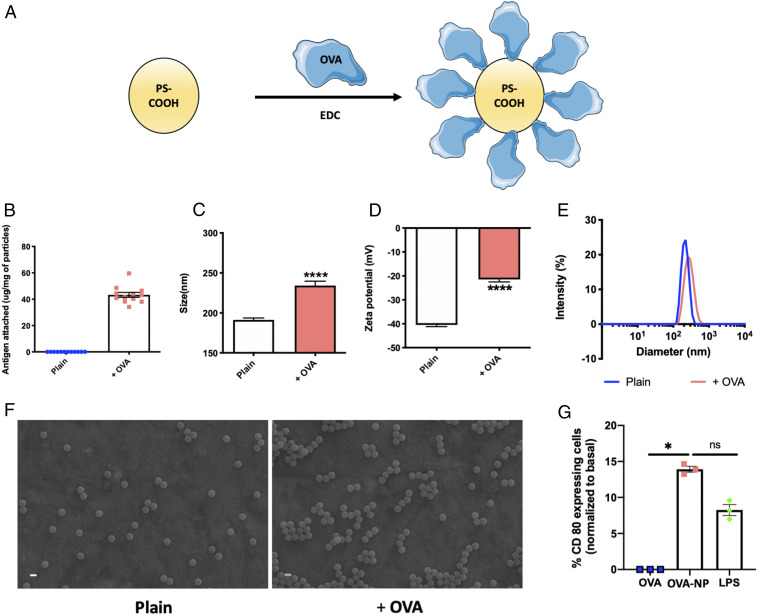
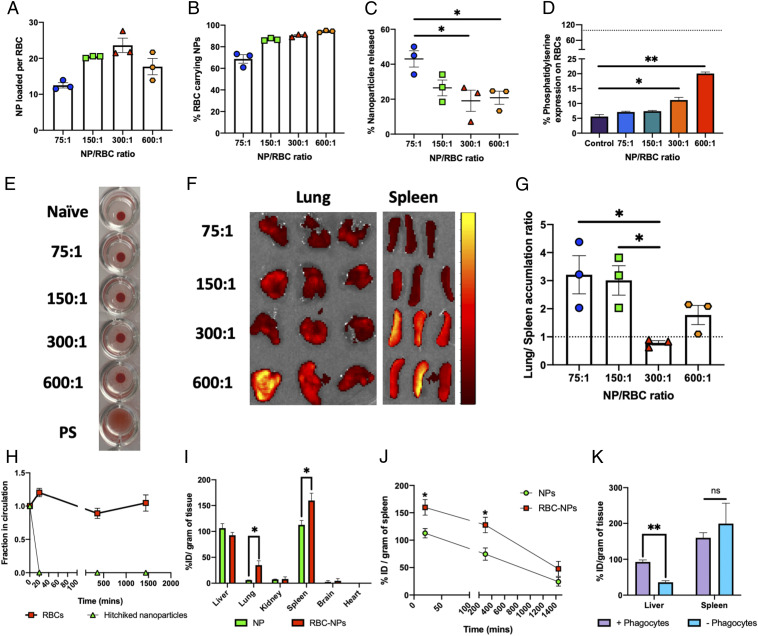
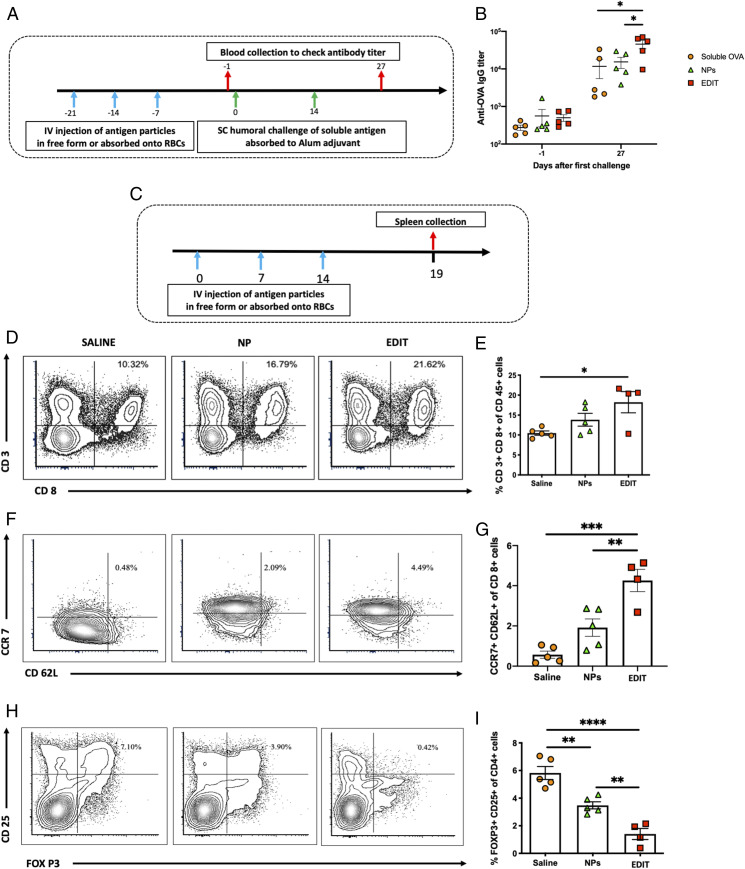
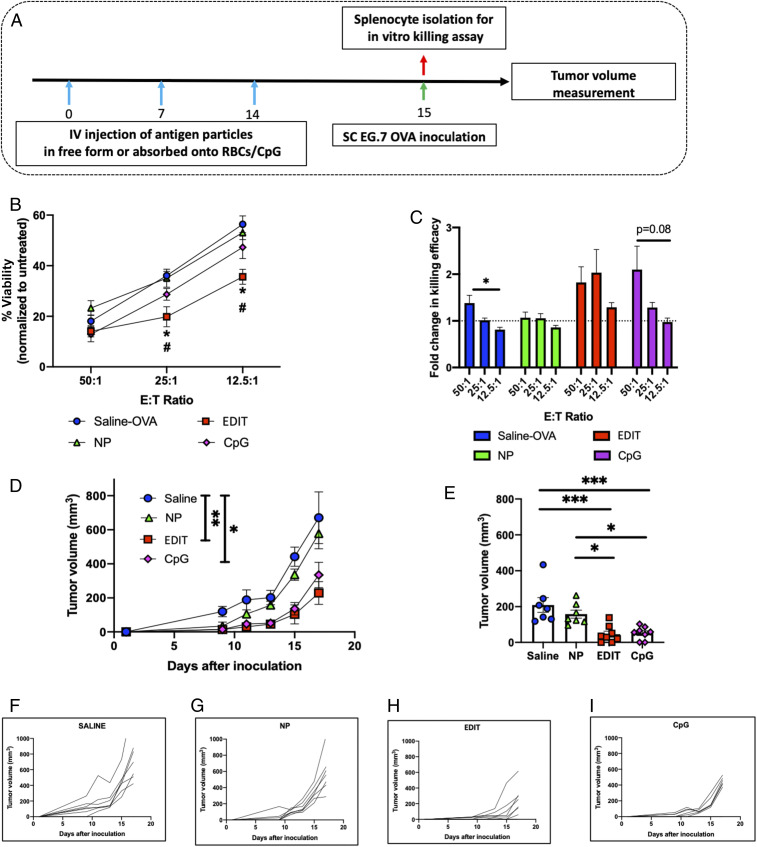
Erythrocytes naturally capture certain bacterial pathogens in circulation, kill them through oxidative stress, and present them to the antigen-presenting cells (APCs) in the spleen. By leveraging this innate immune function of erythrocytes, we developed erythrocyte-driven immune targeting (EDIT), which presents nanoparticles from the surface of erythrocytes to the APCs in the spleen. Antigenic nanoparticles were adsorbed on the erythrocyte surface. By engineering the number density of adsorbed nanoparticles, (i.e., the number of nanoparticles loaded per erythrocyte), they were predominantly delivered to the spleen rather than lungs, which is conventionally the target of erythrocyte-mediated delivery systems. Presentation of erythrocyte-delivered nanoparticles to the spleen led to improved antibody response against the antigen, higher central memory T cell response, and lower regulatory T cell response, compared with controls. Enhanced immune response slowed down tumor progression in a prophylaxis model. These findings suggest that EDIT is an effective strategy to enhance systemic immunity.

Keywords: biomimetic; erythrocyte hitchhiking; immunization; spleen targeting; vaccination.


Conflict of interest statement

Competing interest statement: A.U., Z.Z., and S.M. are inventors on a patent application that covers aspects of the technology described in this manuscript. The patent application is assigned to and managed by Harvard University.

Figures

Fig. 1.
Fig. 1.
Schematic for engineering a handoff of nanoparticles at the spleen via erythrocyte hitchhiking. (A) Protein-capped polymeric nanoparticles used for the study (different sizes, materials, or coated with different proteins). (B) The number of nanoparticles loaded on erythrocytes was tuned for protein loading and to induce temporary up-regulation of phosphatidylcholine. (C) Intravenous injection of hitchhiked nanoparticles leads to high discharge in the spleen. (D) Up-regulated phosphatidylcholine and masking CD47 improves interactions with antigen-presenting cells in the spleen. (E) Improved erythrocyte interactions facilitate nanoparticle uptake by the APCs while the erythrocytes return back to the circulation. (F) Handoff of nanoparticles at the spleen improves both humoral and cellular immune responses.
Fig. 2.
Fig. 2.
Characterization of protein-capped nanoparticles. (A) Scheme of protein attachment to polystyrene carboxylate nanoparticles using EDC chemistry. (B) Amount of antigen attached to PS-COOH (n = 12). (C) Particle size in nanometers of plain and protein-capped nanoparticles (n = 6). Significantly different (Student’s t test): ****P < 0.0001. (D) Zeta potential in millivolts of plain and protein-capped nanoparticles (n = 6). Significantly different (Student’s t test): ****P < 0.0001. (E) Particle size distribution of plain and protein-capped nanoparticles. (F) Scanning electron micrographs of plain and protein-capped nanoparticles. (Scale bars, 200 nm.) (G) Dendritic cell maturation evaluated in terms of % CD80 expression (normalized to basal expression) (n = 3 for all groups). Significantly different (one-way ANOVA followed by Tukey’s HSD test): *P < 0.05; ns, not significantly different. Data in BD and G are expressed as mean ± SEM.
Fig. 3.
Fig. 3.
Engineering nanoparticle–erythrocyte–hitchhiking parameters to achieve spleen targeting. (A) Nanoparticles loaded per erythrocyte for different feed ratios of nanoparticles to erythrocytes (n = 3 for all groups). (B) Percentage of erythrocytes carrying nanoparticles (determined by flow cytometry) for different feed ratios of nanoparticles to erythrocytes (n = 3 for all groups). (C) Percentage of nanoparticles released from erythrocytes following in vitro shear studies at the lung corresponding to shear stress (6 Pa). Significantly different (one-way ANOVA followed by Tukey’s HSD test): *P < 0.05. (D) Erythrocyte damage caused by nanoparticles, evaluated by changes in percentage of phosphatidylserine expression, for different feed ratios of nanoparticles to erythrocytes (n = 3 for all groups). The dotted line indicates positive-control (polystyrene beads) mean value. Significantly different (one-way ANOVA followed by Tukey’s HSD test): *P < 0.05, **P < 0.01. (E) Optical agglutination assay demonstrating minimal aggregates induced by nanoparticles to erythrocytes. All of the tested nanoparticle-to-erythrocyte ratios were similar to naïve control as opposed to polystyrene beads which induced matrix-shaped aggregates. (F) IVIS images of lungs and spleen harvested from mice 20 min after being injected with erythrocytes incubated at different nanoparticle-to-erythrocyte ratios. The scale indicates low (maroon) to high (bright yellow) radiant efficiency. (G) Lung-to-spleen accumulation ratios computed by using radiant efficiencies of these organs from IVIS imaging (n = 3 for all groups). The dotted line indicates equal lung and spleen accumulation. Significantly different (one-way ANOVA followed by Tukey’s HSD test): *P < 0.05. (H) Fraction of particles and erythrocytes remaining in circulation, evaluated by their parallel tracking using flow cytometry (n = 5). (I) Biodistribution of free nanoparticles and hitchhiked nanoparticles in different organs, expressed in terms of % injected dose per gram of tissue, harvested 20 min after injection (n = 3 for all groups). Significantly different (Student’s t test): *P < 0.05. (J) Kinetics of spleen accumulation of free and hitchhiked nanoparticles monitored over 24 h after injection (n = 3 for all groups). Significantly different (Student’s t test): *P < 0.05. (K) Effect of phagocyte depletion on hitchhiked nanoparticle biodistribution in the two most important organs of the mononuclear phagocytic system, 20 min after injection (n = 3 for all groups). Significantly different (Student’s t test): **P < 0.01. Data in AD and GJ are expressed as mean ± SEM.
Fig. 4.
Fig. 4.
Immunological consequences of nanoparticle spleen handoff. (A) Schedule for evaluating systemic antibody (humoral) responses of hitchhiked nanoparticles. (B) Anti-OVA IgG titer evaluated 1 d before the first immune challenge (day −1) and 13 d after the second immune challenge (day 27) (n = 5 for all groups). Significantly different (one-way ANOVA followed by Tukey’s HSD test): *P < 0.05. (C) Schedule for evaluating systemic cellular immune responses of hitchhiked nanoparticles. (D) Representative flow cytometry analysis images of CD3+ CD8+ cells in the spleen. (E) Quantitative analysis of the percentage of CD3+ CD8+ cells in the spleen (n = 4 for the EDIT group; n = 5 for all other groups). Significantly different (one-way ANOVA followed by Tukey’s HSD test): *P < 0.05. (F) Representative flow cytometry analysis images of CCR7+ CD62L+ cells in the spleen. (G) Quantitative analysis of the percentage of CCR7+ CD62L+ cells in the spleen (n = 4 for the EDIT group; n = 5 for all other groups). Significantly different (one-way ANOVA followed by Tukey’s HSD test): **P < 0.01, ***P < 0.001. (H) Representative flow cytometry analysis images of CD25+ FOXP3+ cells in the spleen. (I) Quantitative analysis of the percentage of CD25+ FOXP3+ cells in the spleen (n = 4 for the EDIT group; n = 5 for all other groups). Significantly different (one-way ANOVA followed by Tukey’s HSD test): *P < 0.05, **P < 0.01, ****P < 0.0001. Data in B, E, G, and I are expressed as mean ± SEM.
Fig. 5.
Fig. 5.
Therapeutic extension of immune modulation of hitchhiked nanoparticles for vaccination. (A) Schedule for prophylactic vaccination studies. (B) In vitro cell-killing data post immunization by various treatment groups evaluated as percent viability normalized to the untreated control at different effector-to-target ratios (n = 3 mice for all groups). Significantly different: saline OVA vs. EDIT and NPs vs. EDIT (one-way ANOVA followed by Tukey’s HSD test): *P < 0.05, #P < 0.05. (C) Fold change in in vitro cell-killing assay, comparison of fold change within each treatment group as a function of effector-to-target ratio (n = 3 mice for all groups). Significantly different (one-way ANOVA followed by Tukey’s HSD): *P < 0.05. (D) Tumor growth curves for mice inoculated after prophylactic vaccinations by different treatment groups. Statistical analysis within this figure was carried out on day 17. (E) Evaluation of tumor volumes for different groups on day 13. For D and E (n = 8 for the EDIT and CpG groups; n = 7 for the saline and NP groups), significant different (one-way ANOVA followed by Tukey’s HSD): *P < 0.05, **P < 0.01, ***P < 0.001. (FI) Tumor growth kinetics for individual mice in (F) saline, (G) NP, (H) EDIT, and (I) CpG treatment groups. Data in BE are expressed as mean ± SEM.

References

    1. Klei T. R., Meinderts S. M., van den Berg T. K., van Bruggen R., From the cradle to the grave: The role of macrophages in erythropoiesis and erythrophagocytosis. Front. Immunol. 8, 73 (2017). - PMC - PubMed
    1. Pishesha N. et al. ., Engineered erythrocytes covalently linked to antigenic peptides can protect against autoimmune disease. Proc. Natl. Acad. Sci. U.S.A. 114, 3157–3162 (2017). - PMC - PubMed
    1. Lorentz K. M., Kontos S., Diaceri G., Henry H., Hubbell J. A., Engineered binding to erythrocytes induces immunological tolerance to E. coli asparaginase. Sci. Adv. 1, e1500112 (2015). - PMC - PubMed
    1. Kontos S., Kourtis I. C., Dane K. Y., Hubbell J. A., Engineering antigens for in situ erythrocyte binding induces T-cell deletion. Proc. Natl. Acad. Sci. U.S.A. 110, E60–E68 (2013). - PMC - PubMed
    1. Anderson H. L., Brodsky I. E., Mangalmurti N. S., The evolving erythrocyte: Red blood cells as modulators of innate immunity. J. Immunol. 201, 1343–1351 (2018). - PMC - PubMed

Publication types