. 2020 Jul 14;10(1):11575.
doi: 10.1038/s41598-020-68392-6.

Force-frequency relationship during fatiguing contractions of rat medial gastrocnemius muscle

Affiliations

Force-frequency relationship during fatiguing contractions of rat medial gastrocnemius muscle

Keenan B MacDougall et al. Sci Rep. .

Abstract

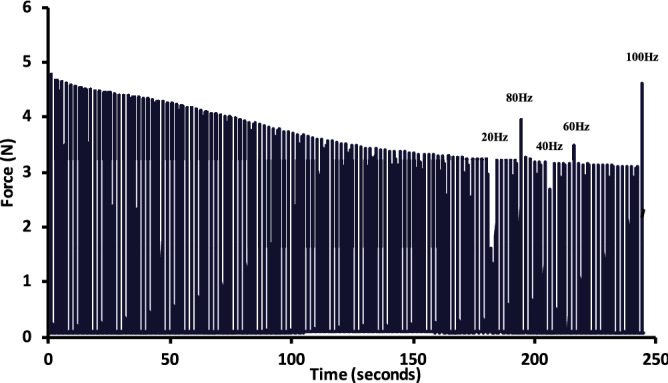
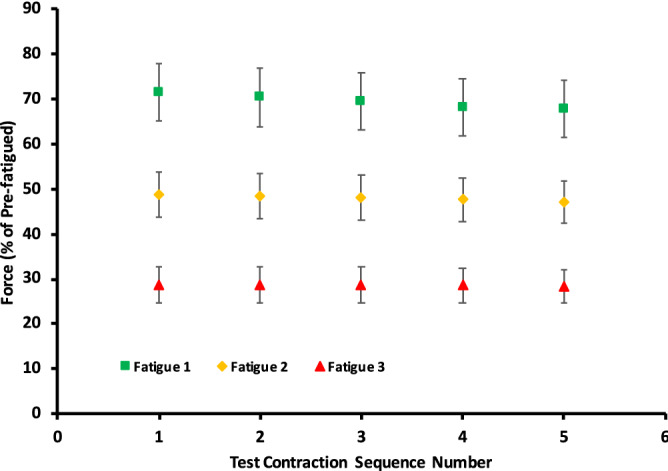
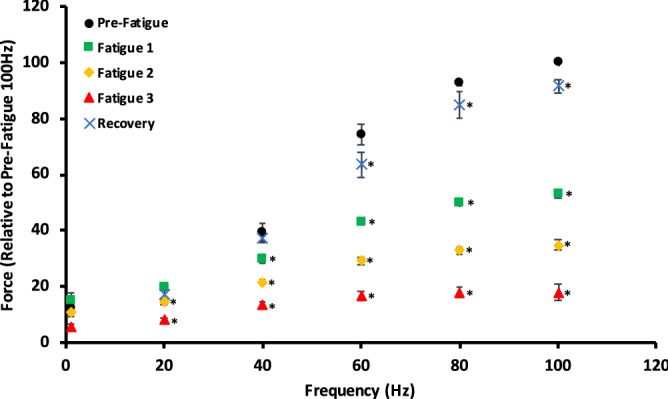
The force-frequency relationship presents the amount of force a muscle can produce as a function of the frequency of activation. During repetitive muscular contractions, fatigue and potentiation may both impact the resultant contractile response. However, both the apparent fatigue observed, and the potential for activity-dependent potentiation can be affected by the frequency of activation. Thus, we wanted to explore the effects that repetitive stimulation had on the force-frequency relationship. The force-frequency relationship of the rat medial gastrocnemius muscle was investigated during consecutive bouts of increasing fatigue with 20 to 100 Hz stimulation. Force was measured prior to the fatiguing protocol, during each of three levels of fatigue, and after 30 min of recovery. Force at each frequency was quantified relative to the pre-fatigued 100 Hz contractions, as well as the percentage reduction of force from the pre-fatigued level at a given frequency. We observed less reduction in force at low frequencies compared to high frequencies, suggesting an interplay of fatigue and potentiation, in which potentiation can "protect" against fatigue in a frequency-dependent manner. The exact mechanism of fatigue is unknown, however the substantial reduction of force at high frequency suggests a role for reduced force per cross-bridge.


Conflict of interest statement

The authors declare no competing interests.

Figures

Figure 1
Figure 1
Example force tracing showing force reduction during a fatiguing protocol consisting of 50 Hz contractions every 2 s. Once force stabilized, test contractions were done in a randomized order to obtain a force–frequency relationship during fatigue. The test contractions are shown with the stimulation frequency above.
Figure 2
Figure 2
Mean relative force output of the 50 Hz contractions, immediately preceding each test contraction, and expressed relative to the pre-fatigued 50 Hz contraction. This graph shows the constancy of force over each measurement period. Fatigue 1 = 1 contraction every 4 s. Fatigue 2 = 1 contraction every 2 s. Fatigue 3 = 1 contraction every second. *Each subsequent protocol resulted in a significant reduction in force compared to the previous protocol. Data points are mean ± SEM.
Figure 3
Figure 3
Active force expressed relative to the pre-fatigued 100 Hz contraction for control, three levels of fatigue, and after 30 min of recovery. Symbols/bars are mean ± SE. When no error bar is visible, it is within the symbol. Twitch contractions are shown near 0 frequency. Fatigue 1 = 1 contraction every 4 s. Fatigue 2 = 1 contraction every 2 s. Fatigue 3 = 1 contraction every second. *Denotes a significant difference from the pre-fatigue value at that frequency.
Figure 4
Figure 4
Hypothetical force–pCa relationship for a control muscle, a muscle with increased Ca2+ sensitivity, and a muscle with decreased Ca2+ sensitivity based on MacIntosh and Rassier. Additionally, hypothetical force–pCa curves assuming that force per cross-bridge has decreased due to fatigue are shown (bottom two curves). Note that if force per cross-bridge is reduced due to fatigue such that peak force is ~ 50% of baseline, increased Ca2+ sensitivity would allow the resultant force outputs to be proportionately greater relative to baseline at the lower Ca2+ concentrations than at higher concentrations (compare orange square dotted curve to solid curve). This is similar to what we found in regard to lower frequencies having less relative force reduction than higher frequencies of stimulation.
Figure 5
Figure 5
Data from MacIntosh and Willis combined with data from our experiments. The percentage reduction in active force was from the first fatiguing protocol in our experiments, and the percentage increase was from the data of MacIntosh and Willis. Note the reciprocal relationship between the percentage increase in active force due to potentiation, and the percentage reduction in active force due to fatigue at each frequency.

References

    1. Balnave CD, Allen DG. The effect of muscle length on intracellular calcium and force in single fibres from mouse skeletal muscle. J. Physiol. 1996 doi: 10.1113/jphysiol.1996.sp021339. - DOI - PMC - PubMed
    1. Glass LD, Cheng AJ, MacIntosh BR. Role of Ca2+ in changing active force during intermittent submaximal stimulation in intact, single mouse muscle fibers. Pflugers Arch. Eur. J. Physiol. 2018 doi: 10.1007/s00424-018-2143-y. - DOI - PMC - PubMed
    1. MacIntosh BR, Rassier DE. What is fatigue? Can. J. Appl. Physiol. 2002 doi: 10.1139/h02-003. - DOI - PubMed
    1. Asmussen, E. Muscle fatigue. Med. Sci. Sport Exerc.25(4), 411–420 (1993). - PubMed
    1. Gandevia SC. Spinal and supraspinal factors in human muscle fatigue. Physiol. Rev. 2001 doi: 10.1152/physrev.2001.81.4.1725. - DOI - PubMed