

Avoiding dynastic, assortative mating, and population stratification biases in Mendelian randomization through within-family analyses
- PMID: 32665587
- PMCID: PMC7360778
- DOI: 10.1038/s41467-020-17117-4
Avoiding dynastic, assortative mating, and population stratification biases in Mendelian randomization through within-family analyses
Abstract
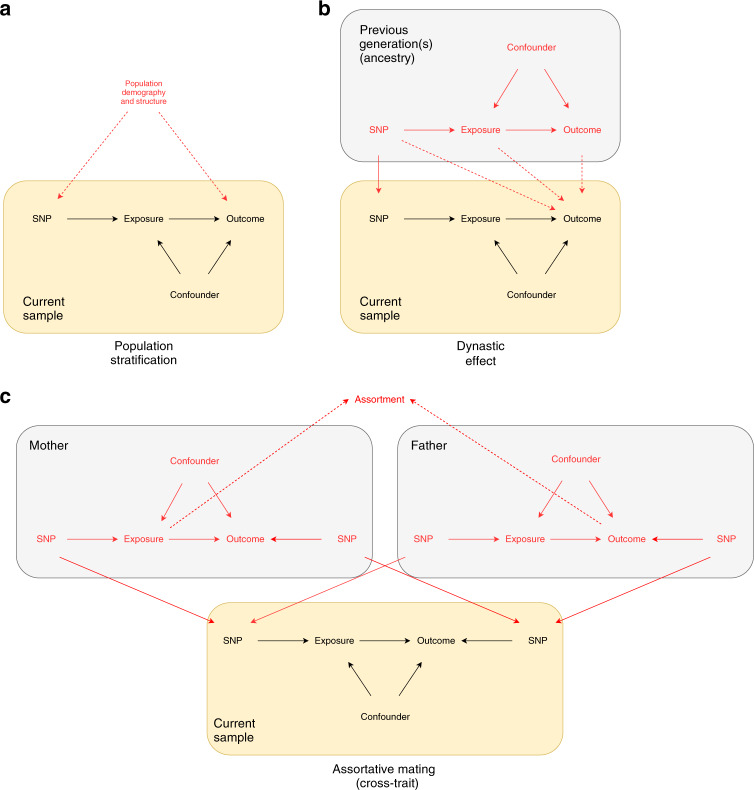
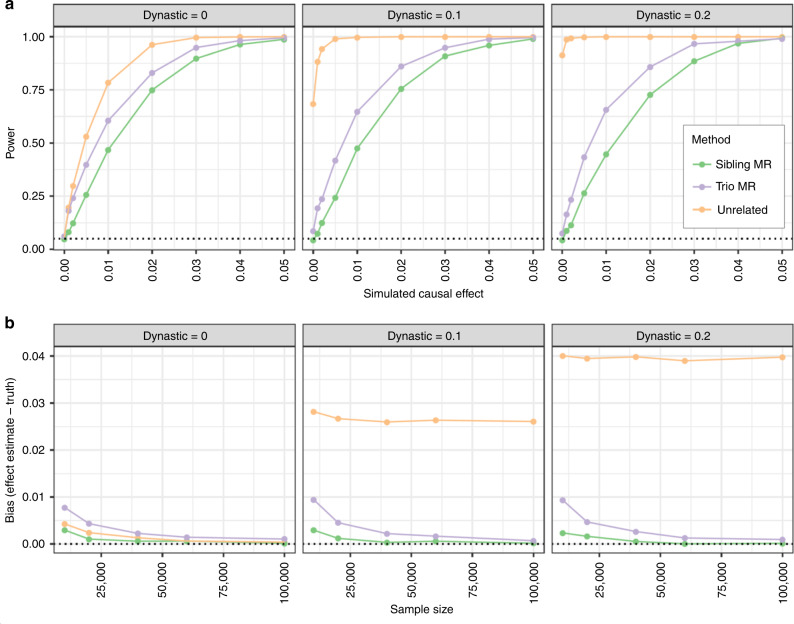
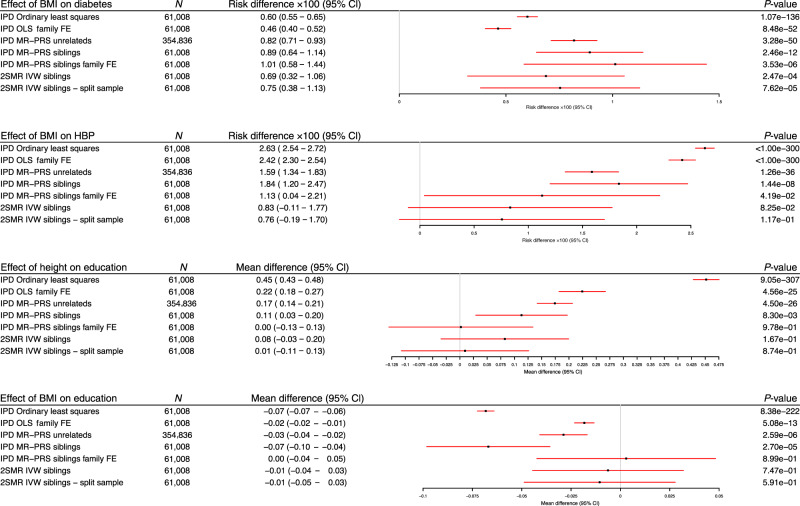
Estimates from Mendelian randomization studies of unrelated individuals can be biased due to uncontrolled confounding from familial effects. Here we describe methods for within-family Mendelian randomization analyses and use simulation studies to show that family-based analyses can reduce such biases. We illustrate empirically how familial effects can affect estimates using data from 61,008 siblings from the Nord-Trøndelag Health Study and UK Biobank and replicated our findings using 222,368 siblings from 23andMe. Both Mendelian randomization estimates using unrelated individuals and within family methods reproduced established effects of lower BMI reducing risk of diabetes and high blood pressure. However, while Mendelian randomization estimates from samples of unrelated individuals suggested that taller height and lower BMI increase educational attainment, these effects were strongly attenuated in within-family Mendelian randomization analyses. Our findings indicate the necessity of controlling for population structure and familial effects in Mendelian randomization studies.
Conflict of interest statement
K.H., A.A. and members of the 23andMe Research Team are employees of and have stock, stock options, or both, in 23andMe. The other authors declare no competing interests.
Figures
References
-
- Davey Smith G, Ebrahim S. ‘Mendelian randomization’: can genetic epidemiology contribute to understanding environmental determinants of disease? Int J. Epidemiol. 2003;32:1–22. - PubMed
-
- Pingault J-B, et al. Using genetic data to strengthen causal inference in observational research. Nat. Rev. Genet. 2018;19:566–580. - PubMed
-
- Katan M. Apoupoprotein E isoforms, serum cholesterol, and cancer. Lancet. 1986;327:507–508. - PubMed
Publication types
MeSH terms
Grants and funding
- MC_U137686851/MRC_/Medical Research Council/United Kingdom
- WT104150/WT_/Wellcome Trust/United Kingdom
- MC_UU_00011/2/MRC_/Medical Research Council/United Kingdom
- R01 AG018386/AG/NIA NIH HHS/United States
- MC_QA137853/MRC_/Medical Research Council/United Kingdom
- R01 AG059329/AG/NIA NIH HHS/United States
- MC_UU_12026/2/MRC_/Medical Research Council/United Kingdom
- MC_PC_14135/MRC_/Medical Research Council/United Kingdom
- MC_UU_12013/4/MRC_/Medical Research Council/United Kingdom
- MC_UU_00017/1/MRC_/Medical Research Council/United Kingdom
- MC_PC_17228/MRC_/Medical Research Council/United Kingdom
- RF1 AG058068/AG/NIA NIH HHS/United States
- MC_PC_13049/MRC_/Medical Research Council/United Kingdom
- MC_UU_00011/1/MRC_/Medical Research Council/United Kingdom
- R01 AG054628/AG/NIA NIH HHS/United States
- P2C HD042849/HD/NICHD NIH HHS/United States
- R01 AG046938/AG/NIA NIH HHS/United States
- R01 HL105756/HL/NHLBI NIH HHS/United States
- 208806/Z/17/Z/WT_/Wellcome Trust/United Kingdom
- R01 HD083613/HD/NICHD NIH HHS/United States
- R01 AG060470/AG/NIA NIH HHS/United States
- MR/M020894/1/MRC_/Medical Research Council/United Kingdom
- WT_/Wellcome Trust/United Kingdom
LinkOut - more resources
Full Text Sources
