. 2020 Jul 14;11(1):3505.
doi: 10.1038/s41467-020-17256-8.

HIV-1 replication complexes accumulate in nuclear speckles and integrate into speckle-associated genomic domains

Affiliations

HIV-1 replication complexes accumulate in nuclear speckles and integrate into speckle-associated genomic domains

Ashwanth C Francis et al. Nat Commun. .

Erratum in

Abstract

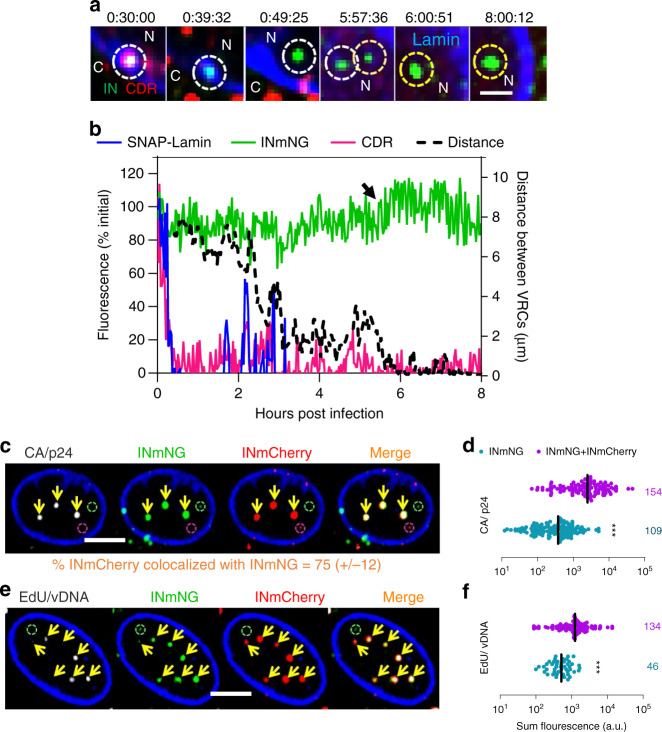
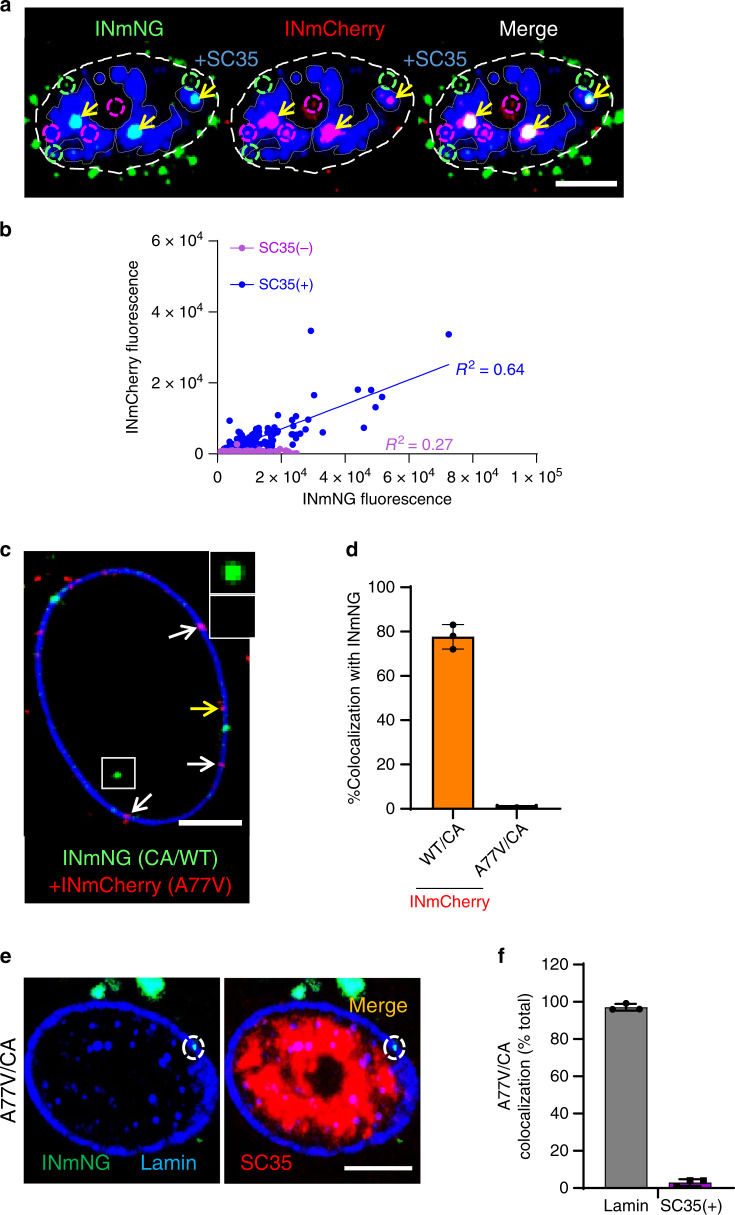
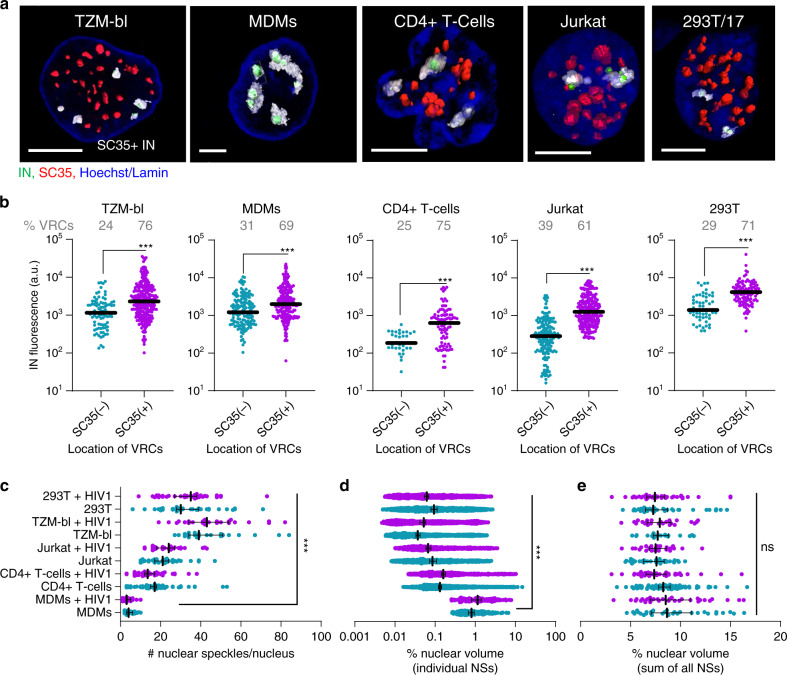
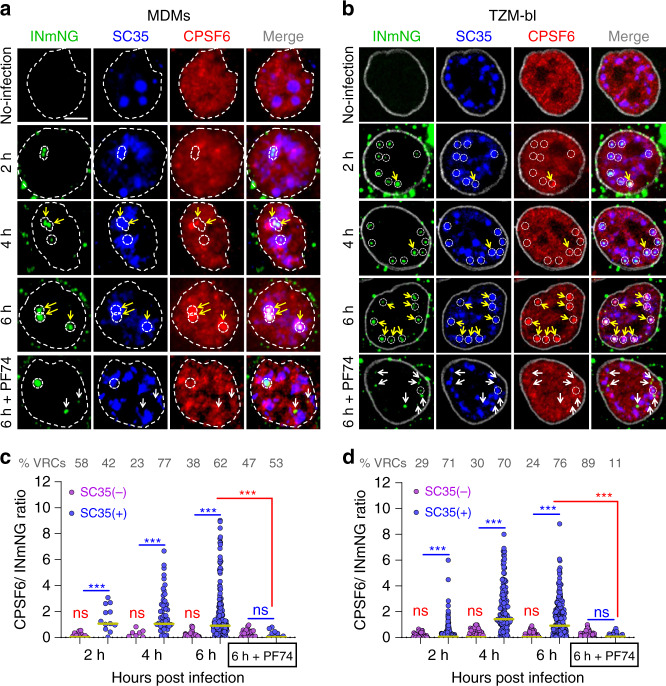
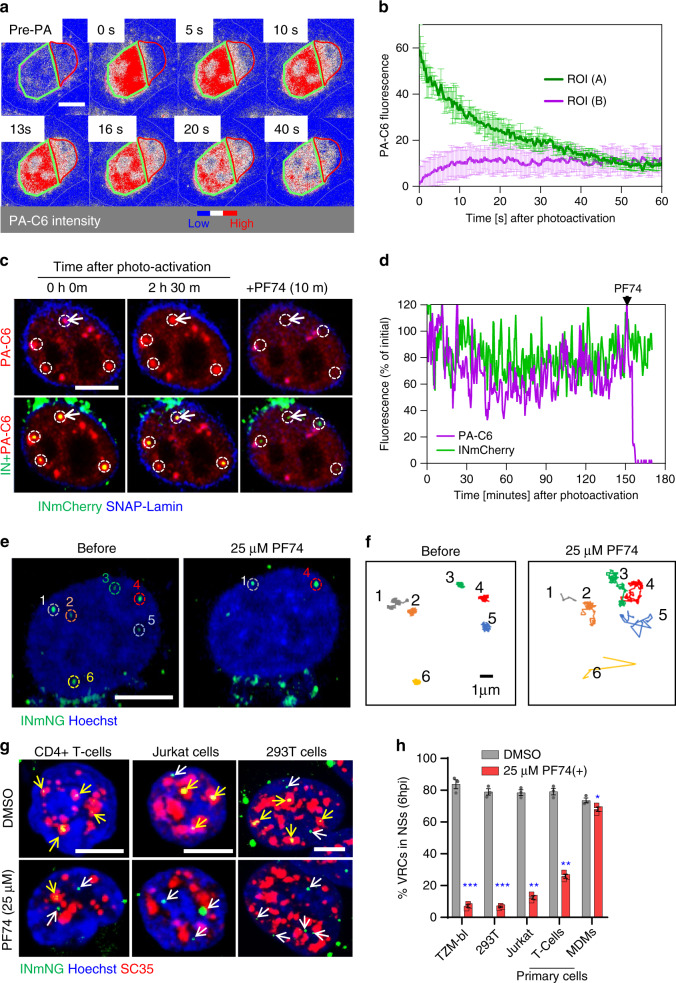
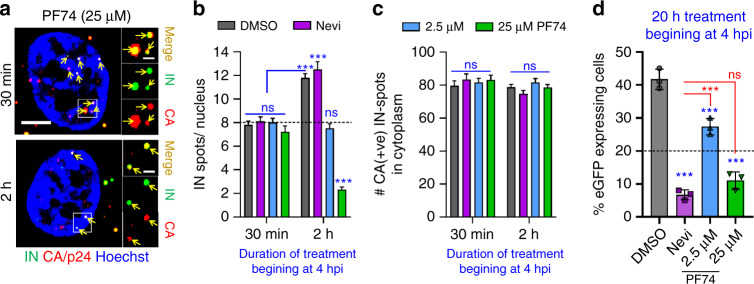
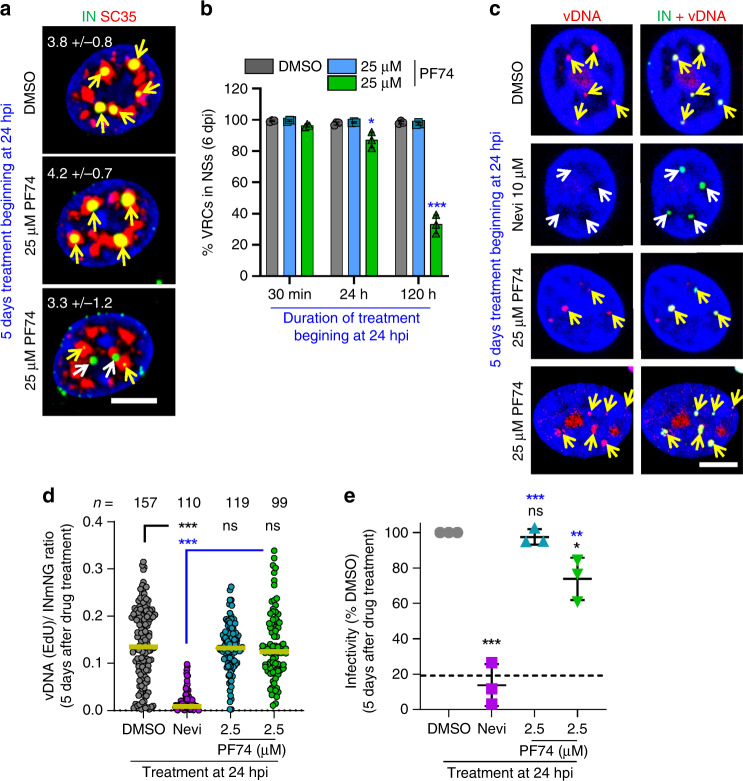
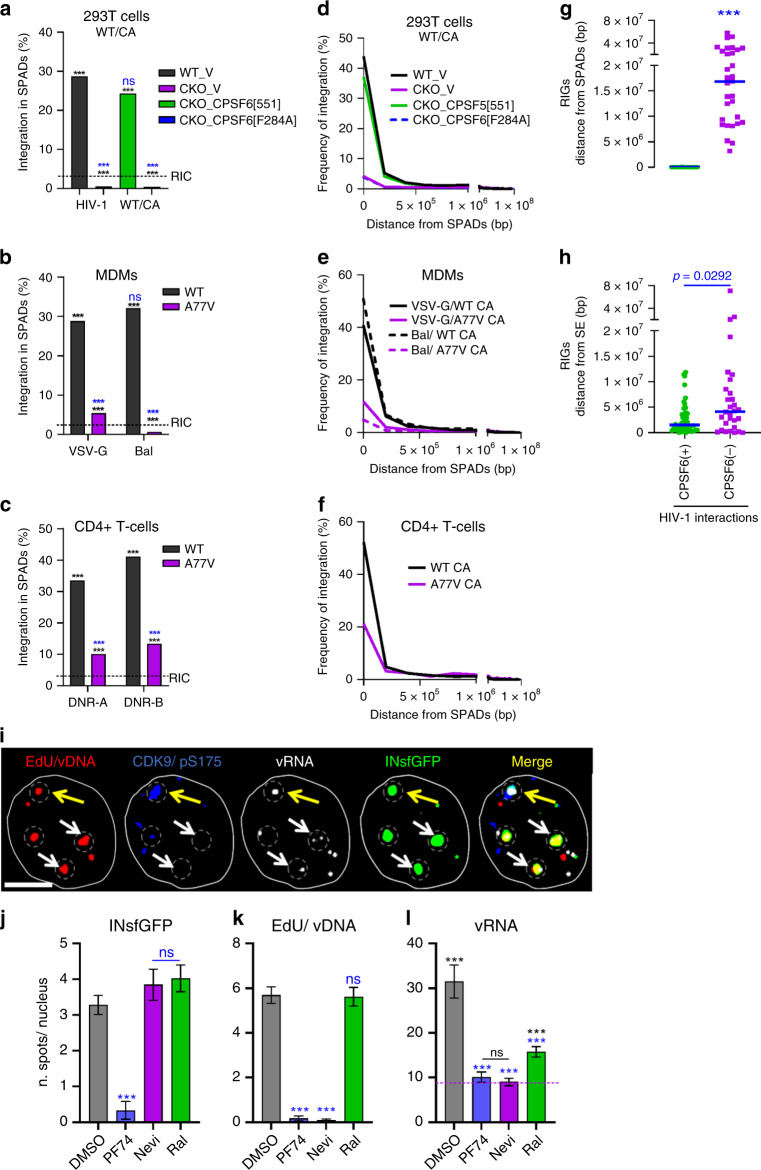
The early steps of HIV-1 infection, such as uncoating, reverse transcription, nuclear import, and transport to integration sites are incompletely understood. Here, we imaged nuclear entry and transport of HIV-1 replication complexes in cell lines, primary monocyte-derived macrophages (MDMs) and CD4+ T cells. We show that viral replication complexes traffic to and accumulate within nuclear speckles and that these steps precede the completion of viral DNA synthesis. HIV-1 transport to nuclear speckles is dependent on the interaction of the capsid proteins with host cleavage and polyadenylation specificity factor 6 (CPSF6), which is also required to stabilize the association of the viral replication complexes with nuclear speckles. Importantly, integration site analyses reveal a strong preference for HIV-1 to integrate into speckle-associated genomic domains. Collectively, our results demonstrate that nuclear speckles provide an architectural basis for nuclear homing of HIV-1 replication complexes and subsequent integration into associated genomic loci.


Conflict of interest statement

The authors declare no competing interests.

Figures

Fig. 1
Fig. 1. Multiple HIV-1 complexes traffic to distinct nuclear locations in MDMs.
a, b MDMs expressing SNAP-Lamin (blue) and infected at MOI 0.5 (corresponding to <30% infection of Vpx(+) treated cells after 5 days) with VSV-G pseudotyped HIV-1 co-labeled with INmNG and CDR were imaged at 90 s/frame consisting of 15 Z-stacks for 0.5–8 h. a Single Z-slice images with time stamps showing an IN/CDR co-labeled particle (white dashed circle) docked at the nuclear envelope that loses CDR and enters the nucleus. After nuclear entry of a second IN-labeled complex (orange dashed circle), the two complexes traffic toward each other, merge (yellow dashed circles) and stay together till the end of the experiment (see Supplementary Movie 1). b Mean fluorescence intensities of the single virus marked by white dashed circle in (a). The increase in INmNG signal at 6 h (arrow) represents merger of two nuclear IN complexes. Distance between the two IN complexes in (a)  is plotted in the 2nd Y-axis (right). cf Untreated MDMs were co-infected with HIV-1 labeled with INmNG or INmCherry markers at a total MOI of 1 for 24 h in the absence (c, d) or presence (e, f) of 5 μM EdU. Cells were fixed and immunostained for CA/p24 (c, d) or stained for EdU by click-labeling (e, f). c, e Images of a 2-µm-thick central Z-projection of the MDM nucleus showing merged (double positive) VRC clusters colocalized with (yellow arrows) CA (c) and EdU (e). Single-colored INmCherry or INmNG VRCs are marked by red and green dashed circles, respectively. d, f Fluorescence intensities of CA and EdU of double- vs. single-color INmNG puncta are shown. Scale bars are 1 μm in (a) and 5 μm in (c, e). Data in (d, f) are presented as median values ± SEM at 95% CI (confidence interval). N > 50 nuclei from three independent donors/experiments. The total number of IN puncta analyzed is shown on the right. Statistical significance in (d, f) was determined using a nonparametric Mann–Whitney rank-sum test, ***p < 0.001. Source data are provided as a Source Data file.
Fig. 2
Fig. 2. Multiple HIV-1 VRCs merge in nuclear speckles of MDMs.
a, b MDMs were co-infected with two VSV-G/HIVeGFP pseudoviruses labeled with INmNG or INmCherry (MOI 2), fixed at 6 hpi and immunostained for NSs (SC35). a A central section of MDM nucleus showing merger of INmNG and INmCherry VRCs in NSs (double positive IN clusters residing in NSs, yellow arrows). Single-labeled INmNG and INmCherry VRCs are marked with dashed green and red circles, respectively. NS contours are marked with semi-transparent gray dashed lines. b Fluorescence intensities associated with INmNG puncta inside (SC35(+)) or outside (SC35(−)) of NSs are plotted. cf HIV-1 CA determines the nuclear penetration and speckle association of VRCs. c, d MDMs were co-infected with VSV-G-pseudotyped INmNG-labeled HIVeGFP virus bearing wild-type CA (green) and INmCherry-labeled pseudoviruses (MOI 2) containing either wild-type CA or the A77V CA (red). At 24 hpi, cells were fixed, immunostained for lamin, and colocalization of INmNG and INmCherry in the nucleus was quantified. c A central section of MDM nucleus shows nuclear INmNG spot for wild-type CA (white box) and nuclear membrane-associated INmCherry puncta of the A77V CA mutant (white arrows). The yellow arrows point to A77V CA INmCherry puncta on the nuclear side of Lamin. Inset shows the intranuclear WT CA INmNG spot (green) lacking A77V CA INmCherry signal. d The fraction of nuclear INmNG colocalizing with INmCherry puncta is shown. e, f MDMs were infected with INmNG-labeled VSV-G pseudotyped A77V CA mutant virus, fixed at 24 hpi, and immunostained for Lamin (blue) and SC35 (red). e Images show the A77V mutant INmNG puncta localized to the nuclear membrane failed to penetrate the nucleoplasm and reach SC35 compartments. f Quantification of the A77V CA mutant INmNG puncta colocalization with lamin or SC35(+) NS compartment. Scale bars in (a, c, e) are 5 µm and 0.5 µm in the inset (c). Error bars in (d, f) are SEM from n > 60 nuclei analyzed from three independent experiments. Source data are provided as a Source Data file.
Fig. 3
Fig. 3. NSs are preferred HIV-1 accumulation sites in different cell types.
ae MDMs, HEK293T, and TZM-bl cells were infected at MOI of 5 (determined on TZM-bl cells); Jurkat cells and primary CD4+ T cells were infected in suspension with the same virus supernatant and later adhered to a 8-well coverslip for microscopy analysis. All cell types were fixed at 6 hpi (uninfected cells were used as controls). Cells were immunostained for NSs (SC35) and lamin in TZM-bl and MDMs; the nuclei of T cells and HEK293T cells were stained with Hoechst-33342. NSs (SC35(+)) compartments were identified by three-dimensional image analysis. a 3D-rendered of images showing NSs (red), IN puncta (green), and nuclei (blue). NSs encompassing HIV-1 complexes are colored transparent gray. Scale bar: 5 μm. (b) Fluorescence intensities of IN puncta inside (SC35(+)) and outside (SC35(−)) nuclear speckles. c The number of NSs per nucleus in different cell types. d Percent of nuclear volume occupied by individual NSs. e Percent of nuclear volume occupied by all speckles. Infected cells (red symbols) are marked with cell type name +HIV-1. Data in (be) are presented as median values ± SEM at 95% CI. N > 50 nuclei for each cell type from >3 independent experiments in HEK293T and Jurkat cells, from three donors in primary CD4+ T cells, and >5 independent experiments in TZM-bl cells and MDMs. A total of 124 nuclear IN puncta were analyzed in CD4+ T cells and >200 IN puncta were analyzed in all other cell types (b). Statistical significance between uninfected MDMs and other cell types in (be) was determined using a nonparametric Mann–Whitney rank-sum test. ***p < 0.001. Differences in the number NSs between uninfected and HIV-infected cells in each cell type were insignificant, p > 0.05. Images in (a) are representatives of >120 nuclei from at least three independent experiments. Source data are provided as a Source Data file.
Fig. 4
Fig. 4. HIV-1 VRCs recruit CPSF6 to NSs.
ad Timecourse of CPSF6 accumulation at NS-localized HIV-1 complexes. TZM-bl cells stably expressing SNAP-Lamin nuclear envelope marker and MDMs (untreated) were infected at MOI of 5 and fixed at indicated time points. Where indicated, PF74 (25 μM) was added to samples 30 min before fixation (denoted 6 h + PF74). Cells were immunostained for NSs (SC35) and endogenous CPSF6. Uninfected cells were used as controls. Association of nuclear INmNG-labeled VRCs with SC35+ compartments in MDMs (a) and TZM-bl cells (b). White dashed circles and contours show NS-associated IN puncta, yellow arrows point to IN puncta that recruited CPSF6, white arrows in 6 h + PF74 treatment point to the loss of CPSF6 signal from IN puncta. Analysis of the ratio of CPSF6/INmNG fluorescence in nuclear IN puncta residing inside (SC35(+)) and outside (SC35(−)) NSs in MDMs (c) and TZM-bl cells (d). Note: raw INmNG and CPSF6 fluorescent intensities are shown in Supplementary Fig. 5a–d. Scale bar is 5 μm in (a, b). Data in (c, d) are presented as median values (yellow lines) ± SEM at 95% CI. Obtained by analysis of >80 nuclei in each cell type for each time point, from three independent experiments/donors. The number of MDM IN complexes analyzed in (c) was 31, 79, 353, and 80 for 2, 4, 6 h, and 6 h + PF74, respectively. In (d), >200 IN puncta in TZM-bl cells were analyzed for all time points. Statistical analysis was performed using nonparametric Mann–Whitney rank-sum test (nsp > 0.05; ***p < 0.001). In (c, d), analyses for the same sample inside and outside NSs are shown in blue, and the p values for the effect of PF74 treatment at 6 hpi are shown in red. All nuclear IN spots were analyzed without an exception. Source data are provided as a Source Data file.
Fig. 5
Fig. 5. CA-dependent interactions tether VRCs to NSs.
a, b CPSF6 fusion with photoactivatable GFP (PA-C6) transiently expressed in TZM-bl cells is highly mobile in the nucleus. Images (a) and quantification (b) of redistribution of photoactivated PA-C6 from the illuminated region (green contour, A) into a non-photoactivated region (red contour, B) in a central Z-plane of the nucleus. PA-C6 fluorescence is represented as a heatmap. c, d A subset of PA-C6 is tightly associated with nuclear VRCs. Images (c) and fluorescent intensity trace (d) of INmCherry-labeled nuclear VRCs (dashed white circles) co-trafficking with photoactivated PA-C6 (red) in cells expressing SNAP-Lamin (blue). Imaging started at 4 hpi. PA-C6 was photoactivated at the location of VRCs and live-cell imaging was performed at 20 s/frame for 2.5 h, at which point, addition of 25 µM PF74 displaced PA-C6 from VRCs. The fluorescence intensity trace in (d) corresponds to VRC in the top-left corner (white arrow in (c)). e, f Addition of PF74 results in rapid displacement of VRCs from their location. TZM-bl cells (nuclei stained with Hoechst) were infected with INmNG-labeled HIV-1 for 4 h, and trafficking of nuclear VRCs was imaged at 5 s/frame for 30 min. Images (e) and single-particle trajectories (f) of nuclear INmNG puncta before and after 25 μM PF74 treatment correspond to VRCs marked by dashed circles in panel (e). g, h Images and quantification of the fraction of NS-localized VRCs in different cell types untreated or treated with PF74. MDMs, HEK293T, TZM-bl cells, Jurkat cells and primary CD4+ T cells were infected, as described in Fig. 3. Where noted, 25 μM PF74 was added 30 min before fixation at 6 h. Cells were immunostained for NSs (SC35), and the number of IN puncta inside and outside of NSs was determined. Scale bars in (a, c, e, g) are 5 μm. Error bars are mean ± SEM. N = 20 nuclei in (b) and >120 nuclei in (h) from three independent experiments. Significance relative to DMSO control was determined by two-tailed Student’s t test (*p = 0.0365; **p < 0.01; ***p < 0.001). Source data are provided as a Source Data file.
Fig. 6
Fig. 6. NS localization stabilizes VRCs in the nucleus.
TZM-bl cells were infected with VSV-G pseudotyped HIVeGFP labeled with INmNG for 4 h (half-time of nuclear import), at which time DMSO, Nevi (10 μM), or the indicated concentrations of PF74 was added and cells were fixed after 30 min or after 2 h of PF74 application to quantify nuclear IN puncta (a, b) and cytosolic CA-positive IN puncta (c) or incubated for additional 20 h to measure infection (d). a, b A high dose of PF74 results in the displacement of IN puncta from NSs and disappearance of IN puncta. a Single Z-stack images showing the presence of CA/p24 immuno-labeled (red) IN puncta (green) in the nucleus (blue) of 25 µM PF74 treated cells after 30 min (top panel) or 2 h (bottom panel). Analysis from 30 to 40 cells in each of the three independent experiments showing the average number of IN puncta per nucleus (b) or CA-positive IN puncta in the cytoplasm (c) is shown. d The fraction of eGFP-expressing TZM-bl cells treated with indicated drugs at 4 hpi was determined at 24 h. Dashed lines represent baseline nuclear import upon drug addition (b) and 50% of DMSO infection (d), respectively. Scale bar in (a) is 5 μm and inset in (a) is 1 μm. Error bars in panels (bd) are mean values ± SEM. Data in (b, c) are from >80 nuclei/cells containing >1500 IN complexes and three independent experiments (ad). The statistical significance in (bd) was determined by two-tailed Student’s t test (ns, p > 0.05; ***p < 0.001). Results of statistical analyses in (d) vs. DMSO control is shown in blue vs. Nevi that is shown in red. Statistical analysis in (b) with respect to a 30 min treatment with DMSO is shown in blue. Source data are provided as a Source Data file.
Fig. 7
Fig. 7. PF74-resistant nuclear VRC clusters in MDMs continue to synthesize vDNA.
Treatment with 25 µM PF74 promotes slow exit of VRCs from NSs of MDMs, without affecting vDNA synthesis. MDMs were infected with INmNG-labeled HIV-1 (ad) for 24 h, at which time PF74, DMSO, or Nevi was added without (a, b, e) or with 5 μM EdU (c, d), and incubated for different time, as indicated. Cells were fixed and stained for NSs (SC35) (a, b) or vDNA (c, d). a, b Images and quantification of the fraction of nuclear VRCs colocalized with SC35 compartments; c, d images and EdU/vDNA staining of nuclear IN puncta after treatment with DMSO and PF74 at 24 hpi. Fluorescence intensities of EdU and INmNG of nuclear VRCs in panel (d) were measured and the ratio of EdU/vDNA to INmNG signals was plotted. e HIV-1 infection of MDMs becomes resistant to PF74 treatment after 24 h. MDMs infected with VSV-G pseudotyped pNL4.3 R-E-Luc were treated with indicated drugs beginning at 24 hpi. Cells were cultured for additional 5 days in the presence of drugs; luciferase activity was measured in triplicate and normalized to DMSO control. Each data point in (e) represents infectivity from an independent donor, dashed black line denotes the fraction of completion of vDNA synthesis at the time of drug addition (24 h). Scale bars in (a, c) are 5 μm. The average number of nuclear VRCs (±SD) detected in >60 nuclei from three experiments is overlaid on images in (a). Mean values ± SEM are shown in panels (b, e). Yellow line in (d) shows median values at 95% CI from three independent experiments/donors for >80 nuclei; the total number of nuclear IN puncta analyzed is shown. Significance in (b) and (e) (black—relative to DMSO, blue—nevirapine) was determined by two-tailed Student’s t test. p values in (d) were determined by a nonparametric Mann–Whitney rank-sum test. *p = 0.0228 in (b), p = 0.0138 in (e); ***p < 0.001 in (b, d, e). Images in (a, c) are representative of >120 nuclei, from three independent experiments/donors. Source data are provided as a Source Data file.
Fig. 8
Fig. 8. HIV-1 integration favors NS-associated genomic loci.
a, d Analysis of HIV-1 integration preferences into SPAD regions in WT and CKO HEK293T cells transduced with empty expression vector (WT_V and CKO_V, respectively) or CKO cells transduced with vector expressing WT or F284A CPSF6 protein. b, e MDMs infected with single-round VSV-G pseudotyped or replication-competent (Bal) virus. c, f Primary CD4+ T cells derived from two blood donors A and B. ac Percentage of HIV-1 integration sites within SPAD regions. df Frequency distribution of all integration sites as a function of their distance from closest SPAD, bin sizes are 200 kb. g, h CPSF6-dependent integration targeting of SPADs. Distances of RIGs from SPADs (g) vs. SEs (h). In (ac), p values relative to matched WT conditions (blue asterisks) and to RIC (black asterisks) were calculated by Fisher’s exact test. A nonparametric Mann–Whitney rank-sum test was used in (g, h) (nsp > 0.05; ***p < 0.0001). il Vpx(+) MDMs were infected with INsfGFP labeled VSV-G pseudotyped HIV-1 at MOI of 2 in the presence of EdU (5 μM). Infections were carried out in the presence of PF74 (2.5 μM), Nevi (10 μM), or RAL (10 μM) fixed at 72 hpi, and stained for CDK9/pS175, EdU/vDNA, and transcribed vRNA. i Images of an MDM nucleus showing INsfGFP (green), EdU (red), CDK9/pS175 (blue), and vRNA (white) spots. IN clusters are marked by dashed circles. White arrows point to IN clusters colocalized with EdU and vRNA spots; a yellow arrow shows colocalization of a single IN cluster with all three markers, including CDK9/pS175. Quantification of the number of nuclear IN (j), nuclear EdU (k), and vRNA puncta (l) is shown. Scale bar in (i) is 5 μm. Error bars in (jl) are mean values ± SEM for >90 nuclei from three donors. The p values relative to DMSO are shown in blue (jl) and relative to background (BG) RNA spots detected by RNAscope in noninfected MDMs are in black (l) (dashed blue line) was determined by two-tailed Student’s t test (nsp > 0.05; **p < 0.01; *** p <0.001). Source data are provided as a Source Data file.

References

    1. Zhao G, et al. Mature HIV-1 capsid structure by cryo-electron microscopy and all-atom molecular dynamics. Nature. 2013;497:643–646. - PMC - PubMed
    1. Campbell EM, Hope TJ. HIV-1 capsid: the multifaceted key player in HIV-1 infection. Nat. Rev. Microbiol. 2015;13:471–483. - PMC - PubMed
    1. Matreyek KA, Engelman A. Viral and cellular requirements for the nuclear entry of retroviral preintegration nucleoprotein complexes. Viruses. 2013;5:2483–2511. - PMC - PubMed
    1. Fassati A, Goff SP. Characterization of intracellular reverse transcription complexes of human immunodeficiency virus type 1. J. Virol. 2001;75:3626–3635. - PMC - PubMed
    1. Nermut MV, Fassati A. Structural analyses of purified human immunodeficiency virus type 1 intracellular reverse transcription complexes. J. Virol. 2003;77:8196–8206. - PMC - PubMed

Publication types

MeSH terms

Substances