

Quantile-dependent heritability of computed tomography, dual-energy x-ray absorptiometry, anthropometric, and bioelectrical measures of adiposity
- PMID: 32665611
- PMCID: PMC7530941
- DOI: 10.1038/s41366-020-0636-1
Quantile-dependent heritability of computed tomography, dual-energy x-ray absorptiometry, anthropometric, and bioelectrical measures of adiposity
Abstract
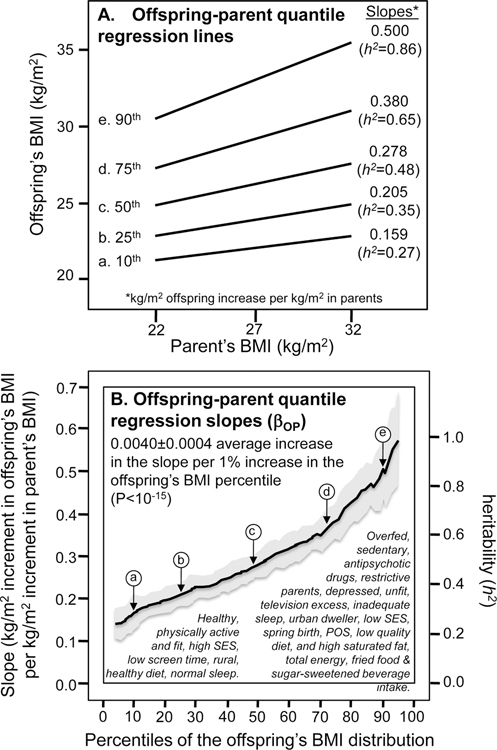
Background/objectives: Quantile-dependent expressivity occurs when a gene's phenotypic expression depends upon whether the trait (e.g., BMI) is high or low relative to its distribution. We have previously shown that the obesity effects of a genetic risk score (GRSBMI) increased significantly with increasing quantiles of BMI. However, BMI is an inexact adiposity measure and GRSBMI explains <3% of the BMI variance. The purpose of this paper is to test BMI for quantile-dependent expressivity using a more inclusive genetic measure (h2, heritability in the narrow sense), extend the result to other adiposity measures, and demonstrate its consistency with purported gene-environment interactions.
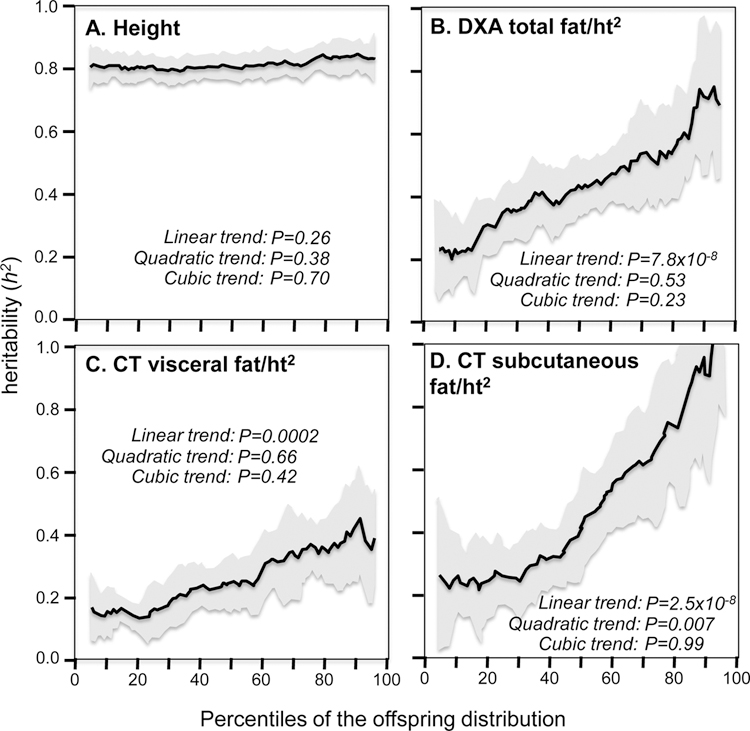
Subjects/methods: Quantile-specific offspring-parent regression slopes (βOP) were obtained from quantile regression for height (ht) and computed tomography (CT), dual-energy x-ray absorptiometry (DXA), anthropometric, and bioelectrical impedance (BIA) adiposity measures. Heritability was estimated by 2βOP/(1 + rspouse) in 6227 offspring-parent pairs from the Framingham Heart Study, where rspouse is the spouse correlation.
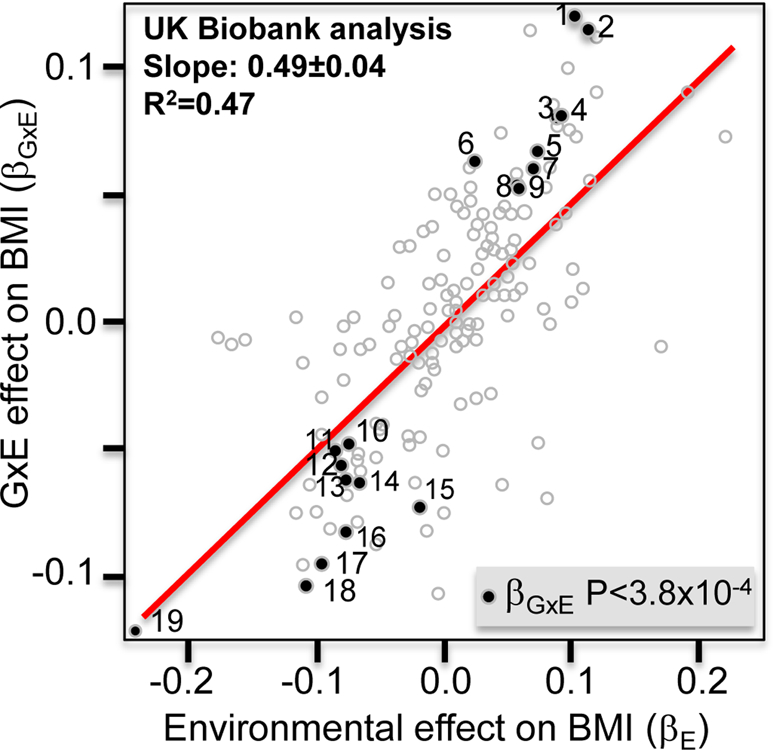
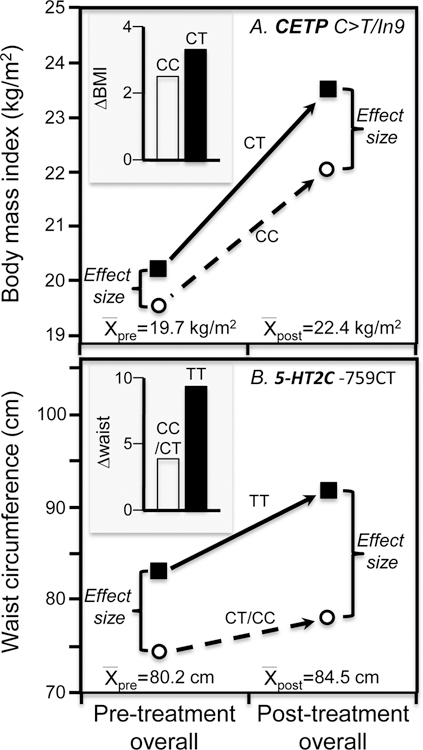
Results: Compared to h2 at the 10th percentile, genetic heritability was significantly greater at the 90th population percentile for BMI (3.14-fold greater, P < 10-15), waist girth/ht (3.27-fold, P < 10-15), hip girth/ht (3.12-fold, P = 6.3 × 10⁻¹⁴), waist-to-hip ratio (1.75-fold, P = 0.01), sagittal diameter/ht (3.89-fold, P = 3.7 × 10⁻⁷), DXA total fat/ht2 (3.62-fold, P = 0.0002), DXA leg fat/ht2 (3.29-fold, P = 2.0 × 10⁻¹¹), DXA arm fat/ht2 (4.02-fold, P = 0.001), CT-visceral fat/ht2 (3.03-fold, P = 0.002), and CT-subcutaneous fat/ht2 (3.54-fold, P = 0.0004). External validity was suggested by the phenomenon's consistency with numerous published reports. Quantile-dependent expressivity potentially explains precision medicine markers for weight gain from overfeeding or antipsychotic medications, and the modifying effects of physical activity, sleep, diet, polycystic ovary syndrome, socioeconomic status, and depression on gene-BMI relationships.
Conclusions: Genetic heritabilities of anthropometric, CT, and DXA adiposity measures increase with increasing adiposity. Some gene-environment interactions may arise from analyzing subjects by characteristics that distinguish high vs. low adiposity rather than the effects of environmental stimuli on transcriptional and epigenetic processes.
Conflict of interest statement
Conflict of interest statement: There are no conflicts of interest to report.
Figures
Similar articles
-
The relationship between DXA-based and anthropometric measures of visceral fat and morbidity in women.BMC Cardiovasc Disord. 2013 Apr 3;13:25. doi: 10.1186/1471-2261-13-25. BMC Cardiovasc Disord. 2013. PMID: 23552273 Free PMC article.
-
Quantile-specific heritability of high-density lipoproteins with implications for precision medicine.J Clin Lipidol. 2020 Jul-Aug;14(4):448-458.e0. doi: 10.1016/j.jacl.2020.05.099. Epub 2020 May 29. J Clin Lipidol. 2020. PMID: 32600822 Free PMC article.
-
Prediction of total and visceral fat contents using anthropometric measures of adiposity in women.Ceylon Med J. 2008 Dec;53(4):128-32. doi: 10.4038/cmj.v53i4.281. Ceylon Med J. 2008. PMID: 19189790
-
Visceral adiposity and inflammatory bowel disease.Int J Colorectal Dis. 2021 Nov;36(11):2305-2319. doi: 10.1007/s00384-021-03968-w. Epub 2021 Jun 9. Int J Colorectal Dis. 2021. PMID: 34104989 Review.
-
Assessment of correlation between conventional anthropometric and imaging-derived measures of body fat composition: a systematic literature review and meta-analysis of observational studies.BMC Med Imaging. 2023 Sep 14;23(1):127. doi: 10.1186/s12880-023-01063-w. BMC Med Imaging. 2023. PMID: 37710156 Free PMC article.
Cited by
-
Quantile-Dependent Expressivity of Serum Uric Acid Concentrations.Int J Genomics. 2021 Sep 2;2021:3889278. doi: 10.1155/2021/3889278. eCollection 2021. Int J Genomics. 2021. PMID: 34545327 Free PMC article.
-
Quantile-specific heritability of total cholesterol and its pharmacogenetic and nutrigenetic implications.Int J Cardiol. 2021 Mar 15;327:185-192. doi: 10.1016/j.ijcard.2020.11.070. Epub 2020 Dec 6. Int J Cardiol. 2021. PMID: 33296721 Free PMC article.
-
Quantile-Dependent Expressivity and Gene-Lifestyle Interactions Involving High-Density Lipoprotein Cholesterol.Lifestyle Genom. 2021;14(1):1-19. doi: 10.1159/000511421. Epub 2020 Dec 9. Lifestyle Genom. 2021. PMID: 33296900 Free PMC article. Review.
-
Quantile-dependent expressivity of serum C-reactive protein concentrations in family sets.PeerJ. 2021 Feb 16;9:e10914. doi: 10.7717/peerj.10914. eCollection 2021. PeerJ. 2021. PMID: 33628645 Free PMC article.
-
Considerations on efforts needed to improve our understanding of the genetics of obesity.Int J Obes (Lond). 2025 Feb;49(2):206-210. doi: 10.1038/s41366-024-01528-0. Epub 2024 Jun 7. Int J Obes (Lond). 2025. PMID: 38849463 Free PMC article. Review. No abstract available.
References
-
- Falconer DS, Mackay TFC. Introduction to Quantative Genetics. 4th edition. 2004. Pearson Education Limited; London: ISBN 978-81-317-2740-9
Publication types
MeSH terms
Grants and funding
LinkOut - more resources
Full Text Sources
Medical
Miscellaneous
