. 2020 Jul 14;3(1):375.
doi: 10.1038/s42003-020-1097-8.

CD70 expression determines the therapeutic efficacy of expanded human regulatory T cells

Affiliations

CD70 expression determines the therapeutic efficacy of expanded human regulatory T cells

Rebeca Arroyo Hornero et al. Commun Biol. .

Abstract

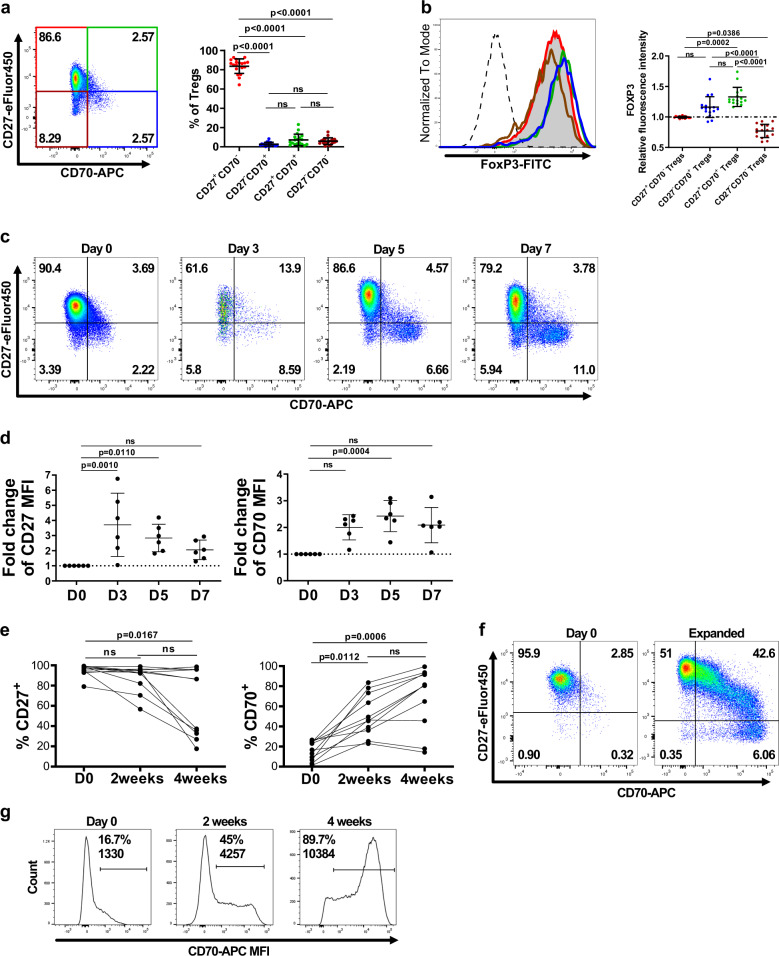
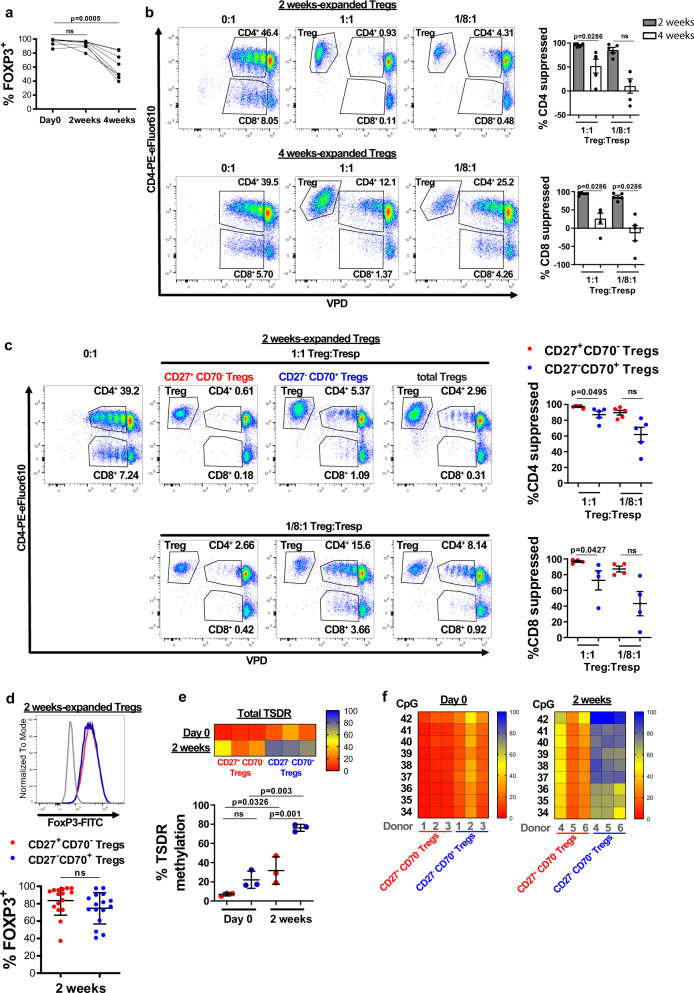
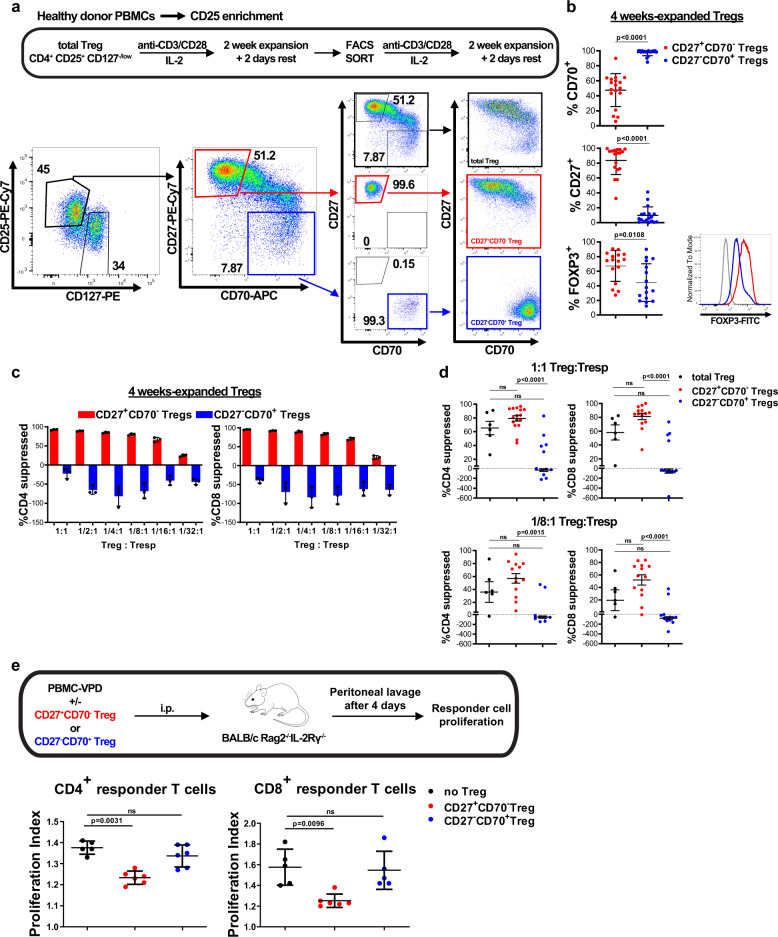
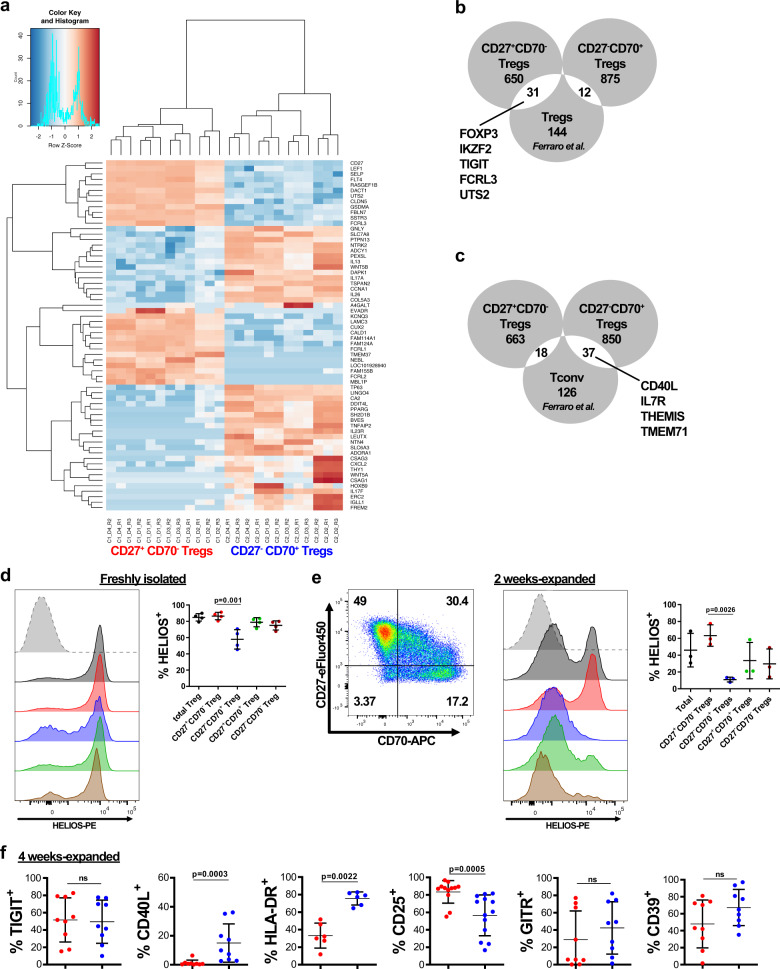
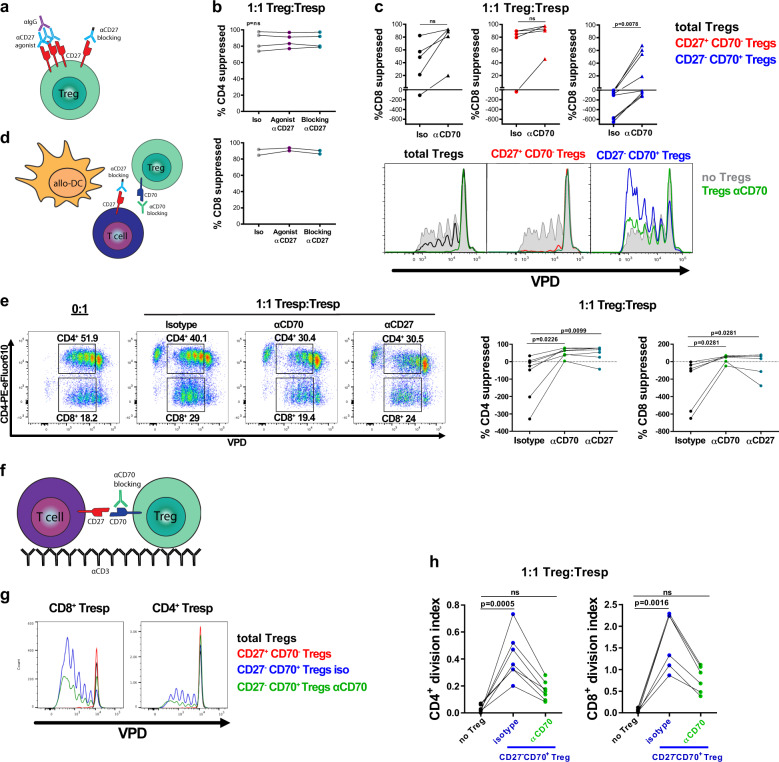
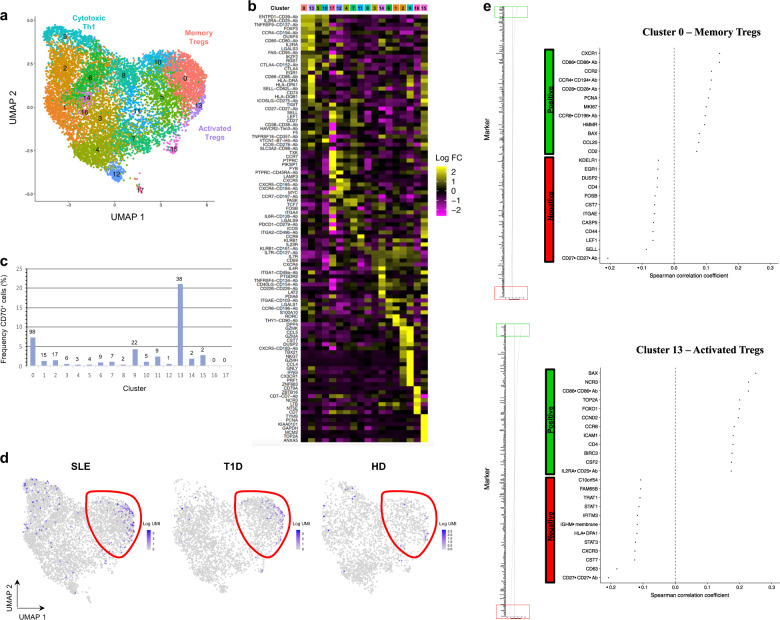
Regulatory T cells (Tregs) are critical mediators of immune homeostasis. The co-stimulatory molecule CD27 is a marker of highly suppressive Tregs, although the role of the CD27-CD70 receptor-ligand interaction in Tregs is not clear. Here we show that after prolonged in vitro stimulation, a significant proportion of human Tregs gain stable CD70 expression while losing CD27. The expression of CD70 in expanded Tregs is associated with a profound loss of regulatory function and an unusual ability to provide CD70-directed co-stimulation to TCR-activated conventional T cells. Genetic deletion of CD70 or its blockade prevents Tregs from delivering this co-stimulatory signal, thus maintaining their regulatory activity. High resolution targeted single-cell RNA sequencing of human peripheral blood confirms the presence of CD27-CD70+ Treg cells. These findings have important implications for Treg-based clinical studies where cells are expanded over extended periods in order to achieve sufficient treatment doses.


Conflict of interest statement

The authors declare the following sole competing financial interest: L.Z.H. is an employee and shareholder of Celldex Therapeutics, Inc. The other authors declare no competing financial or non-financial interests. Unrelated to this work, F.I. is currently Scientific Director of the Restore Research Trust but was not in this role when this study was carried out and receives no personal remuneration, J.H. and F.I. receive research funding from the Oxford-Celgene Fellowship Scheme (now Oxford-BMS), and W.Q. receives research funding from Servier and holds stock in Autolus and Orchard Therapeutics.

Figures

Fig. 1
Fig. 1. CD27 and CD70 define distinct human Treg subpopulations.
a Expression of CD27 and CD70 was analyzed on freshly isolated CD4+CD25+CD127−/low Tregs. Left panel: Representative FACS plots from one donor. Figures display percentages. Right panel: n = 19 independent donors. Data were analyzed using a Kruskal–Wallis test with Dunn’s post-test for multiple comparisons and are represented as mean ± SD. b FOXP3 expression was measured within the total Treg population or within different Treg subsets defined by CD27 and CD70 expression. Left panel: Representative FACS plots from one donor. Right panel: FOXP3 fluorescence intensity normalized to the total Treg population in different Treg subsets (n = 16 independent donors). Mean ± SD, Kruskal–Wallis test with Dunn’s post-test for multiple comparisons. c, d: c Dot plots for one representative donor in which expression of CD27 and CD70 was measured at different time points on Tregs stimulated with anti-CD3/anti-CD28 coated beads at a ratio of 1:5 beads to cells in the presence of rhIL-2 (250U/ml). Figures show percentages. d CD27 and CD70 fluorescence intensity was analyzed within the CD27+CD70 or the CD27CD70+ Treg populations, respectively, at different time points and normalized to levels prior stimulation. Data represented as mean ± SD. (n = 6 independent donors with 1–3 replicates per donor). Data were analyzed using a Friedman test with Dunn’s post-test for multiple comparisons. eg Expression of CD27 and CD70 was analyzed on freshly isolated ex vivo Tregs or Tregs expanded for 2 or 4 weeks with anti-CD3/anti-CD28 coated beads at a ratio of 1:1 beads to cells in the presence of rhIL-2 (1000 U/ml). e Data show n = 11 independent donors analyzed using a Friedman test with Dunn’s post-test for multiple comparisons. f Representative plots for one donor. Figures show percentages. g Figures display percentage and fluorescence intensity of CD70+ cells for one representative donor. ns, non-significant.
Fig. 2
Fig. 2. Prolonged expansion reduces the suppressive capacity of Tregs.
CD4+CD25+CD127−/lowTregs were cultured in vitro with anti-CD3/anti-CD28 coated beads and rhIL-2 before analysis of a FOXP3 expression (n = 8 donors, Friedman test with Dunn’s post-test for multiple comparisons) and b in vitro Treg suppressive capacity, assessed as suppression of responder T cell (Tresp) proliferation. Left panel: percentage of VPD-stained CD4+ or CD8+ cells in the absence of Tregs (0:1) and in the presence of Tregs at a 1:1 or 1/8:1 Treg:Tresp ratios shown for one representative donor. Right panel: percentage suppression of CD4+ and CD8+Tresp calculated based on division index as described in “Methods” section. n = 5 donors (three replicate wells for each donor). Mean ± SEM, Friedman test and Dunn’s post-test for multiple comparisons. c In vitro suppressive capacity of CD27+CD70 and CD27CD70+ sorted Tregs. Left panel: Data from one representative donor. Right panel: Percentage suppression of CD4+ and CD8+ Tresp for 4–5 independent donors with each data point showing the mean of three replicate wells for each donor; calculated based on division index. Mean ± SEM, Kruskal–Wallis test with Dunn’s post-test for multiple comparisons. Red: CD27+CD70Tregs; Blue: CD27CD70+Tregs, both sorted after 2 weeks of expansion. d FOXP3 was analyzed in CD27/CD70 Treg subsets after 2 weeks of expansion. Top panel: histogram displays one representative donor (gray: isotype, red: CD27+CD70 Tregs, blue: CD27CD70+Tregs). Bottom panel: n = 16 independent donors. Mean ± SD, Mann–Whitney test. e, f DNA methylation pattern of the Treg-Specific Demethylation Region (TSDR) was assessed in CD27+CD70 and CD27CD70+Treg subsets from matched donors, sorted from freshly isolated and 2 weeks in vitro expanded CD4+CD25+CD127−/lowTregs. e Average methylation rate for 9 CpG motifs of the TSDR (n = 6 different donors). Top panel: Each box represents the percentage of methylation for each donor. Bottom panel: each dot denotes a donor. Mean ± SD, one-way ANOVA with Tukey post-test. f Each box represents the percentage of methylation of a single CpG residue for each donor at each time point (Left panel: day 0; right panel: 2 weeks) (n = 3 donors matched for each CD27/CD70 Treg subset). Bar colors designate: red: 0% methylation; yellow: 50% methylation; blue: 100% methylation. ns, non-significant.
Fig. 3
Fig. 3. Expanded CD27+CD70 Tregs retain suppressive potency.
a Schematic overview of Treg expansion strategies. CD4+CD25+CD127−/low Tregs were flow sorted from healthy donor PBMCs and expanded in vitro over two rounds of 7 days stimulated with anti-CD3/anti-CD28 coated beads (at a ratio of 1 bead to 1 cell) and rhIL-2 (1000U/ml) and rested for 2 days with a low concentration of rhIL-2 (250U/ml) and without stimulating beads. Tregs expanded for 2 weeks were flow sorted into CD27+CD70 and CD27CD70+ subsets. Total Tregs (black), flow sorted CD27+CD70 Tregs (red) and flow sorted CD27CD70+ Tregs (blue) were then cultured for a further 16 days before analysis. Dot plots from one representative donor are shown. Figures display percentages. b Left panel: FOXP3, CD27 and CD70 expression levels on expanded and then flow sorted CD27+CD70 and CD27CD70+ Tregs after a further 2 weeks of expansion. n = 16–18 independent donors, analyzed using a Mann–Whitney test. Data are represented as mean ± SD. Right panel: Histogram of FOXP3 expression levels for one representative donor (gray: isotype, red: CD27+CD70- Tregs, blue: CD27-CD70+ Tregs). c, d, c In vitro suppression assay of 4 week-expanded Treg populations in one representative donor at multiple Treg:Tresp ratios. Data shown are mean ± SD. d In vitro suppression assays from 14 independent donors at 1:1 (top) and 1/8:1 (bottom) ratios of Treg to Tresp. Each data point represents the mean of three replicate wells from each donor. Mean ± SEM is depicted. Black: total Treg, red: CD27+CD70, blue: CD27CD70+ Tregs. Data were analyzed using Kruskal–Wallis test with Dunn’s post-test. e The in vivo suppressive capacity of CD27/CD70 Treg subsets was assessed by transplanting VPD-labeled PBMCs together with 4-week expanded CD27+CD70 or CD27CD70+ Tregs (5:1 PBMC:Treg ratio) into the peritoneal cavity of immunodeficient mice. Top: Schematic representation of the experimental plan. Bottom: The proliferation index of PBMCs was studied by flow cytometry. Data were analyzed using a Kruskal–Wallis test with Dunn’s post-test for multiple comparisons and are represented as mean ± SD. A representative experiment of 1 cell donor out of 2 (4–5 mice per group per experiment, each mouse is represented as a data point). ns, non-significant.
Fig. 4
Fig. 4. Transcriptome differences between CD27+CD70 and CD27CD70+ expanded Tregs.
Thirty-two days-expanded Tregs (as shown in Fig. 3a) were re-sorted into CD27+CD70 and CD27CD70+ Tregs prior being assessed by RNA-seq analysis. a Heatmap and hierarchical clustering from RNA-seq data with Log2FC ≥ 6. The top 64 differentially expressed genes are shown. Data were analyzed using the edgeR package. b Venn diagram showing the overlap between genes overexpressed in Tregs and upregulated genes in CD27+CD70 Tregs or CD27-CD70+ Tregs. c Venn diagram showing the overlap between genes overexpressed in Tconv and upregulated genes in CD27+CD70- Tregs or CD27CD70+ Tregs. d, e: d HELIOS expression was measured in freshly isolated total Tregs or within different Treg subsets defined by CD27 and CD70 expression. (Left panel) Representative FACS plots of one donor (gray: isotype, black: total Tregs, red: CD27+CD70 Tregs, blue: CD27CD70+ Tregs, green: CD27+CD70+ Tregs, brown: CD27CD70 Tregs). (Right panel) Percentage of HELIOS+ cells in different CD27/CD70 Treg subsets. e HELIOS expression was analyzed in 2 week-expanded total Tregs or within different Treg subsets defined by CD27 and CD70 expression. Left panel: CD27/CD70 gating strategy. Figures show percentages. Middle panel: Representative FACS plots of one donor (gray: isotype, black: total Tregs, red: CD27+CD70- Tregs, blue: CD27CD70+ Tregs, green: CD27+CD70+ Tregs, brown: CD27CD70 Tregs). Right panel: Percentage of HELIOS+ cells in different CD27/CD70 Treg subsets. Mean ± SD is represented. n = 3–4 independent donors. Kruskal–Wallis test with Dunn’s post-test for multiple comparisons was conducted. Only significant statistical differences are shown. f CD25, GITR, CD39, TIGIT, CD40L, and HLA-DR protein expression was analyzed in 4 weeks expanded CD27+CD70 Tregs or CD27-CD70+ Tregs. N = 6–13 independent donors. Data were analyzed by Mann–Whitney test and represented as mean ± SD. ns, non-significant.
Fig. 5
Fig. 5. The CD27/CD70 co-stimulatory pathway contributes to Treg function.
Data shown for 4 week-expanded Tregs (sorted as total Tregs, expanded for 2 weeks, sorted by CD27/CD70, then expanded for 2 weeks). a, b: a Cartoon depicting Treg CD27 targeting strategies. Tregs were pre-incubated for 1 h with Fc-mutated blocking anti-CD27 mAb or non-mutated anti-CD27 mAb, followed by 1 h cross-linking with anti-human Ig antibody, or isotype matched antibodies. b Percentage suppression of CD4+ and CD8+ T cell proliferation by Tregs pre-incubated with anti-CD27 mAbs in 4 donors. CD8+T cells did not proliferate enough to perform analysis in 2 out of 4 donors. Friedman test with Dunn’s post-test for multiple comparisons. c Top panel: percentage suppression of CD8+Tresp cell proliferation by Treg subsets pre-incubated with anti-CD70 mAb or isotype antibody. n = 5–8 independent cell donors, Wilcoxon matched-pairs test. Bottom panel: proliferation of VPD-labeled CD8+Tresp co-cultured with Tregs pre-incubated with isotype or blocking anti-CD70 mAb, one representative donor. d, e: d Cartoon depicting CD27/CD70 blocking strategies. Tregs were pre-incubated with anti-CD70 blocking mAb or matched isotype Ab. Alternatively, soluble Fc-mutated blocking anti-CD27 mAb was added to the suppression assay to block CD27 on Tresp. e Left panel: Percentage of dividing VPD-stained CD4+ or CD8+ cells in the absence of Tregs (0:1) and in the presence of CD27-CD70+ Tregs pre-incubated with isotype or anti-CD70 blocking mAb (1:1 Treg:Tresp). Right panel: Percentage suppression of proliferation of CD4+ and CD8+ Tresp. n = 7 independent donors, Friedman test with Dunn’s post-test. b, c, e Graphs calculated based on division index and formula described in “Methods” section. fh: f VPD-labeled Tresp were co-cultured with CD27+CD70Tregs or CD27CD70+Tregs pre-incubated with isotype or anti-CD70 mAb in wells containing plate-bound anti-CD3 mAb (1 µg/ml). g Proliferation of CD8+ or CD4+Tresp in the absence of Tregs or when co-cultured with Treg subsets for one representative donor out of 5. h Division index of proliferating CD4+ and CD8+Tresp co-cultured with CD27CD70+Tregs pre-incubated with isotype mAb or blocking anti-CD70 mAb. n = 7 donors, Friedman test with Dunn’s post-test. b, c, e, h Each data point represents the mean of three replicate wells for each independent cell donor. ns, non-significant.
Fig. 6
Fig. 6. CD70 knockout Tregs display enhanced suppressive potency.
a Genetic editing efficiency across the CD70 locus was confirmed by analysis using ICE algorithm. Top panel: Level of discordance between control (orange) and edited (green) genetic sequences. Sequences between control and edited samples match before the PAM sequence (denoted by a dotted line) and are discordant after the cut site. Bottom panel: Graph shows the distribution of the detected indels in the edited sample. X-axis depict the size of the indel and Y-axis shows the frequency of each deletion in the cell product. 1 sgRNA for a representative donor is shown. b Percentage of CD70 and CD27 expression in control and CD70-KO cell products. Assays were repeated in 12 independent experiments. Data were analyzed using a Wilcoxon matched-pairs test. c Treg suppressive capacity was assessed in vitro using autologous VPD-labeled CD3+CD25 T cells as responders (Tresp) and allogenic mo-DCs as stimulators. Suppressive activity of control (non-edited) and CD70-KO cell products is represented for six independent experiments. Percentage suppression of proliferation of CD4+ Tresp and CD8+ Tresp is shown as mean ± SEM. Statistical significance was calculated using a Wilcoxon matched-pairs test. df CD70-KO Treg cell products were sorted by magnetic isolation or flow cytometry in CD27+CD70, CD27CD70+ and CD27CD70+ cells subsets before assessing d FOXP3 expression, e DNA methylation pattern of the TSDR, and f suppressive activity. Data shown for 4 independent experiments. d Left panel: histogram displays one representative donor (gray: isotype, red: CD27+CD70 Tregs, blue: CD27CD70+ Tregs, green: CD27CD70 Tregs). Right panel: Statistical significance was calculated using a Friedman test with Dunn’s post-test for multiple comparisons. e Average methylation rate for nine CpG motifs of the TSDR. Error bars indicate mean ± SD. Statistical significance was determined by a Wilcoxon matched-pairs test. f Treg suppressive capacity was assessed in vitro. Percentage suppression of proliferation of CD4+ Tresp and CD8+ Tresp is represented. Statistical analyses performed using Friedman test with Dunn’s post-test for multiple comparisons. ns, non-significant.
Fig. 7
Fig. 7. Identification of human CD70+ Tregs within the peripheral blood by integrated single-cell targeted simultaneous protein and mRNA analysis.
Data from primary resting CD4+ cells from the peripheral blood from one systemic lupus erythematosus (SLE) patient, one type I diabetes patient (T1D) and one healthy donor (HD) and analysed using targeted scRNA-seq and protein quantification with BD Rhapsody technology from Trzupek et al. were re-analysed with focus on CD70 expression. A detailed description of this methodology and analysis of these cells can be found in the ref. a Unsupervised hierarchical clustering combining mRNA and protein expression data visualized as a Uniform Manifold Approximation and Projection (UMAP) plot depicting the clustering of memory/effector CD4+ T cells from all three donors integrated from two independent experiments. b Heatmap for each CD4+ cluster showing the top differentially expressed genes and proteins. c Analysis of CD70+ cell frequency within each UMAP cluster in a. The number of cells with ≥1 copy of CD70 is displayed for each cluster. The majority of CD70 mRNA-expressing cells fall within Cluster 0 (Memory Tregs) and Cluster 13 (Activated Tregs). d UMAP plots depicting relative expression of CD70 mRNA for each patient, with Treg clusters highlighted. e Correlation analysis (Spearman correlation coefficient) of CD70 and each assessed mRNA and protein target in the Treg Cluster 0 (top) and Cluster 13 (bottom), with an enhanced view of the top 12 most positively (green) or negatively (red) correlated genes.

References

    1. Ferrer IR, Hester J, Bushell A, Wood KJ. Induction of transplantation tolerance through regulatory cells: from mice to men. Immunol. Rev. 2014;258:102–116. - PubMed
    1. Sakaguchi S. Naturally arising CD4+ regulatory t cells for immunologic self-tolerance and negative control of immune responses. Annu. Rev. Immunol. 2004;22:531–562. - PubMed
    1. Wood KJ, Sakaguchi S. Regulatory T cells in transplantation tolerance. Nat. Rev. Immunol. 2003;3:199–210. - PubMed
    1. Hori S, Nomura T, Sakaguchi S. Control of regulatory T cell development by the transcription factor Foxp3. Science. 2003;299:1057–1061. - PubMed
    1. Baron U, et al. DNA demethylation in the human FOXP3 locus discriminates regulatory T cells from activated FOXP3(+) conventional T cells. Eur. J. Immunol. 2007;37:2378–2389. - PubMed

Publication types

Substances