. 2020 Jul 14;11(1):3581.
doi: 10.1038/s41467-020-17488-8.

SARS-CoV-2 proteome microarray for global profiling of COVID-19 specific IgG and IgM responses

Affiliations

SARS-CoV-2 proteome microarray for global profiling of COVID-19 specific IgG and IgM responses

He-Wei Jiang et al. Nat Commun. .

Abstract

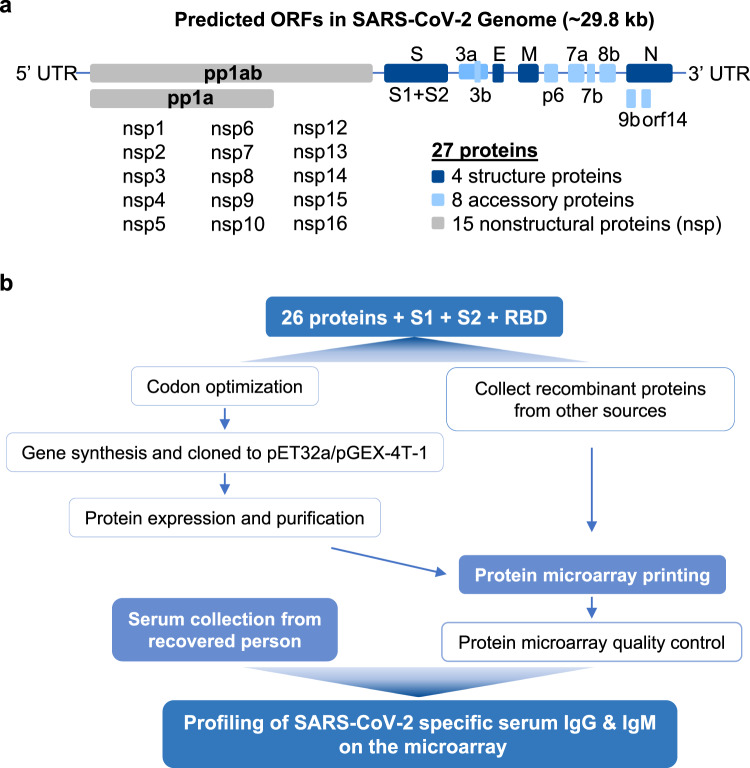
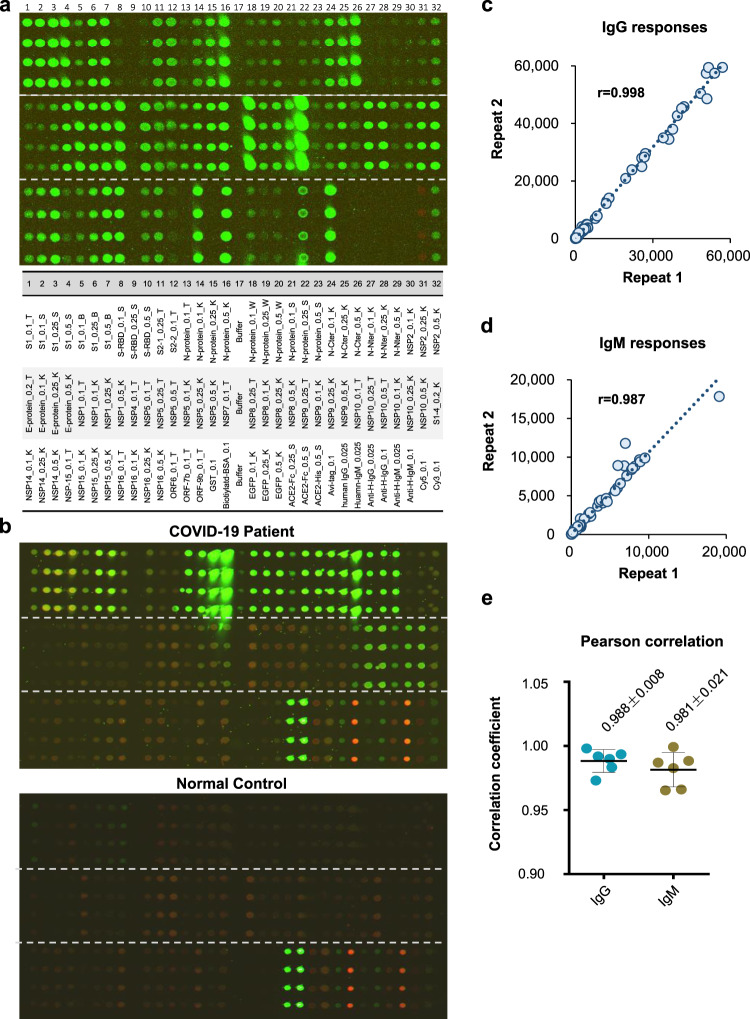
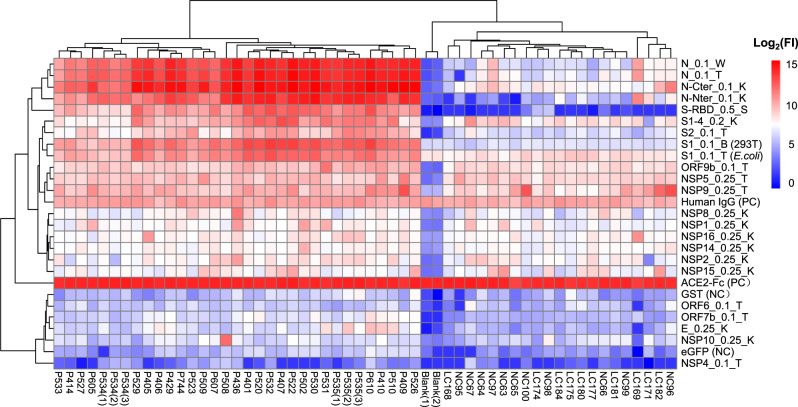
We still know very little about how the human immune system responds to SARS-CoV-2. Here we construct a SARS-CoV-2 proteome microarray containing 18 out of the 28 predicted proteins and apply it to the characterization of the IgG and IgM antibodies responses in the sera from 29 convalescent patients. We find that all these patients had IgG and IgM antibodies that specifically bind SARS-CoV-2 proteins, particularly the N protein and S1 protein. Besides these proteins, significant antibody responses to ORF9b and NSP5 are also identified. We show that the S1 specific IgG signal positively correlates with age and the level of lactate dehydrogenase (LDH) and negatively correlates with lymphocyte percentage. Overall, this study presents a systemic view of the SARS-CoV-2 specific IgG and IgM responses and provides insights to aid the development of effective diagnostic, therapeutic and vaccination strategies.


Conflict of interest statement

The authors declare no competing interests.

Figures

Fig. 1
Fig. 1. The workflow of SARS-CoV-2 proteome microarray fabrication and serum profiling.
a The genome of SARS-CoV-2 and the 28 predicted proteins. b The workflow of proteome microarray fabrication and serum profiling on the microarray.
Fig. 2
Fig. 2. SARS-CoV-2 proteome microarray layout and quality control.
a There are 14 identical subarrays on a single microarray. A microarray was incubated with an anti-6xHis antibody to demonstrate the overall microarray quality (green). One subarray was shown. The proteins were printed in quadruplicate. The triangles indicate dilution titers of the same proteins. b Representative subarrays probed with sera of a COVID-19 convalescent and healthy control. The IgG and IgM responses were shown in green and red, respectively. c, d The correlations of the overall IgG and IgM signal intensities between two repeats probed with the same serum. Proteins (n = 93) on the microarray were examined. e Statistics of the Pearson correlation confidence among repeats probed with the same serum. Two serum samples from the convalescent group was examined in three independent experiments. NC negative control, PC positive control; 0.1, 0.2, 0.25, and 0.5 indicate the concentration of these proteins for microarray printing. T Tao Lab, B Hangzhou Bioeast biotech. Co.,Ltd., K Healthcode Co., Ltd., S Sanyou biopharmaceuticals Co.,Ltd., W VACURE l Biotechnology Co.,Ltd., Y Sino biological Co.,Ltd. Expression system: (1) E. coli: All proteins from Tao Lab (T), N Protein _S, N Protein_W; (2) Cell-free: All proteins from Healthcode Co., Ltd. (K), (3) Mammalian: S1_B, S1_S, S-RBD_S, S-RBD_Y.
Fig. 3
Fig. 3. The overall SARS-CoV-2-specific IgG profiles of the 29 convalescent sera against the proteins.
Each square indicates the IgG antibody response against the protein (row) in the serum (column). Proteins were shown with names along with concentrations (μg mL−1) and sources. Sera were shown with group information and serum number. NCP Novel Coronavirus Patients or COVID-19 patients, LC lung cancer, NC normal control. Blank means no serum. Three repeats were performed for serum P534 and P535. FI fluorescence intensity.
Fig. 4
Fig. 4. The overall SARS-CoV-2-specific IgM profiles of the 29 convalescent sera against the proteins.
Each square indicates the IgM antibody response against the protein (row) in the serum (column). The rest was the same as that of Fig. 3.
Fig. 5
Fig. 5. IgG responses to S and N proteins.
a Box plots of IgG response for S1 and S2 proteins. The proteins labeled with bold and red were overexpression in mammalian cell lines. b Box plots of IgG response for N proteins. For a, b, each dot indicates one serum sample either from the convalescent group (green, n = 29) or the control group (brown, n = 21). Data are represented as boxplots where the middle line is the mean value. The upper and lower hinges are mean values ± SD. P values were calculated by the two-sided t-test. Q values were adjusted p-values using BH method. ***q < 0.001. The exact p-values were shown in Supplementary Data 2. c Pearson correlation coefficient matrix of IgG responses among different S1 and S2 proteins. df Correlations of overall IgG responses among different S1 proteins (d), S1 vs. RBD (e) and S1 vs. S2 (f). g One part of a sub-microarray showed the IgG responses of two controls, i.e., LC169 and NC96 against N proteins, N-Cter and N-Nter indicates the C-terminal and N-terminal of N protein, respectively. h, i Correlations of the overall IgG responses among different N proteins (h) and N protein vs. S protein (i). j Statistics of the Pearson correlation coefficients between IgG and IgM profile against constructs of S1 (n = 7), S-RBD (n = 2), S2 (n = 2), and N (n = 9). Data are presented as mean values ± SD. k Correlations between IgG and IgM profile against S1_0.1_W. For df, hk, each dot indicates one serum sample from the convalescent group (n = 29). For f and i, p-values were calculated by the two-sided t-test.
Fig. 6
Fig. 6. IgG response to other SARS-CoV-2 proteins.
a Other SARS-CoV-2 proteins that were recognized by IgG from the convalescent sera, in comparison to that of the controls. b, c Anti-ORF9b IgG (b) or anti-NSP5 IgG (c) in the patient and control group. For b, c, each dot indicates one serum sample either from the convalescent group (n = 29) or the control group (n = 21). Data are presented as mean values ± SD. The dashed line indicates cutoff value calculated as mean + 3x SD of the control group. P-values were calculated by the two-sided t-test and q-values were adjusted p-values using BH method. d, e Correlations of the overall IgG responses for N or S1 protein vs. ORF9b (d) or NSP5 (e). For d, e, each dot indicates one serum sample from the convalescent group (n = 29) and p-values were calculated by the two-sided t-test.
Fig. 7
Fig. 7. Correlations with clinical characteristics.
ad Correlations of S1 IgG responses with Days after COVID-19 onset (a), Age (b), peak LDH (c), and Ly% (d). For a–d, each dot indicates one serum sample from the convalescent group (n = 29). e S1 IgG responses in male (M, n = 13) and female (F, n = 16) groups. t-test Data are presented as mean values ± SD. For ae, p-values were calculated by two-sided t-test. f multiple linear regression model for S1 IgG. P-values for coefficient was calculated by two-sided t-test and p-value for regression model was calculated by one-sided F-test. *p < 0.05.

References

    1. Zhou P, et al. A pneumonia outbreak associated with a new coronavirus of probable bat origin. Nature. 2020;579:270–273. - PMC - PubMed
    1. Wu F, et al. A new coronavirus associated with human respiratory disease in China. Nature. 2020;579:265–269. - PMC - PubMed
    1. Wu A, et al. Genome composition and divergence of the novel coronavirus (2019-nCoV) originating in China. Cell Host Microbe. 2020;27:325–328. - PMC - PubMed
    1. Ge X-Y, et al. Isolation and characterization of a bat SARS-like coronavirus that uses the ACE2 receptor. Nature. 2013;503:535–538. - PMC - PubMed
    1. Wrapp D, et al. Cryo-EM structure of the 2019-nCoV spike in the prefusion conformation. Science. 2020;367:1260–1263. - PMC - PubMed

Publication types

MeSH terms