. 2020 Jul 14;10(1):11567.
doi: 10.1038/s41598-020-68468-3.

Standardization procedure for flow cytometry data harmonization in prospective multicenter studies

Collaborators, Affiliations

Standardization procedure for flow cytometry data harmonization in prospective multicenter studies

Lucas Le Lann et al. Sci Rep. .

Abstract

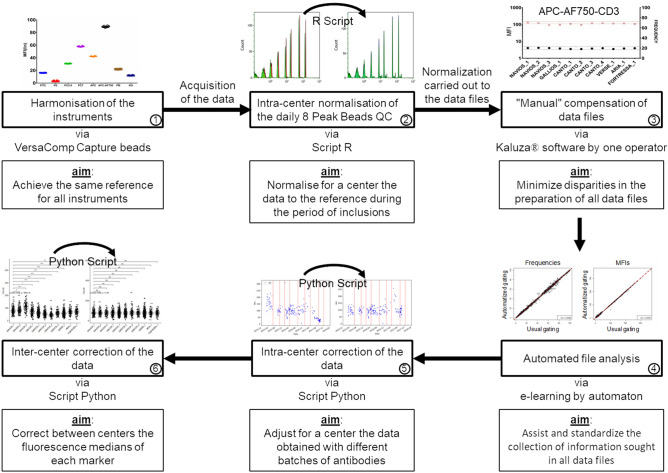
One of the most challenging objective for clinical cytometry in prospective multicenter immunomonitoring trials is to compare frequencies, absolute numbers of leukocyte populations and further the mean fluorescence intensities of cell markers, especially when the data are generated from different instruments. Here, we describe an innovative standardization workflow to compare all data to carry out any large-scale, prospective multicentric flow cytometry analysis whatever the duration, the number or type of instruments required for the realization of such projects.


Conflict of interest statement

M. H.-F. and J. M. are employees of UCB. A. B. and Z. M. are employees of BAYER Pharma. All other authors declare no competing financial and/or non-financial interests in relation to the work described.

Figures

Figure 1
Figure 1
Workflow of the standardization procedure for the harmonization of flow cytometry data in multicentric prospective studies. Flow cytometers are firstly harmonized using VersaComp capture beads to achieve the same reference for all instruments (step 1). For the acquisition of blood samples, 8 peak beads are used as daily quality control. A R script allows the normalization of the data for each instrument to the reference during the period of inclusions (step 2). The compensation of all flow cytometry files are verified and adjusted to minimize disparities in the data file preparation (step 3). Frequencies of the populations of interest and the mean fluorescence intensities of the cell surface markers are automatically collected from all flow cytometry files by automaton having learned the gating strategy through machine learning (step 4). The mean fluorescence intensities of the cell surface markers are corrected by a Python script to adjust the median values and eliminate antibody batches variations in each instrument (step 5). The mean fluorescence intensities are finally corrected by an additional python script to correct the variations of the median values between the instruments (step 6).
Figure 2
Figure 2
Evolution of principal component analysis during the workflow of the standardization procedure of flow cytometry data in multicentric prospective studies. Peripheral blood of 2,559 individuals was labeled with the dry panel 1 and panel 2 antibody formulations and then analyzed by flow cytometry using 11 different, previously harmonized instruments. The data of each instrument was then standardized by the R script. The frequencies of the leukocyte populations (panel 1) and mononuclear cells (panel 2) (a) and the mean fluorescence intensities of the cell surface markers (b) were collected from all flow cytometry files by automaton having learned the gating strategy through machine learning and were analyzed by principal component analysis (PCA). The mean fluorescence intensities of the cell surface markers were corrected by a Python script to adjust the median values and eliminate antibody batches variations in each instrument, before being analyzed by PCA (c). The mean fluorescence intensities were finally corrected by an additional Python script to eliminate the variations of the median values between the instruments, before being analyzed by PCA (d).

References

    1. Pedreira CE, et al. Overview of clinical flow cytometry data analysis: recent advances and future challenges. Trends Biotechnol. 2013;31:415–425. doi: 10.1016/j.tibtech.2013.04.008. - DOI - PubMed
    1. Bottcher S, et al. Lot-to-lot stability of antibody reagents for flow cytometry. J. Immunol. Methods. 2017 doi: 10.1016/j.jim.2017.03.018. - DOI - PubMed
    1. Ivison S, et al. A standardized immune phenotyping and automated data analysis platform for multicenter biomarker studies. JCI Insight. 2018 doi: 10.1172/jci.insight.121867. - DOI - PMC - PubMed
    1. Finak G, et al. Standardizing flow cytometry immunophenotyping analysis from the human immunophenotyping consortium. Sci. Rep. 2016;6:20686. doi: 10.1038/srep20686. - DOI - PMC - PubMed
    1. Kalina T, et al. Quality assessment program for EuroFlow protocols: summary results of four-year (2010–2013) quality assurance rounds. Cytometry A. 2015;87:145–156. doi: 10.1002/cyto.a.22581. - DOI - PubMed

Publication types