. 2021 Mar;35(3):796-808.
doi: 10.1038/s41375-020-0962-2. Epub 2020 Jul 14.

The mevalonate pathway is an actionable vulnerability of t(4;14)-positive multiple myeloma

Affiliations

The mevalonate pathway is an actionable vulnerability of t(4;14)-positive multiple myeloma

Joseph Longo et al. Leukemia. 2021 Mar.

Abstract

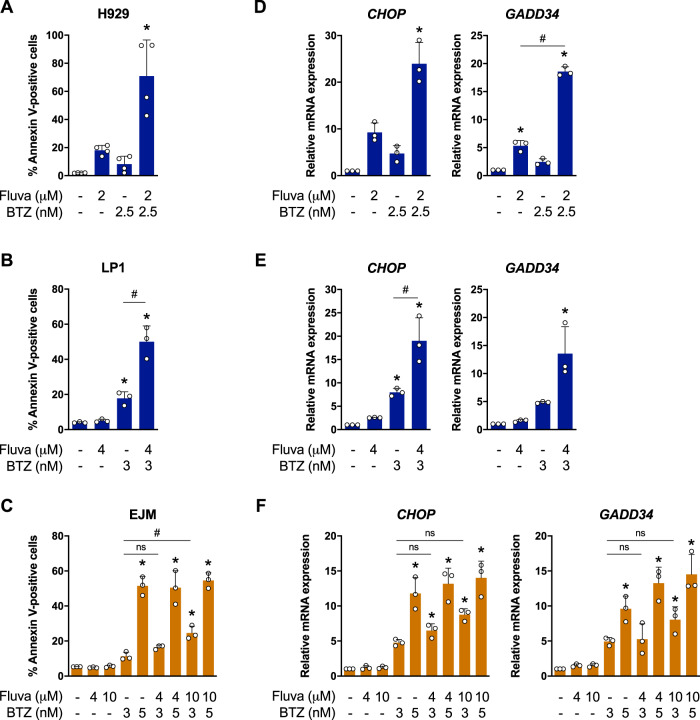
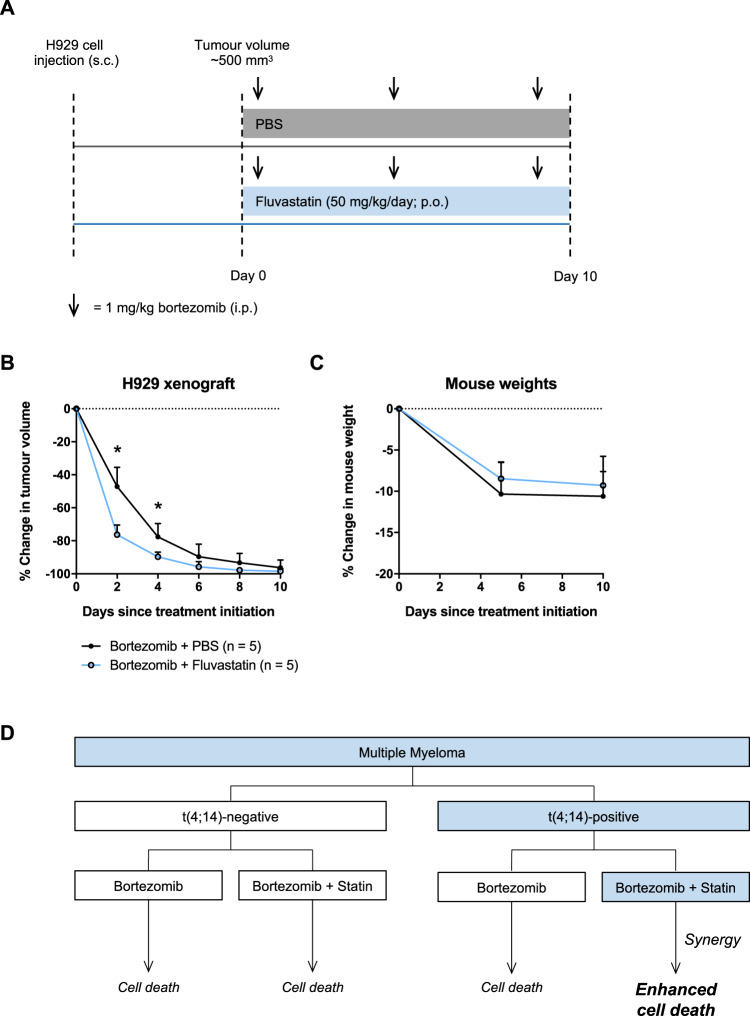
Multiple myeloma (MM) is a plasma cell malignancy that is often driven by chromosomal translocations. In particular, patients with t(4;14)-positive disease have worse prognosis compared to other MM subtypes. Herein, we demonstrated that t(4;14)-positive cells are highly dependent on the mevalonate (MVA) pathway for survival. Moreover, we showed that this metabolic vulnerability is immediately actionable, as inhibiting the MVA pathway with a statin preferentially induced apoptosis in t(4;14)-positive cells. In response to statin treatment, t(4;14)-positive cells activated the integrated stress response (ISR), which was augmented by co-treatment with bortezomib, a proteasome inhibitor. We identified that t(4;14)-positive cells depend on the MVA pathway for the synthesis of geranylgeranyl pyrophosphate (GGPP), as exogenous GGPP fully rescued statin-induced ISR activation and apoptosis. Inhibiting protein geranylgeranylation similarly induced the ISR in t(4;14)-positive cells, suggesting that this subtype of MM depends on GGPP, at least in part, for protein geranylgeranylation. Notably, fluvastatin treatment synergized with bortezomib to induce apoptosis in t(4;14)-positive cells and potentiated the anti-tumor activity of bortezomib in vivo. Our data implicate the t(4;14) translocation as a biomarker of statin sensitivity and warrant further clinical evaluation of a statin in combination with bortezomib for the treatment of t(4;14)-positive disease.


Conflict of interest statement

The authors declare that they have no conflict of interest.

Figures

Fig. 1
Fig. 1. The t(4;14) translocation is associated with statin sensitivity in MM.
a Schematic representation of the MVA pathway and its sterol-regulated feedback loop. Statins inhibit the rate-limiting enzyme of the MVA pathway, HMGCR. Statin-mediated cholesterol depletion activates the SREBP2 transcription factor, which induces genes involved in MVA metabolism, including HMGCR. b List of lovastatin-sensitive and insensitive MM cell lines previously characterized by Wong et al. [10]. c Differential gene expression analysis between statin-sensitive and insensitive MM cell lines listed in (b). The blue and red dots represent differentially expressed genes with a log2(fold change) >2 or <−2. The genes in red further pass the adjusted p value cut-off when corrected for multiple testing (Bonferroni correction). Black dots represent genes with no significant difference in expression between statin-sensitive and insensitive MM cell lines. d Sensitivity to fluvastatin determined by MTT assays following 48 h of treatment. Fluvastatin IC50 value and 95% confidence interval (CI) for each cell line are shown. The t(4;14) translocation status is indicated and t(4;14)-positive cell lines are shaded in gray. e Sensitivity to fluvastatin, lovastatin, and simvastatin in t(4;14)-positive or negative MM cell lines mined from the CTRPv2 database. Percent area above the drug dose-response curve (% AAC) values are plotted as a box plot with whiskers representing minimum and maximum values. A higher % AAC indicates greater drug sensitivity (unpaired, two-tailed Wilcoxon rank-sum test comparing t(4;14)-positive and negative MM cell lines). f Primary plasma cells from t(4;14)-positive or negative patients were cultured in the presence of 5 μM fluvastatin or ethanol as a solvent control. After 72 h, cells were labeled with PE-conjugated anti-CD138 and FITC-conjugated Annexin V, and then cells were analyzed by flow cytometry. The percent change in primary CD138+ cell viability is plotted. The data are represented as the mean ± SD, p value = 0.14 (unpaired, two-tailed Wilcoxon rank-sum test).
Fig. 2
Fig. 2. Fluvastatin induces the integrated stress response (ISR) in t(4;14)-positive MM cells.
H929 and KMS11 cells were treated with 2 μM fluvastatin or ethanol as a solvent control for 24 h, after which RNA was isolated and RNA-seq was performed. a Gene set enrichment analysis of ATF4 target genes in a gene list of fluvastatin-perturbed genes, ranked by fold change between fluvastatin-treated and ethanol-treated cells. b H929 and KMS11 cells were treated with solvent controls, 4 μM fluvastatin or 0.5 μg/mL tunicamycin for 24 h, after which protein was isolated and immunoblotting was performed to evaluate phosphorylated eIF2α, ATF4, and ATF3 expression. c t(4;14)-positive cells (H929, KMS11, OPM2, and LP1; in blue) and t(4;14)-negative cells (JJN3, SKMM1, U266, and EJM; in orange) were treated with ethanol control (0 h fluvastatin) or 4 μM fluvastatin for 16 or 24 h, after which RNA was isolated for qRT-PCR. The ATF4 target genes CHOP and GADD34 were evaluated and expression was normalized to RPL13A. The data are represented as the mean + SD, n = 3, *p < 0.05 (one-way ANOVA with Bonferroni’s multiple comparisons test, where each group was compared to the ethanol control).
Fig. 3
Fig. 3. Fluvastatin-induced apoptosis and ISR activation can be rescued by exogenous GGPP.
a t(4;14)-positive H929 or KMS11 cells were treated with 4 μM fluvastatin ± 2 μM GGPP or 10 μM FPP for 48 h, and apoptosis was determined by Annexin V staining. The data are represented as the mean + SD, n = 3, *p < 0.05 (one-way ANOVA with Bonferroni’s multiple comparisons test, where each group was compared to the solvent controls group). b H929 or KMS11 cells were treated with 4 μM fluvastatin ± 2 μM GGPP or 10 μM FPP for 24 h, after which b protein was isolated and immunoblotting was performed to evaluate ATF4 expression or c RNA was isolated for qRT-PCR. The ATF4 target genes CHOP and GADD34 were evaluated and expression was normalized to RPL13A. The data are represented as the mean + SD, n = 3, *p < 0.05 (one-way ANOVA with Bonferroni’s multiple comparisons test, where each group was compared to the solvent controls group). d H929, KMS11, U266, and EJM cells were treated with solvent controls, 4 μM fluvastatin, 10 μM GGTI-298, or 20 μM FTI-277 for 24 h, after which RNA was isolated for qRT-PCR. The ATF4 target genes CHOP and GADD34 were evaluated and expression was normalized to RPL13A. The data are represented as the mean + SD, n = 3, *p < 0.05 (one-way ANOVA with Bonferroni’s multiple comparisons test, where each group was compared to the solvent controls group).
Fig. 4
Fig. 4. Fluvastatin and bortezomib synergize to induce t(4;14)-positive MM cell death.
a H929 and b EJM cells were treated with fluvastatin (ranging from 0 to 4 μM for H929 and 0 to 8 μM for EJM) or bortezomib (ranging from 0 to 5 nM for both cell lines) as single agents or in combination for 48 h. The dose-response matrices, as determined by live-cell imaging and quantification of % dead cells, are representative of three independent experiments and depict the mean % dead cells ± SD. The mean % dead cell values for each dose combination were used to compute Bliss synergy scores for each cell line. Synergy plots for c H929 and d EJM cells are shown, where red represents synergy and green represents antagonism. e The Bliss synergy scores from the three independent experiments are plotted for H929 and EJM cells. The data are represented as the mean ± SD. The mean Bliss synergy score and 95% confidence interval (CI) of the mean for each cell line are reported in the table.
Fig. 5
Fig. 5. Fluvastatin and bortezomib cooperate to induce the ISR and cell death in t(4;14)-positive MM cells.
a H929, b LP1, or c EJM cells were treated with solvent controls, fluvastatin or bortezomib (BTZ) at the indicated concentrations for 48 h, and apoptosis was determined by Annexin V staining. The data are represented as the mean + SD, n = 3–4, *p < 0.05 (one-way ANOVA with Tukey’s multiple comparisons test, or Kruskal–Wallis test with Dunn’s multiple comparisons test (a), where each group was compared to the solvent controls group), #p < 0.05 (one-way ANOVA with Tukey’s multiple comparisons test, comparing the two indicated groups). d H929, e LP1, or f EJM cells treated with solvent controls, fluvastatin, or BTZ at the indicated concentrations for 24 h, and RNA was isolated for qRT-PCR. The ATF4 target genes CHOP and GADD34 were evaluated and expression was normalized to RPL13A. The data are represented as the mean + SD, n = 3, *p < 0.05 (one-way ANOVA with Tukey’s multiple comparisons test, where each group was compared to the solvent controls group), #p < 0.05 (one-way ANOVA with Tukey’s multiple comparisons test, comparing the two indicated groups).
Fig. 6
Fig. 6. Fluvastatin potentiates bortezomib activity in a t(4;14)-positive tumor model.
a NOD/SCID mice were injected with 5 million H929 cells subcutaneously (s.c.) in the flank. Once tumor volumes reached ~500 mm3, the mice were randomized to receive either bortezomib in combination with phosphate-buffered saline (PBS; vehicle control) or 50 mg/kg fluvastatin. Bortezomib was delivered twice per week at 1 mg/kg via intraperitoneal (i.p.) injection, up to a total of three doses. Fluvastatin was resuspended in PBS and delivered daily via oral gavage (per os; p.o.). Tumor measurement assessments were not blinded. b Percent change in tumor growth over time. The data are represented as the mean + SD, n = 5 mice per treatment group. *p < 0.05 (unpaired, two-tailed Wilcoxon rank-sum test). c Percent change in mouse body weight over the course of treatment. d Schematic diagram detailing the potential for statins to be used in combination with bortezomib for the personalized treatment of t(4;14)-positive MM.

References

    1. Bergsagel PL, Kuehl WM. Chromosome translocations in multiple myeloma. Oncogene. 2001;20:5611–22. doi: 10.1038/sj.onc.1204641. - DOI - PubMed
    1. Bergsagel PL, Kuehl WM. Molecular pathogenesis and a consequent classification of multiple myeloma. J Clin Oncol. 2005;23:6333–8. doi: 10.1200/JCO.2005.05.021. - DOI - PubMed
    1. Keats JJ, Reiman T, Maxwell CA, Taylor BJ, Larratt LM, Mant MJ, et al. In multiple myeloma, t(4;14)(p16;q32) is an adverse prognostic factor irrespective of FGFR3 expression. Blood. 2003;101:1520–9. doi: 10.1182/blood-2002-06-1675. - DOI - PubMed
    1. Jaksic W, Trudel S, Chang H, Trieu Y, Qi X, Mikhael J, et al. Clinical outcomes in t(4;14) multiple myeloma: a chemotherapy-sensitive disease characterized by rapid relapse and alkylating agent resistance. J Clin Oncol. 2005;23:7069–73. doi: 10.1200/JCO.2005.17.129. - DOI - PubMed
    1. Rajkumar SV, Gupta V, Fonseca R, Dispenzieri A, Gonsalves WI, Larson D, et al. Impact of primary molecular cytogenetic abnormalities and risk of progression in smoldering multiple myeloma. Leukemia. 2013;27:1738–44. doi: 10.1038/leu.2013.86. - DOI - PMC - PubMed

Publication types

MeSH terms