. 2020 Feb 7;42(2):10.1029/2019GB006241.
doi: 10.1029/2019GB006241.

A spatially explicit, empirical estimate of tree-based biological nitrogen fixation in forests of the United States

Affiliations

A spatially explicit, empirical estimate of tree-based biological nitrogen fixation in forests of the United States

Anika Staccone et al. Global Biogeochem Cycles. .

Abstract

Quantifying human impacts on the N cycle and investigating natural ecosystem N cycling depend on the magnitude of inputs from natural biological nitrogen fixation (BNF). Here, we present two bottom-up approaches to quantify tree-based symbiotic BNF based on forest inventory data across the coterminous US plus SE Alaska. For all major N-fixing tree genera, we quantify BNF inputs using (1) ecosystem N accretion rates (kg N ha-1 yr-1) scaled with spatial data on tree abundance and (2) percent of N derived from fixation (%Ndfa) scaled with tree N demand (from tree growth rates and stoichiometry). We estimate that trees fix 0.30-0.88 Tg N yr-1 across the study area (1.4-3.4 kg N ha-1 yr-1). Tree-based N fixation displays distinct spatial variation that is dominated by two genera, Robinia (64% of tree-associated BNF) and Alnus (24%). The third most important genus, Prosopis, accounted for 5%. Compared to published estimates of other N fluxes, tree-associated BNF accounted for 0.59 Tg N yr-1, similar to asymbiotic (0.37 Tg N yr-1) and understory symbiotic BNF (0.48 Tg N yr-1), while N deposition contributed 1.68 Tg N yr-1 and rock weathering 0.37 Tg N yr-1. Overall, our results reveal previously uncharacterized spatial patterns in tree BNF that can inform large-scale N assessments and serve as a model for improving tree-based BNF estimates worldwide. This updated, lower BNF estimate indicates a greater ratio of anthropogenic to natural N inputs, suggesting an even greater human impact on the N cycle.


Figures

Figure 1.
Figure 1.
Symbiotic N-fixing tree abundance across the coterminous USA and SE Alaska. a) Each point represents one mature tree in the FIA dataset and the color corresponds to genus. N-fixing tree genera are regionally constrained with Robinia in the east, Alnus in the Pacific Northwest, Prosopis in the southwest, and Cercocarpus in the southwest and UT. The basal area of symbiotic N-fixing trees is shown b) per forest area and c) per ground area for each 1° latitude x 1° longitude grid cell. White grid cells in b) and c) contain fewer than 2 FIA plots. Colors are on a logarithmic scale, but with numbers less than 0.1 m2 ha−1 (including 0) set to the darkest blue for plotting purposes.
Figure 2.
Figure 2.
Tree N fixation rate across the United States at the one degree scale. Tree N fixation rate calculated from a), b) our accretion method and c), d) our N demand method, a), c) per forest area and b), d) per ground area. White cells have fewer than 2 FIA plots. Colors are on a logarithmic scale, but with numbers less than 0.1 kg N ha−1 yr−1 (including 0) set to the darkest blue for plotting purposes.
Figure 3.
Figure 3.
Percent of tree-based N fixation by genus across the coterminous US and southeast AK. Error bars, which are so small on some bars that they are invisible, represent the standard deviation from bootstrapping fixation rates or %Ndfa at the continent scale 1000 times. Fractions are shown for a) our standard accretion method, b) a light limitation version of the accretion method where we assume that non-canopy trees do not fix N, c) our standard N demand method, and d) the upper bound of the N demand method (%Ndfa=100).
Figure 4.
Figure 4.
Sensitivity analysis. These plots show the percent change in tree-based N fixation across the coterminous US and southeast AK as the sensitivity to different factors for a) the accretion method and b) the N demand method. a) Each genus’ N fixation rate was varied from the upper to lower bounds of the 95% confidence interval in one genus at a time while all other genera were held constant at the mean value. In the N-fixer abundance analysis we increased and decreased plot level basal area by 50%. b) The C:N ratio of foliage, wood, and fine roots; N-fixer abundance (by aboveground biomass); and the foliar and fine root N resorption were increased and decreased by 50% to examine the effect of these factors on the overall BNF estimate.
Figure 5.
Figure 5.
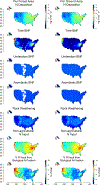
Comparison of N inputs to forested land across the coterminous US and southeast AK. The average N input rate (kg N ha−1 yr−1) per forest (a, c, e, g, i, k,, m) and per ground (b, d, f, h, j, l, n) across 1° x 1° grid cells is shown for total N deposition (a, b), N-fixing trees, accretion method (c, d), N-fixing understory plants assuming 2.20 kg N ha forest−1 yr−1 (e, f), asymbiotic N fixers assuming 1.70 kg N ha forest−1 yr−1 (g, h), and rock weathering (i, j). Also shown are the total non-agricultural N input rate per forest area and per ground area (N-fixing trees + N-fixing understory + N-fixing asymbiotic + N deposition + rock weathering) (k, l), and the percent of the total N input from biological sources: (N-fixing trees + N-fixing understory + N-fixing asymbiotic)/total N (m, n) across 1° x 1° grid cells per forest and per ground. Colors in all panels except f and l are on a square root scale, but with numbers less than 0.1 kg N ha−1 yr−1 (including 0) set to the darkest blue for plotting purposes.
Figure 6.
Figure 6.
Percent non-agricultural N Input from tree N fixation in forests. This map shows the percent of N inputs in forested areas that comes from N-fixing trees as opposed to biological N fixation in the understory, asymbiotic biological N fixation, N deposition, and rock weathering. a) accretion method, b) N demand method.

References

    1. Abrahamson I. (2019). Fire Effects Informatoin System (FEIS). Retrieved from https://www.feis-crs.org/feis/
    1. Ackerly D. (2004). Functional strategies of chaparral shrubs in relation to seasonal water deficit and disturbance. Ecological Monographs, 74(1), 25–44.
    1. Antoine E. (2004). An ecophysiological approach to quantifying nitrogen fixation by Lobaria oregana. The Bryologist, 107(1), 82–87.
    1. Azani N, Babineau M, Bailye CD, Banks H, Barbosa A, Pinto RB, et al. (2017). A new subfamily classification of the Leguminosae based on a taxonomically comprehensive phylogeny – The Legume Phylogeny Working Group (LPWG). Taxon, 66(2016), 44–77. 10.12705/661.3 - DOI
    1. Batterman SA, Hedin LO, van Breugel M, Ransijn J, Craven DJ, & Hall JS (2013). Key role of symbiotic dinitrogen fixation in tropical forest secondary succession. Nature, 502(7470), 224–227. 10.1038/nature12525 - DOI - PubMed

LinkOut - more resources