

A novel method for measuring absolute coronary blood flow and microvascular resistance in patients with ischaemic heart disease
- PMID: 32666101
- PMCID: PMC8152717
- DOI: 10.1093/cvr/cvaa220
A novel method for measuring absolute coronary blood flow and microvascular resistance in patients with ischaemic heart disease
Abstract
Aims: Ischaemic heart disease is the reduction of myocardial blood flow, caused by epicardial and/or microvascular disease. Both are common and prognostically important conditions, with distinct guideline-indicated management. Fractional flow reserve (FFR) is the current gold-standard assessment of epicardial coronary disease but is only a surrogate of flow and only predicts percentage flow changes. It cannot assess absolute (volumetric) flow or microvascular disease. The aim of this study was to develop and validate a novel method that predicts absolute coronary blood flow and microvascular resistance (MVR) in the catheter laboratory.
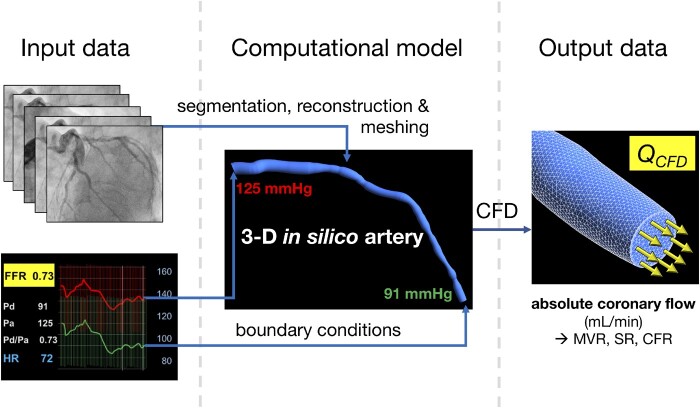
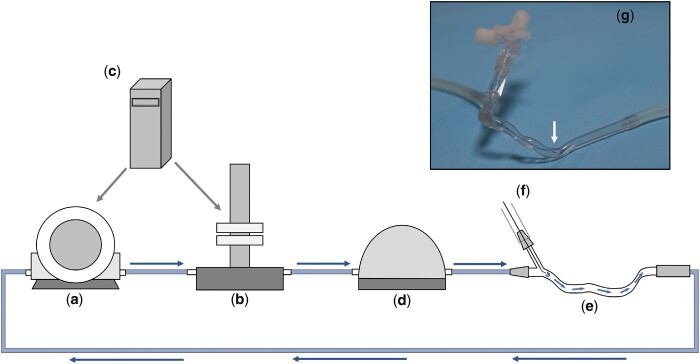
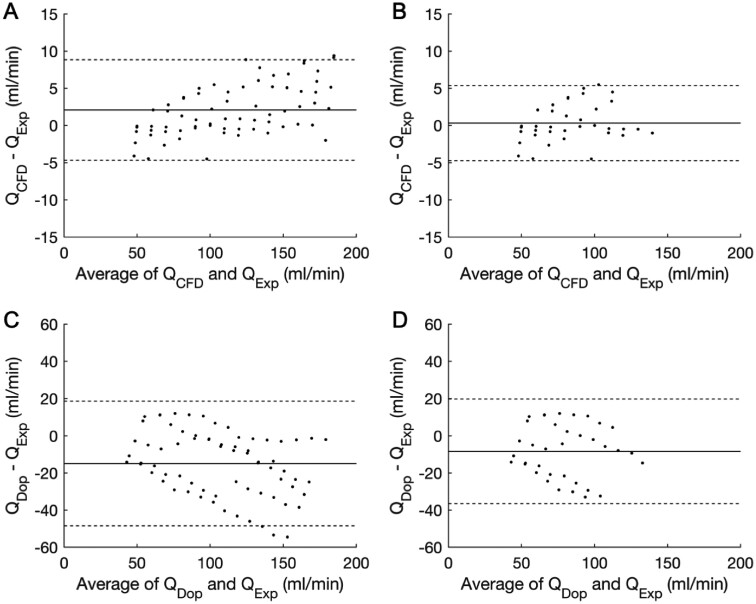
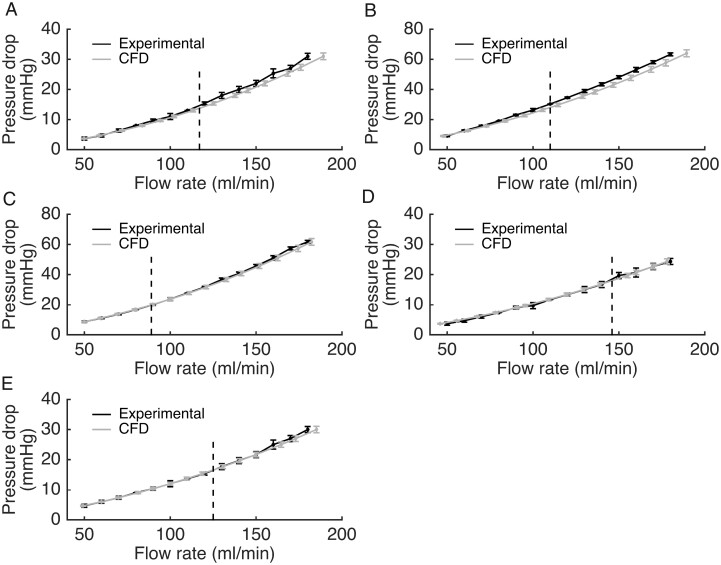
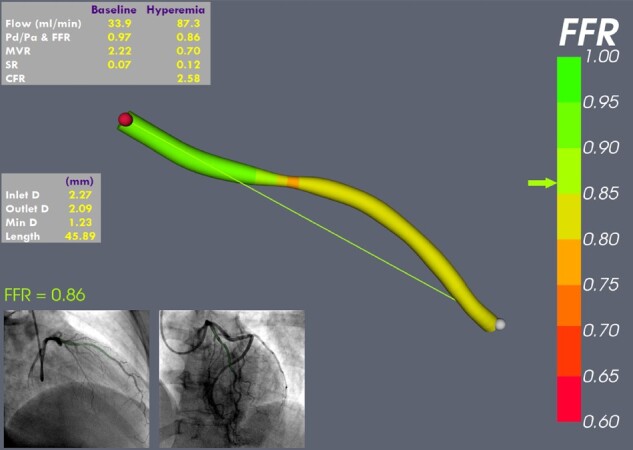
Methods and results: A computational fluid dynamics (CFD) model was used to predict absolute coronary flow (QCFD) and coronary MVR using data from routine invasive angiography and pressure-wire assessment. QCFD was validated in an in vitro flow circuit which incorporated patient-specific, three-dimensional printed coronary arteries; and then in vivo, in patients with coronary disease. In vitro, QCFD agreed closely with the experimental flow over all flow rates [bias +2.08 mL/min; 95% confidence interval (error range) -4.7 to +8.8 mL/min; R2 = 0.999, P < 0.001; variability coefficient <1%]. In vivo, QCFD and MVR were successfully computed in all 40 patients under baseline and hyperaemic conditions, from which coronary flow reserve (CFR) was also calculated. QCFD-derived CFR correlated closely with pressure-derived CFR (R2 = 0.92, P < 0.001). This novel method was significantly more accurate than Doppler-wire-derived flow both in vitro (±6.7 vs. ±34 mL/min) and in vivo (±0.9 vs. ±24.4 mmHg).
Conclusions: Absolute coronary flow and MVR can be determined alongside FFR, in absolute units, during routine catheter laboratory assessment, without the need for additional catheters, wires or drug infusions. Using this novel method, epicardial and microvascular disease can be discriminated and quantified. This comprehensive coronary physiological assessment may enable a new level of patient stratification and management.
Keywords: Computational fluid dynamics; Coronary angiography; Coronary blood flow; Coronary microvascular dysfunction; Coronary physiology.
© The Author(s) 2020. Published by Oxford University Press on behalf of the European Society of Cardiology.
Figures
Comment in
-
Flow, pressure, anatomy: an eternal golden braid.Cardiovasc Res. 2021 May 25;117(6):1426-1427. doi: 10.1093/cvr/cvab079. Cardiovasc Res. 2021. PMID: 33713120 No abstract available.
References
-
- Pijls NH, De Bruyne B, Peels K, Van Der Voort PH, Bonnier HJ, Bartunek J, Koolen JJ.. Measurement of fractional flow reserve to assess the functional severity of coronary-artery stenoses. N Engl J Med 1996;334:1703–1708. - PubMed
-
- De Bruyne B, Pijls NH, Kalesan B, Barbato E, Tonino PA, Piroth Z, Jagic N, Mobius-Winckler S, Rioufol G, Witt N, Kala P, MacCarthy P, Engstrom T, Oldroyd KG, Mavromatis K, Manoharan G, Verlee P, Frobert O, Curzen N, Johnson JB, Juni P, Fearon WF; FAME 2 Trial Investigators. Fractional flow reserve-guided PCI versus medical therapy in stable coronary disease. N Engl J Med 2012;367:991–1001. - PubMed
-
- Gotberg M, Christiansen EH, Gudmundsdottir IJ, Sandhall L, Danielewicz M, Jakobsen L, Olsson SE, Ohagen P, Olsson H, Omerovic E, Calais F, Lindroos P, Maeng M, Todt T, Venetsanos D, James SK, Karegren A, Nilsson M, Carlsson J, Hauer D, Jensen J, Karlsson AC, Panayi G, Erlinge D, Frobert O, Frsi I.. Instantaneous wave-free ratio versus fractional flow reserve to guide PCI. N Engl J Med 2017;376:1813–1823. - PubMed
-
- Carrick D, Haig C, Ahmed N, Carberry J, Yue May VT, McEntegart M, Petrie MC, Eteiba H, Lindsay M, Hood S, Watkins S, Davie A, Mahrous A, Mordi I, Ford I, Radjenovic A, Oldroyd KG, Berry C.. Comparative prognostic utility of indexes of microvascular function alone or in combination in patients with an acute ST-segment-elevation myocardial infarction. Circulation 2016;134:1833–1847. - PMC - PubMed
-
- Martinez GJ, Yong AS, Fearon WF, Ng MK.. The index of microcirculatory resistance in the physiologic assessment of the coronary microcirculation. Coron Artery Dis 2015;26(Suppl 1):e15–e26. - PubMed
Publication types
MeSH terms
Grants and funding
LinkOut - more resources
Full Text Sources
Other Literature Sources
Miscellaneous
