Review
. 2020 Oct;111(5):726-736.
doi: 10.17269/s41997-020-00348-9. Epub 2020 Jul 14.

The Canadian Health Clock and health calculators

Affiliations
Review

The Canadian Health Clock and health calculators

Bernard C K Choi et al. Can J Public Health. 2020 Oct.

Abstract

Setting: This paper documents a participatory process of Health Portfolio staff in the design of a clock, and announces the 2020 Canadian Health Clock, with links to numerous online health calculators. The clock is part of the Health Portfolio's celebration activities in 2019 of "100 Years of Health", as the Department of Health was established in Canada in 1919.

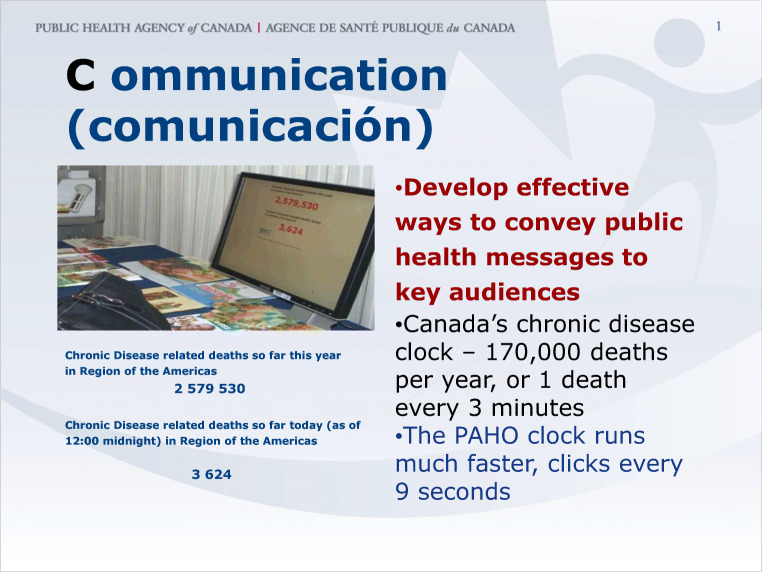
Intervention: The intervention was the development of a clock on the Government of Canada website with linkage to calculators as a health promotion tool. The clock was built on the concept of the 2004 Chronic Disease Clock, which shows the number of deaths so far today, and so far this year. The clock was developed using a consultative approach, following a review of the original clock.

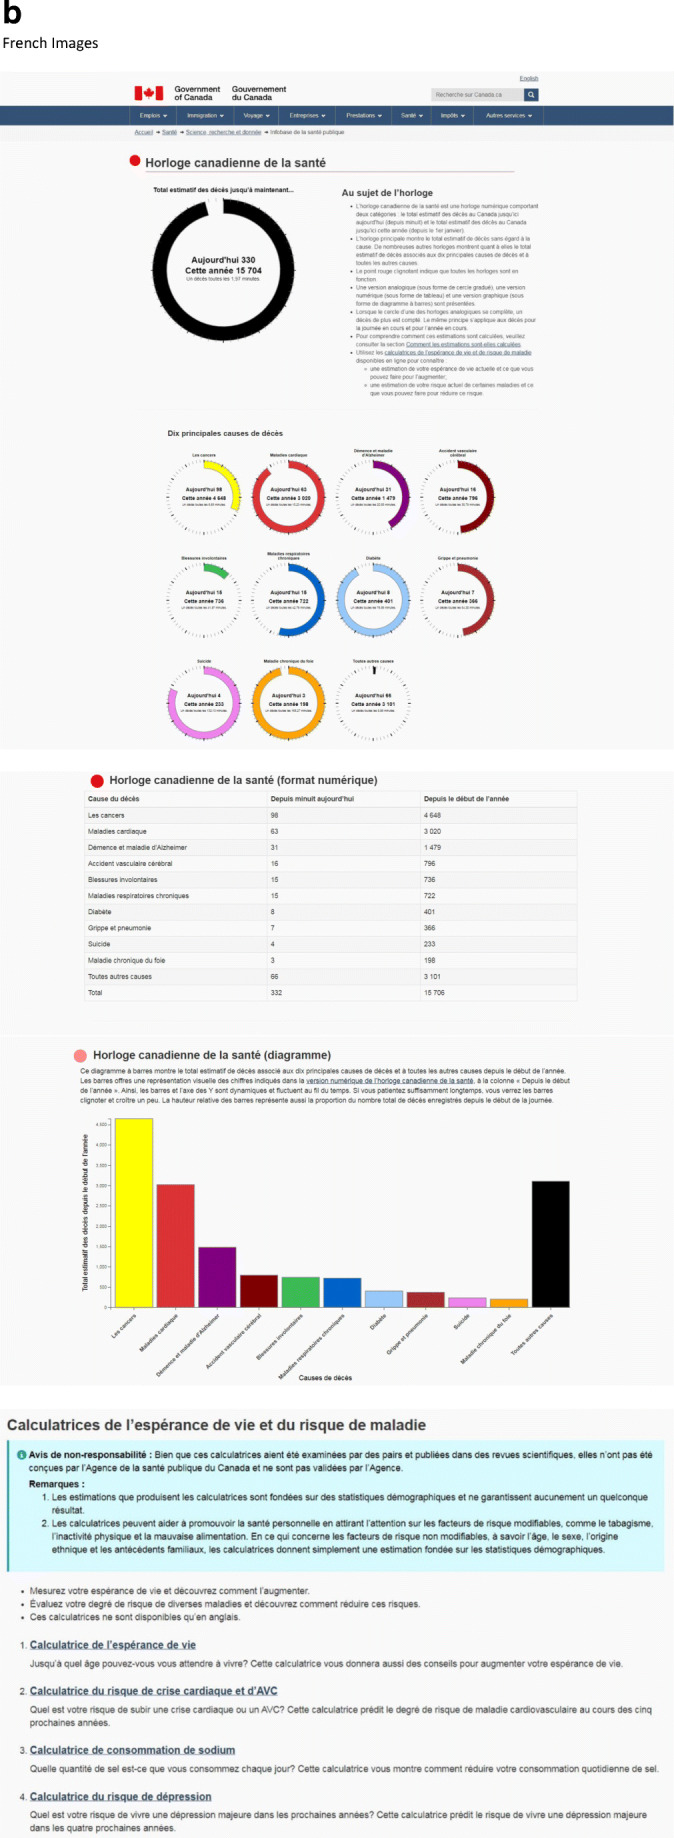
Outcomes: The 2020 clock incorporates new data visualization concepts. New features, facilitated by improved technology, include: expansion to all causes of death; blinking red dots to enhance visual impact; and three clock versions (analogue, featuring a moving circle; digital, table format; and graphical, bar chart format). The clock also provides links to a number of health calculators, to allow people to seek personalized information to improve their health.

Implications: The online health clock and health calculators are good examples of innovation in health risk communication tools for effective knowledge translation and dissemination. They inform people about health statistics (clock) and their health (calculators). The clock engages people in the context of the Canadian population, whereas the calculators provide personalized information about improving an individual's future health.

Contexte: Ce document présente un processus participatif pour le personnel du portefeuille de la Santé relativement à la conception d’une horloge. Il annonce la création de l’horloge canadienne de la santé 2020, qui comprend des liens vers de nombreux calculateurs de la santé en ligne. L’horloge fait partie des activités de célébration de 2019 du portefeuille de la Santé pour souligner les « 100 ans d’expertise en santé », la création du ministère de la Santé au Canada remontant à 1919.

Intervention: L’intervention consistait à créer une horloge sur le site Web du gouvernement du Canada et à y ajouter des liens vers des calculateurs comme outil de promotion de la santé. L’horloge a été conçue sur le modèle de l’horloge des maladies chroniques de 2004, qui montre le nombre de décès depuis le début de la journée et depuis le début de l’année. L’horloge a été élaborée selon une approche consultative, à la suite de l’examen de l’horloge originale.

Résultats: L’horloge 2020 intègre de nouveaux concepts en matière de visualisation des données. Les nouvelles fonctionnalités, dont l’intégration a été simplifiée grâce à une technologie améliorée, comprennent notamment les suivantes : inclusion de toutes les causes de décès; points rouges clignotants pour accentuer l’effet visuel; et trois versions d’horloge (analogique, avec un cercle en mouvement; numérique, en format de tableau; et graphique, en format de diagramme). L’horloge contient aussi des liens vers un certain nombre de calculatrices de la santé afin de permettre aux personnes de trouver des renseignements personnalisés pour améliorer leur santé.

Conséquences: L’horloge de la santé en ligne et les calculateurs de la santé sont de bons exemples d’outils novateurs de communication des risques pour la santé qui permettent une application et une diffusion efficaces des connaissances. Ces outils donnent aux gens la possibilité de se renseigner à la fois sur les statistiques en santé (horloge) et sur leur propre santé (calculateurs). L’horloge suscite l’intérêt des gens dans le contexte de la population canadienne, alors que les calculateurs offrent des renseignements personnalisés sur l’amélioration de la santé future d’une personne.

Keywords: Data visualization; Health calculator; Health clock; Information dissemination; Innovation; Public health.


Conflict of interest statement

The authors declare that they have no conflict of interest.

Figures

Fig. 1
Fig. 1
(a) The 2004 Chronic Disease Clock (Canada): A virtual clock set up on the Public Health Agency of Canada (PHAC)’s Centre for Chronic Disease Prevention and Control (CCDPC) website from 2004 to 2012 (now available on archive https://web.archive.org/web/20050407215825/http://www.phac-aspc.gc.ca:80/ccdpc-cpcmc/index_e.html). (b) Technical specifications for the 2004 Chronic Disease Clock (Canada). The 2004 Chronic Disease Clock is based on the most recently available mortality data in Canada which is 2001. Data are from Statistics Canada Health Statistics Division’s Canadian mortality data, obtained through Public Health Agency of Canada’s ORIUS database. Data are for Canada for both sexes and all ages combined. Chronic diseases, for the purpose of the Chronic Disease Clock, include the following six disease categories: cardiovascular disease (Circulatory Disease ICD-10* I00–I99), cancer (Neoplasm ICD-10 C00–D48), chronic respiratory disease (Respiratory Disease ICD-10 J00–J98 minus pneumonia ICD-10 J12–J18, minus influenza ICD-10 J10–J11 and minus bronchitis ICD-10 J40–J42), diabetes (ICD-10 E10–E14), mental disorders (ICD-10 F00–F89) and musculoskeletal (ICD-10 M00–M99). *ICD-10, International Classification of Diseases, 10th revision (WHO 2016)
Fig. 2
Fig. 2
The 2007 Chronic Disease Clock (Region of the Americas): A physical clock set up on a laptop computer, powered by programs on a compact disc (CD), and displayed at the Pan American Health Organization (PAHO) Headquarters in Washington, DC, for World Heart Day on September 30, 2007
Fig. 3
Fig. 3
The 2008 Chronic Disease Clock: A physical clock set up on a laptop computer and announced by the Public Health Agency of Canada at the Chronic Disease Prevention Alliance of Canada (CDPAC) 2008 Conference in Ottawa, November 24–26, 2008
Fig. 4
Fig. 4
(a) The 2020 Canadian Health Clock: An online clock that shows the number of deaths so far today and so far this year, available on the Public Health Agency of Canada website, as part of the year-long celebration activities in Canada in 2019 of “100 Years of Health” ([English] https://health-infobase.canada.ca/datalab/canadian-health-clock.html [French] https://sante-infobase.canada.ca/labo-de-donnees/horloge-canadienne-de-la-sante.html). (b) Technical specifications for the 2020 Canadian Health Clock. The clock provides estimates that are based on retrospective data, that is, the most recent available mortality data. For example, the 2020 clock is based on actual 2016 mortality data (Fig. 4b). The numbers of deaths so far today (as of 12:00 midnight) and so far this year (as of January 1) are estimated by apportioning the annual number of deaths according to a year of 365.2422 days, and a day of 24.0000 h. Note that: (1) For simplicity, the same apportioning method applies to all different causes of death. For example, no special treatment is made for “Influenza and Pneumonia” to obtain daily death estimates excluding seasonal fluctuations. Therefore, during influenza seasons, the daily number of deaths from “Influenza and Pneumonia” is expected to be higher than that shown in the clock. (2) The estimates for deaths from chronic conditions are likely underestimates because many chronic conditions are often not a direct cause of death. For example, people with chronic obstructive pulmonary disease (COPD) often die of pneumonia. (3) The estimates for diabetes deaths are likely underestimates, given the limitations of death certificates to understanding diabetes deaths. (4) Deaths per day or per minute is popular, but it must be recognized that there is not an assembly line of death, and deaths are sporadic. (5) All estimated numbers of deaths so far today and this year, and estimated number of minutes to achieve one death, are based on apportioning (the assumption of an assembly line), and therefore should not be taken to suggest any level of precision that is not present. Annual numbers of deaths, by cause of death in ICD-10 codes*, for Canada (2016), are shown in Fig. 4b. Data sources for Fig. 4b: Data for all deaths and nine of the top 10 causes of death are obtained directly from publicly available online data from Statistics Canada for Canada for 2016, Table: 13-10-0394-01, which lists the annual numbers of deaths from the top 10 and top 50 causes of death in Canada from 2012 to 2016 (Reference: Statistics Canada, 2018. Table: 13-10-0394-01 (formerly CANSIM 102–0561). Leading causes of death, total population, by age group https://www150.statcan.gc.ca/t1/tbl1/en/tv.action?pid=1310039401). The number of deaths for “Dementia and Alzheimer’s Disease” is obtained by the Public Health Agency of Canada from custom tabulation from Statistics Canada. It is necessary to add dementia to Alzheimer’s disease as Statistics Canada uses a list developed by the US National Center for Health Statistics (NCHS) for ranking. Since dementia is not in the US list, it does not make it into Statistics Canada’s top 10 or even top 50 causes of death, even with 18,649 deaths, while Alzheimer’s disease (ICD-10 G30), in the US list, ranks number 7 with 6521 deaths in 2016. Together, dementia and Alzheimer’s disease ranks number 3. *ICD-10, International Classification of Diseases, 10th revision (WHO 2016)
Fig. 4
Fig. 4
(a) The 2020 Canadian Health Clock: An online clock that shows the number of deaths so far today and so far this year, available on the Public Health Agency of Canada website, as part of the year-long celebration activities in Canada in 2019 of “100 Years of Health” ([English] https://health-infobase.canada.ca/datalab/canadian-health-clock.html [French] https://sante-infobase.canada.ca/labo-de-donnees/horloge-canadienne-de-la-sante.html). (b) Technical specifications for the 2020 Canadian Health Clock. The clock provides estimates that are based on retrospective data, that is, the most recent available mortality data. For example, the 2020 clock is based on actual 2016 mortality data (Fig. 4b). The numbers of deaths so far today (as of 12:00 midnight) and so far this year (as of January 1) are estimated by apportioning the annual number of deaths according to a year of 365.2422 days, and a day of 24.0000 h. Note that: (1) For simplicity, the same apportioning method applies to all different causes of death. For example, no special treatment is made for “Influenza and Pneumonia” to obtain daily death estimates excluding seasonal fluctuations. Therefore, during influenza seasons, the daily number of deaths from “Influenza and Pneumonia” is expected to be higher than that shown in the clock. (2) The estimates for deaths from chronic conditions are likely underestimates because many chronic conditions are often not a direct cause of death. For example, people with chronic obstructive pulmonary disease (COPD) often die of pneumonia. (3) The estimates for diabetes deaths are likely underestimates, given the limitations of death certificates to understanding diabetes deaths. (4) Deaths per day or per minute is popular, but it must be recognized that there is not an assembly line of death, and deaths are sporadic. (5) All estimated numbers of deaths so far today and this year, and estimated number of minutes to achieve one death, are based on apportioning (the assumption of an assembly line), and therefore should not be taken to suggest any level of precision that is not present. Annual numbers of deaths, by cause of death in ICD-10 codes*, for Canada (2016), are shown in Fig. 4b. Data sources for Fig. 4b: Data for all deaths and nine of the top 10 causes of death are obtained directly from publicly available online data from Statistics Canada for Canada for 2016, Table: 13-10-0394-01, which lists the annual numbers of deaths from the top 10 and top 50 causes of death in Canada from 2012 to 2016 (Reference: Statistics Canada, 2018. Table: 13-10-0394-01 (formerly CANSIM 102–0561). Leading causes of death, total population, by age group https://www150.statcan.gc.ca/t1/tbl1/en/tv.action?pid=1310039401). The number of deaths for “Dementia and Alzheimer’s Disease” is obtained by the Public Health Agency of Canada from custom tabulation from Statistics Canada. It is necessary to add dementia to Alzheimer’s disease as Statistics Canada uses a list developed by the US National Center for Health Statistics (NCHS) for ranking. Since dementia is not in the US list, it does not make it into Statistics Canada’s top 10 or even top 50 causes of death, even with 18,649 deaths, while Alzheimer’s disease (ICD-10 G30), in the US list, ranks number 7 with 6521 deaths in 2016. Together, dementia and Alzheimer’s disease ranks number 3. *ICD-10, International Classification of Diseases, 10th revision (WHO 2016)

References

    1. Ancker JS, Senathirajah Y, Kukafka R, Starren JB. Design features of graphs in health risk communication: a systematic review. Journal of the American Medical Informatics Association. 2006;13(6):608–618. doi: 10.1197/jamia.M2115. - DOI - PMC - PubMed
    1. Arcand J, Abdulaziz K, Bennett C, L'abbé MR, Manuel DG. Developing a Web-based dietary sodium screening tool for personalized assessment and feedback. Applied Physiology, Nutrition, and Metabolism. 2014;39(3):413–414. doi: 10.1139/apnm-2013-0322. - DOI - PMC - PubMed
    1. Bennett P, Calman K, Curtis S, Smith D. Risk communication and public health. Oxford: Oxford University Press; 2010.
    1. Choi, B. C. K. (2005a). Innovative ideas needed for timely and effective public health information dissemination. Journal of Epidemiology and Community Health, 59, 259. Available from: http://jech.bmjjournals.com/cgi/content/full/59/4/259. Accessed 6 May 2019). - PMC - PubMed
    1. Choi, B. C. K. (2005b). Twelve essentials of science-based policy. Preventing Chronic Diseases, 2(4), A16. Available from: http://www.cdc.gov/pcd/issues/2005/oct/05_0005.htm. Accessed 6 May 2019. - PMC - PubMed

LinkOut - more resources