. 2020 Oct;104(2):416-432.
doi: 10.1111/tpj.14932. Epub 2020 Aug 19.

Lipid kinases PIP5K7 and PIP5K9 are required for polyamine-triggered K+ efflux in Arabidopsis roots

Affiliations

Lipid kinases PIP5K7 and PIP5K9 are required for polyamine-triggered K+ efflux in Arabidopsis roots

Xavier Zarza et al. Plant J. 2020 Oct.

Abstract

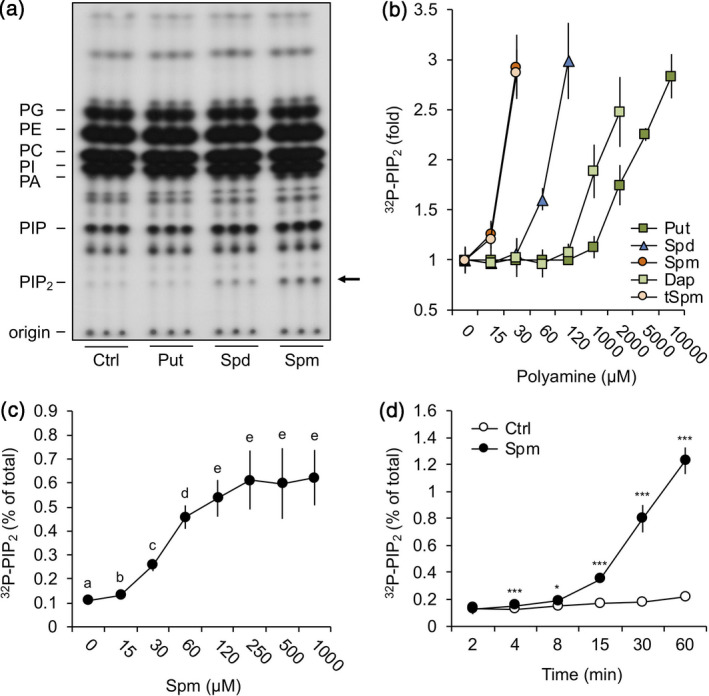
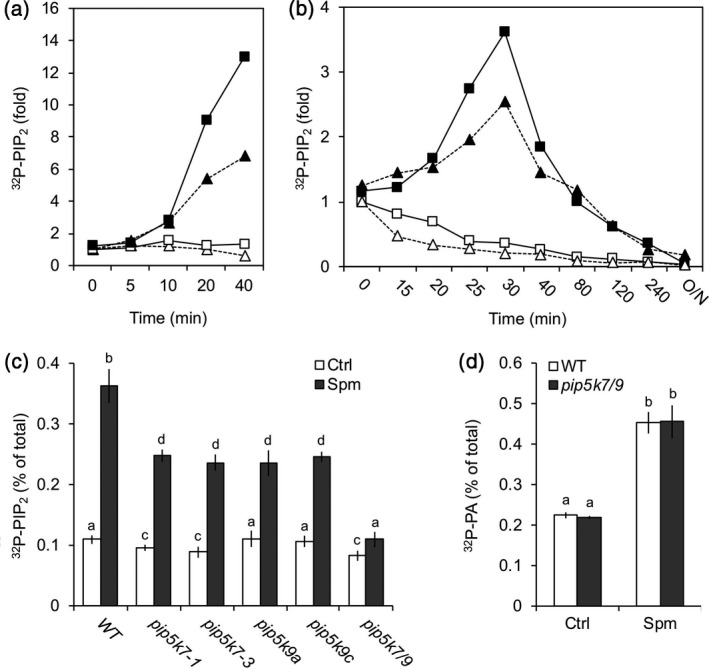
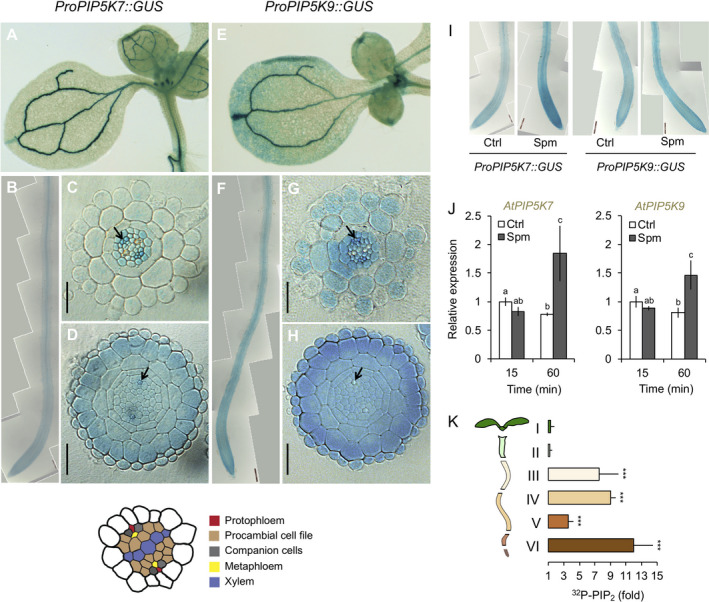
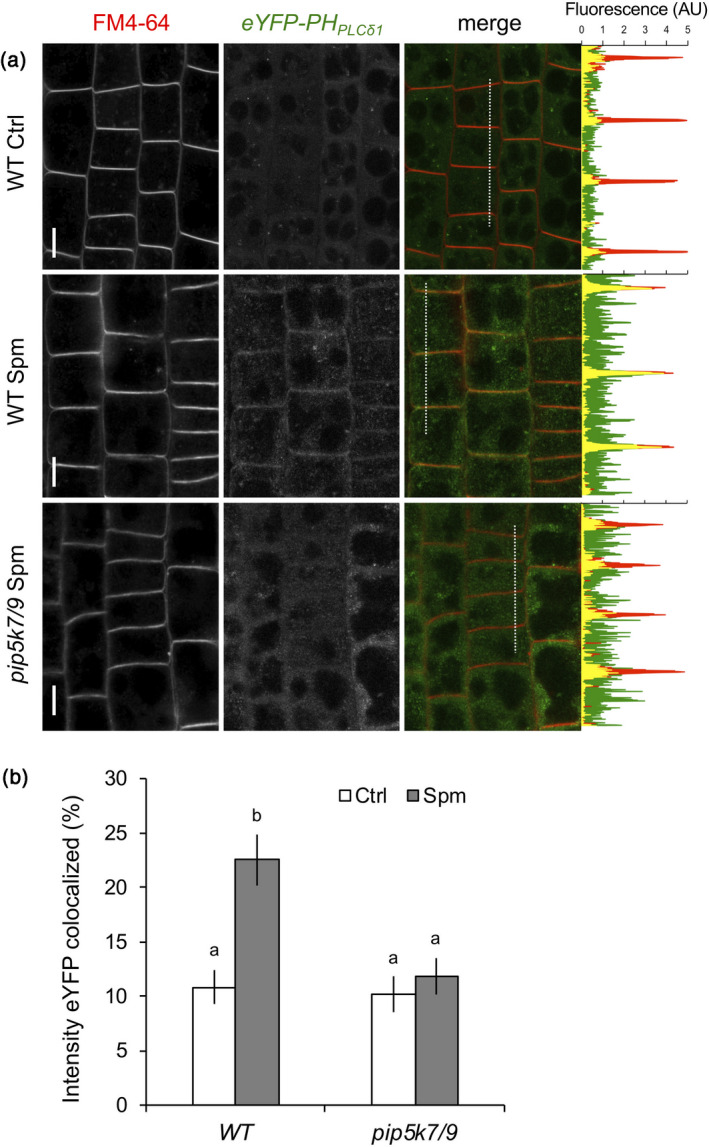
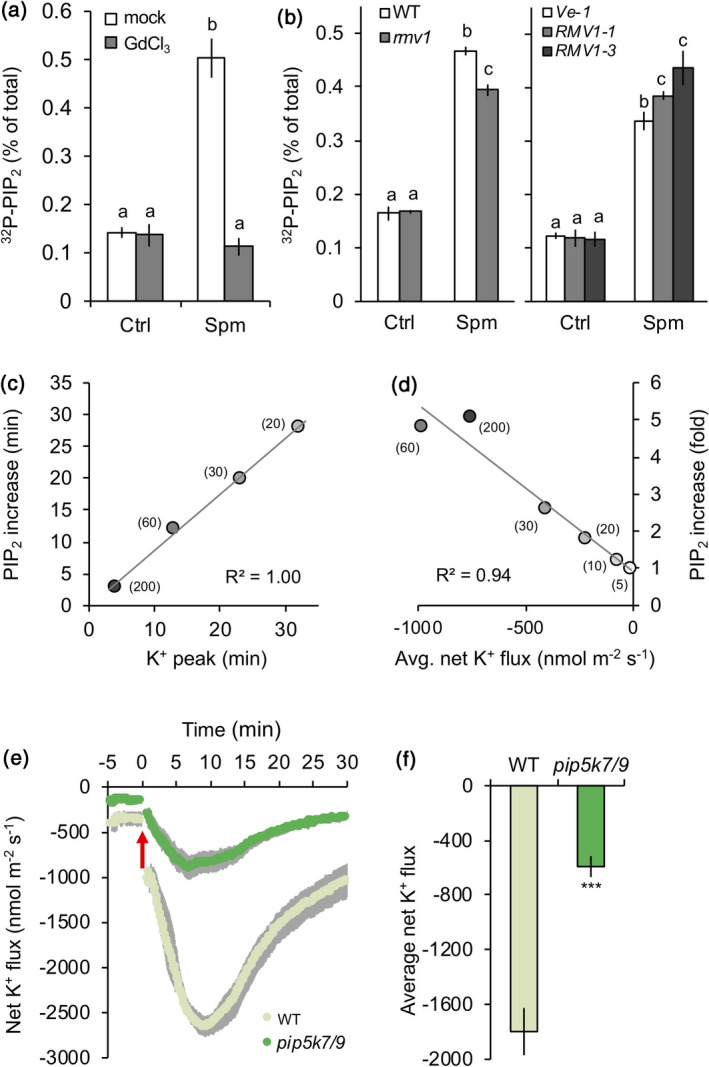
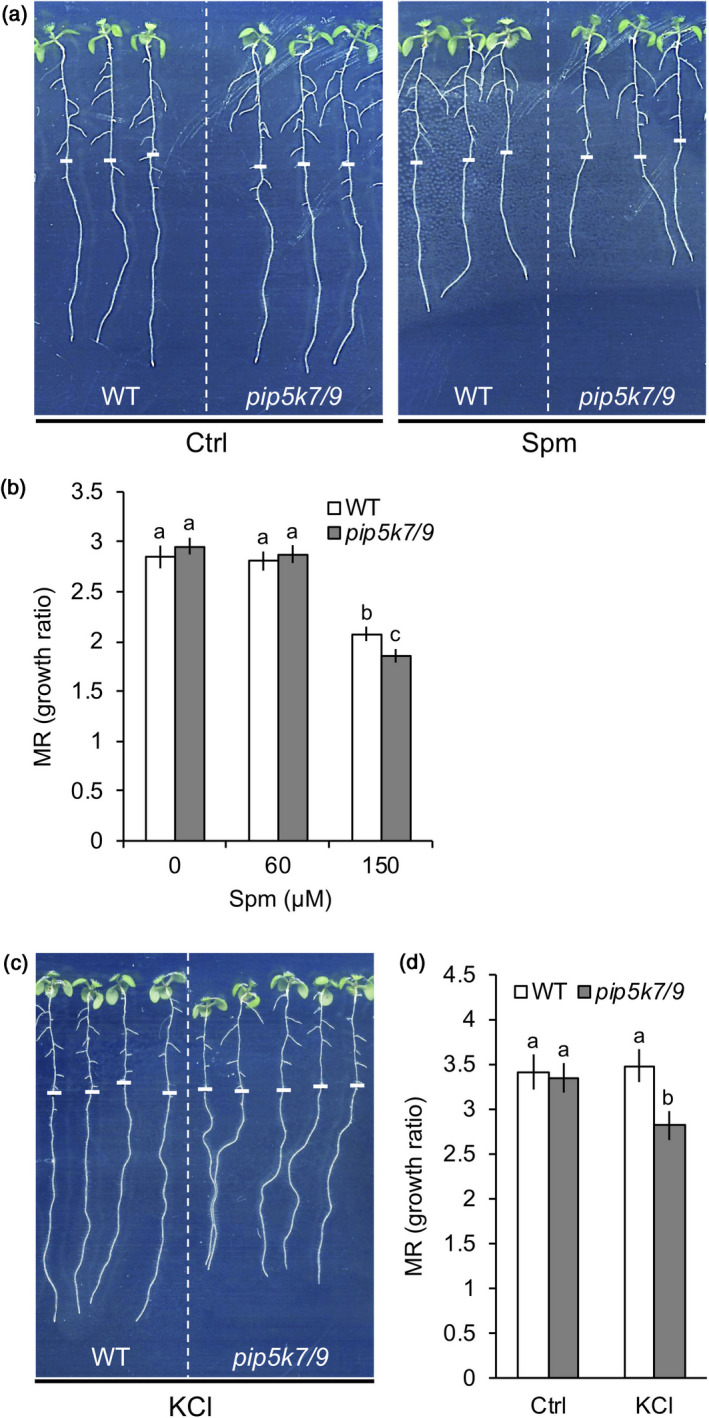
Polyamines, such as putrescine, spermidine and spermine (Spm), are low-molecular-weight polycationic molecules present in all living organisms. Despite their implication in plant cellular processes, little is known about their molecular mode of action. Here, we demonstrate that polyamines trigger a rapid increase in the regulatory membrane lipid phosphatidylinositol 4,5-bisphosphate (PIP2 ), and that this increase is required for polyamine effects on K+ efflux in Arabidopsis roots. Using in vivo 32 Pi -labelling of Arabidopsis seedlings, low physiological (μm) concentrations of Spm were found to promote a rapid PIP2 increase in roots that was time- and dose-dependent. Confocal imaging of a genetically encoded PIP2 biosensor revealed that this increase was triggered at the plasma membrane. Differential 32 Pi -labelling suggested that the increase in PIP2 was generated through activation of phosphatidylinositol 4-phosphate 5-kinase (PIP5K) activity rather than inhibition of a phospholipase C or PIP2 5-phosphatase activity. Systematic analysis of transfer DNA insertion mutants identified PIP5K7 and PIP5K9 as the main candidates involved in the Spm-induced PIP2 response. Using non-invasive microelectrode ion flux estimation, we discovered that the Spm-triggered K+ efflux response was strongly reduced in pip5k7 pip5k9 seedlings. Together, our results provide biochemical and genetic evidence for a physiological role of PIP2 in polyamine-mediated signalling controlling K+ flux in plants.

Keywords: Arabidopsis; K+ flux; phosphatidic acid (PA); phosphatidylinositol 4,5-bisphosphate (PIP2); phosphatidylinositol 4-phosphate 5-kinase (PIP5K); phosphoinositide signalling; phospholipids; polyamines.


Conflict of interest statement

The authors declare that they have no conflict of interests.

Figures

Figure 1
Figure 1
Polyamines trigger the formation of PIP2 in Arabidopsis seedlings. 32Pi‐pre‐labelled seedlings were treated for 30 min with 60 µm of putrescine (Put), spermidine (Spd) or spermine (Spm), or with buffer alone (control, Ctrl), after which their lipids were extracted, separated by thin‐layer chromatography and visualised by autoradiography. (a) Autoradiograph of typical TLC, containing three samples per treatment. Abbreviations: PA, phosphatidic acid; PC, phosphatidylcholine; PE, phosphatidylethanolamine; PG, phosphatidylglycerol; PI, phosphatidylinositol; PIP, phosphatidylinositol phosphate; PIP2, phosphatidylinositol 4,5‐bisphosphate. (b) Quantified 32P‐PIP2 response after 30 min treatment with Put, Spd, Spm, diaminopropane (Dap) or thermospermine (tSpm) at the indicated concentrations, calculated as fold increase compared with control. Data are presented as the mean ± SD (n = 6). (c) Dose–response with Spm for 30 min and (d) time‐course with 60 µm Spm or buffer alone, showing the percentage of 32P‐PIP2 with respect to the total of 32P‐labelled phospholipids. In all cases, data are presented as the mean ± SD (n = 6).
Figure 2
Figure 2
Spm‐induced PIP2 is triggered by activation of PIP5K, not through inhibition of PLC or PIP2 phosphatase. (a) Seedlings were pulse‐labelled with 32Pi for 15 min and then treated with Spm or buffer alone (Ctrl) for the times indicated. The PIP2 fold increase of two independent experiments is shown (squares and triangles). (b) Pulse‐chase experiment where seedlings were treated with buffer ± Spm for 15 or 30 min (triangles and squares, respectively), labelled with 32Pi for 5 min and then chased (t = 0) with non‐radioactive Pi in the presence or absence of Spm for the times indicated. Values in (a) and (b) were normalised to 32P‐PI and expressed with respect to Ctrl, 0 min. Open symbols, Ctrl; closed symbols, Spm. (c) 32P‐PIP2 response to Spm of WT and pip5k7, pip5k9 and pip5k7 pip5k9 (pip5k7/9) double mutants. Seedlings were 32Pi‐labelled overnight and treated for 30 min with 60 μm Spm. (d) 32P‐PA response in WT and pip5k7/9 mutant plans. Data show that the PA response is independent of PIP2. In all cases, data are presented as the mean ± SD (n = 3).
Figure 3
Figure 3
Expression of PIP5K7 and PIP5K9 in Arabidopsis seedlings. Histological GUS analyses of 5‐day‐old transgenic lines expressing (a–d) ProPIP5K7::GUS or (e–h) ProPIP5K9::GUS. Pictures show (a, e) cotyledons, (b, f) a general overview of the root and cross‐sections of (c, g) the root differentiation zone and (d, h) the division zone (root meristem). In (c, d, g, h), black arrowheads mark the protophloem cells. Results were confirmed in three independent transgenic lines. Bars represent 25 µm. (i, j) Effects of Spm on the expression of PIP5K7 and PIP5K9 genes using (i) a GUS reporter system and (j) RT‐PCR. (k) 32P‐PIP2 response in different sections of Arabidopsis seedlings. Type of section/length: (I) root tip, 2 mm, (II) root tip, 3 mm, (III) root tip, 5 mm, (IV) root tip, 5–7 mm, (V) hypocotyl and (VI) cotyledons. Results are expressed as the fold increase of PIP2 with respect to control treatment of each section. In all cases, data are presented as the mean ± SD (n = 3).
Figure 4
Figure 4
Spm‐induced PIP2 is generated at the plasma membrane. (a) Confocal images of WT and pip5k7/9 seedlings expressing the PIP2 biosensor ProUBQ10::eYFP‐PHPLCδ1 treated with buffer ± Spm at 30 min. Images show cortex cells in the root transition zone (left) and a representative plot‐profile analysis (right) indicating differences in membrane association (FM4‐64, red) of eYFP‐PHPLCδ1 (green). Units are expressed as arbitrary units (AUs). Bars represent 10 µm. (b) To quantify the colocalisation of eYFP signal with FM4‐64, the entire cell (including plasma membrane) was selected as the region of interest and the percentage of fluorescence intensity colocalisation was determined. Data are presented as the mean ± SD (n = 20).
Figure 5
Figure 5
Spm‐induced K+ efflux relies on the formation of PIP2 and Spm transport across the plasma membrane. (a) The Spm‐induced PIP2 response is gadolinium (GdCl3)‐sensitive. Pre‐treatment with gadolinium, a well‐known polyamine uptake inhibitor, completely blocks the Spm‐induced PIP2 response. 32P‐pre‐labelled WT seedlings were pre‐treated for 60 min with 100 µm GdCl3, washed and then treated with or without 60 µm Spm for 30 min. (b) The polyamine uptake transporter RMV1 is required for a full PIP2 response. WT, rmv1 and two RMV1‐OE lines were 32P‐labelled and tested for their PIP2 response in the absence or presence of 60 µm Spm for 30 min. For both cases, data are presented as the mean ± SD (n = 4). (c) Correlation between K+ efflux peak time and the PIP2 response at different Spm concentrations. (d) Correlation between net K+ efflux and the PIP2 response using different Spm concentrations (t = 30 min). (e) MIFE K+ flux kinetics in WT and pip5k7/9 seedlings when 60 µm Spm was added (red arrow). (f) MIFE average K+ flux in WT and pip5k7/9 mutant plants upon 60 µm Spm treatment. For all MIFE data, data are shown as the mean ± SE (n = 6–7); negative values represent net efflux of ions across the plasma membrane into the apoplast.
Figure 6
Figure 6
Effects of Spm and KCl on seedling root growth in WT and pip5k7/9 mutant plants. Five‐day‐old seedlings were transferred to plates supplemented with (a, b) Spm or (c, d) KCl and grown for 4 more days. (a) Phenotype of WT and mutant seedlings grown with and without 150 µm Spm. (b) Effects of Spm on main root (MR) growth of WT and pip5k7/9 seedlings. (c, d) Phenotype of WT and mutant seedlings grown with and without of 50 mm KCl. Results are expressed as the MR growth ratio. Data are presented as the mean ± SD (n = 40). White dashes indicate the position of the root tip when seedlings were transferred.

References

    1. Angelini, R. , Cona, A. , Federico, R. , Fincato, P. , Tavladoraki, P. and Tisi, A. (2010) Plant amine oxidases “on the move”: An update. Plant Physiol. Biochem. 48, 560–564. - PubMed
    1. Anschütz, U. , Becker, D. and Shabala, S. (2014) Going beyond nutrition: Regulation of potassium homeostasis as a common denominator of plant adaptive responses to environment. J. Plant Physiol. 171, 670–687. - PubMed
    1. Arisz, S.A. and Munnik, T. (2013) Distinguishing phosphatidic acid pools from de novo synthesis, PLD, and DGK. Methods Mol. Biol. 1009, 55–62. - PubMed
    1. Armengaud, P. , Zambaux, K. , Hills, A. , Sulpice, R. , Pattison, R.J. , Blatt, M.R. and Amtmann, A. (2009) EZ‐Rhizo: integrated software for the fast and accurate measurement of root system architecture. Plant J. 57, 945–956. - PubMed
    1. Athwal, G.S. and Huber, S.C. (2002) Divalent cations and polyamines bind to loop 8 of 14‐3‐3 proteins, modulating their interaction with phosphorylated nitrate reductase. Plant J. 29, 119–129. - PubMed

Publication types

MeSH terms