

Characterization of circulating breast cancer cells with tumorigenic and metastatic capacity
- PMID: 32667137
- PMCID: PMC7507517
- DOI: 10.15252/emmm.201911908
Characterization of circulating breast cancer cells with tumorigenic and metastatic capacity
Abstract
Functional studies giving insight into the biology of circulating tumor cells (CTCs) remain scarce due to the low frequency of CTCs and lack of appropriate models. Here, we describe the characterization of a novel CTC-derived breast cancer cell line, designated CTC-ITB-01, established from a patient with metastatic estrogen receptor-positive (ER+ ) breast cancer, resistant to endocrine therapy. CTC-ITB-01 remained ER+ in culture, and copy number alteration (CNA) profiling showed high concordance between CTC-ITB-01 and CTCs originally present in the patient with cancer at the time point of blood draw. RNA-sequencing data indicate that CTC-ITB-01 has a predominantly epithelial expression signature. Primary tumor and metastasis formation in an intraductal PDX mouse model mirrored the clinical progression of ER+ breast cancer. Downstream ER signaling was constitutively active in CTC-ITB-01 independent of ligand availability, and the CDK4/6 inhibitor Palbociclib strongly inhibited CTC-ITB-01 growth. Thus, we established a functional model that opens a new avenue to study CTC biology.
Keywords: breast cancer; circulating tumor cells; functional studies; liquid biopsy; metastasis.
© 2020 The Authors. Published under the terms of the CC BY 4.0 license.
Conflict of interest statement
KP and CAP have ongoing patent applications related to CTCs. KP has received honoraria from Agena, Novartis, Roche, and Sanofi and research funding from European Federation of Pharmaceutical Industries and Associations (EFPIA) partners (Angle, Menarini and Servier) of the CANCER‐ID program of the European Union–EFPIA Innovative Medicines Initiative. CAP has received honoraria from Janssen and grant support from Menarini. The remaining authors declare no conflict of interest.
Figures
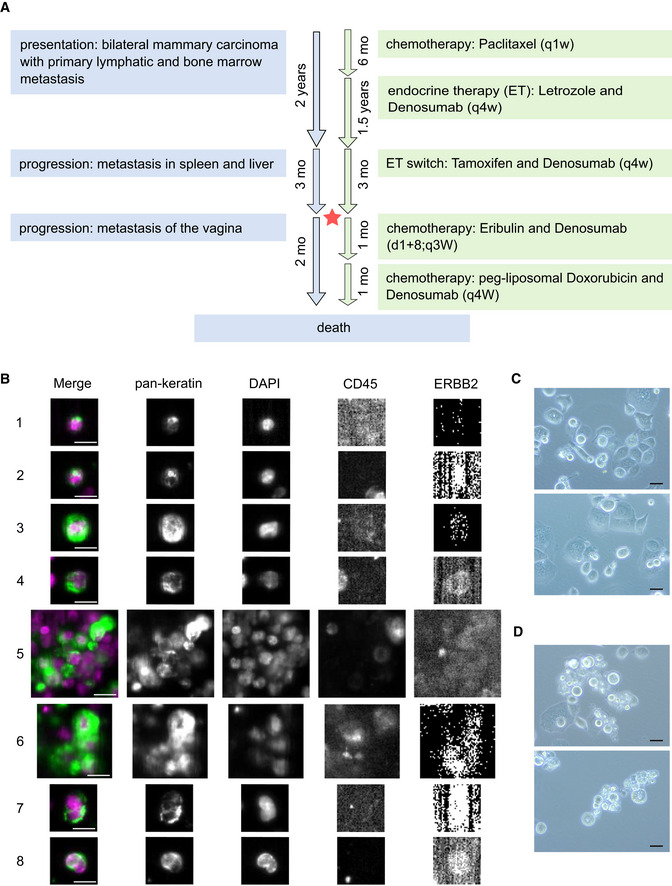
- A
Scheme of the breast cancer patient's clinical status and therapies. Course of disease progression (blue) and treatment scheme (green) of the patient giving rise to CTC‐ITB‐01 are indicated. Timeline of progression and treatment indicated in years and months (mo). Drugs were administered at standard dosage according to indicated pattern. The red star represents the time point of blood sample collection. More detailed information is available the in Appendix Supplementary Methods.
- B
Representative pictures of different CTCs from the initial CellSearch® analysis of the metastatic breast cancer patient who gave rise to the breast CTC line. The detected tumor cells display clear keratin and DAPI staining, CD45 negativity as well as lack of, or very weak (4, 8), ERBB2 expression. Cells of small (about 5 μm in diameter, 1, 2) and large size (larger than 10 μm in diameter, 3) were detected. While some CTCs displayed dot‐like perinuclear keratin signals (1, 2), the majority showed diffuse keratin staining. Additionally, CTC clusters of more than 4 cells were present (5, 6). Some CTCs showed multiple/lobed nuclei (7, 8).
- C
Bright field images of CTC‐ITB‐01 cells growing adherently.
- D
Bright field images of CTC‐ITB‐01 cells growing non‐adherently (relation between adherent and non‐adherent cells: 80/20%).
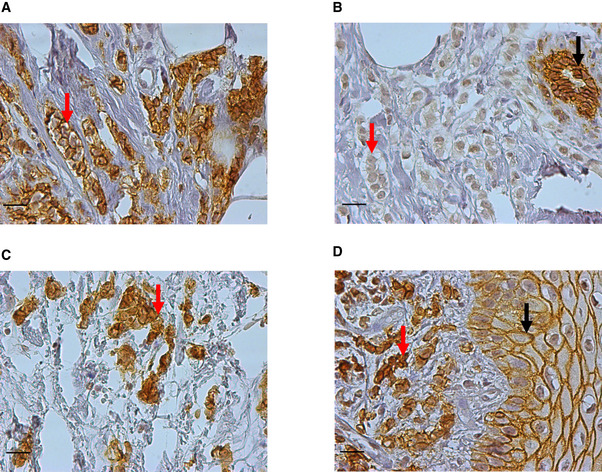
- A
Area of the primary left tumor (primarily diagnosed as lobular carcinoma) with strongly E‐cadherin‐positive tumor cells (red arrow).
- B
Area of the primary lobular left tumor with negative or very weakly E‐cadherin‐positive tumor cells (red arrow). The black arrow shows strong E‐cadherin staining in normal mammary ductal epithelium.
- C
Strongly E‐cadherin‐positive tumor cells (red arrow) of the primary ductal (right) tumor.
- D
Strongly E‐cadherin‐positive tumor cells (red arrow) of the vaginal metastasis. E‐cadherin staining in normal vulvar squamous epithelium is shown by a black arrow.
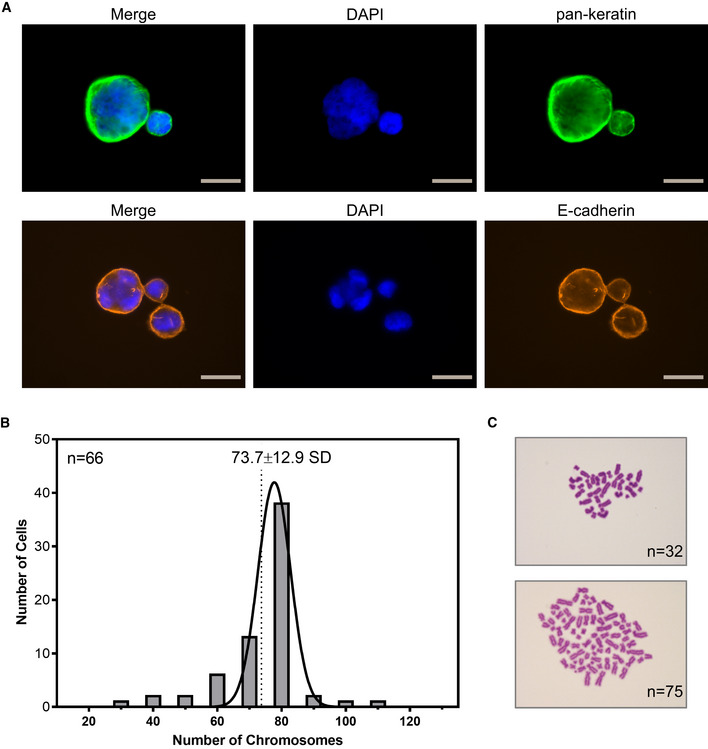
- A
Representative ICC images of large CTC‐ITB‐01 cells containing multiple or lobed nuclei. Cells were stained with pan‐keratin (green) or E‐cadherin (orange). Nuclear visualization was performed with DAPI (blue). Gray scale bars represent 20 μm.
- B
Histogram showing the chromosome distribution across 66 measured CTC‐ITB‐01 cells. A mean chromosome count of 73.7 (SD = 12.9) was calculated, representing triploidy.
- C
Representative bright field images of Giemsa staining used for karyotyping (purple). Examples of 32 (upper image) or 75 chromosomes (lower image).
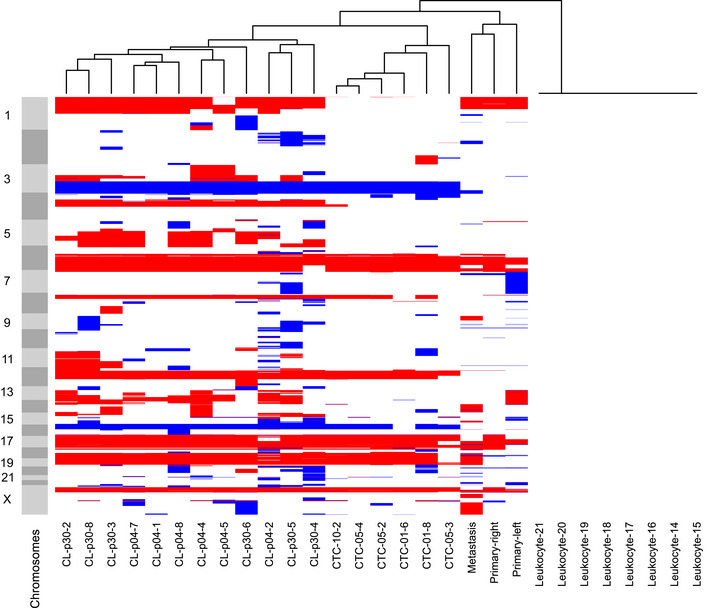
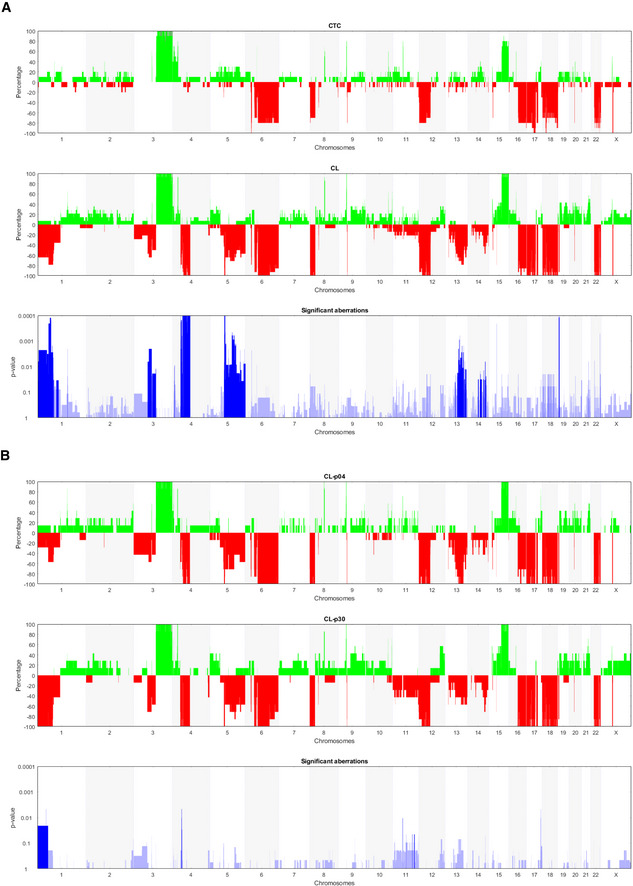
- A
CNAs generated from CTCs from the primary blood collection (upper panel) and CTC‐ITB‐01, indicated as “CL” (medium panel). Significant distinctions between both samples were calculated using Fisher's exact test (Joosse et al, 2018) and are indicated in lowest panel (blue). Increased blue color intensity represents lower P‐value and therefore higher statistical significance.
- B
CNA comparison between early (p04) and late (p30) CTC‐ITB‐01 passages (upper and medium panel). Significant distinctions between both samples were calculated using Fisher's exact test (Joosse et al, 2018) and are indicated in lowest panel (in blue). Increased blue color intensity represents lower P‐value and therefore higher statistical significance.
- A
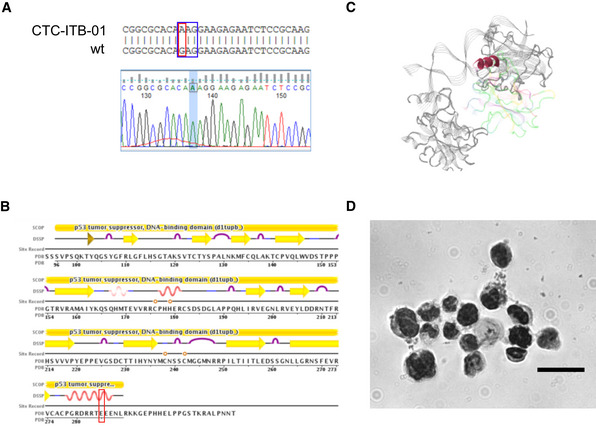
Red square indicating point mutation from guanine (G) to adenine (A) localized on exon 8 of the TP53 gene sequence. Wild‐type (wt) sequence and gene sequence (Finch TV) shown for visualization. Blue square indicates the affected amino acid sequence.
- B
Localization of the E285K mutation in the secondary protein structure of TP53 and integration into the functional domains of the protein (
https://www.rcsb.org/pdb/explore/remediatedSequence.do?structureId=1TUP&bionumber=1 ). Red square marks altered region with amino acid exchange from E (glutamic acid) to K (lysine). - C
Localization of the detected mutation within the quaternary structure of TP53. The E to K exchange affects a helical structure within the DNA binding domain of the protein.
- D
Strong accumulation of TP53 in the nucleus of CTC‐ITB‐01 cells, assessed via ICC staining. Scale bar corresponds to 20 μm.
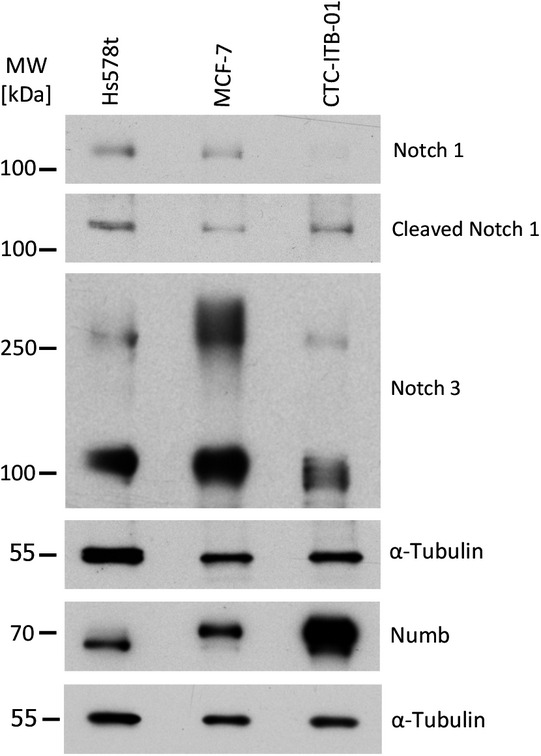
- A
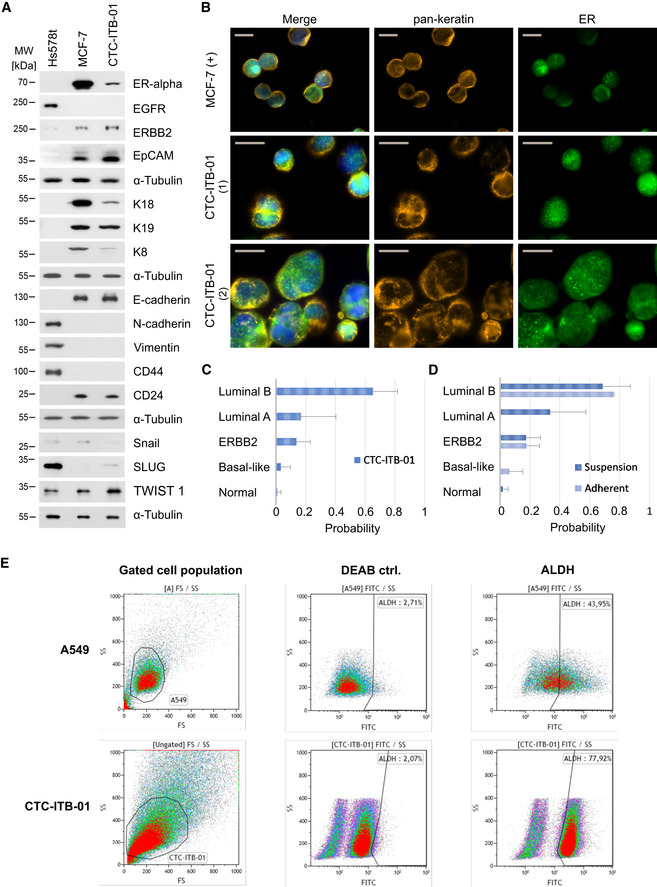
Western blot analysis of selected protein markers, including ERα, EGFR, ERBB2, EpCAM, K18, K19, K8, E‐cadherin, N‐cadherin, vimentin, CD44, CD24, SNAIL, SLUG, TWIST1, and α‐tubulin (as a loading control) (n = 3 replicates). CTC‐ITB‐01 was compared to more mesenchymal ER− Hs578t and epithelial ER+ MCF‐7 breast cancer cell lines.
- B
ICC staining of CTC‐ITB‐01 for pan‐keratin (orange), ER (green), and DAPI (blue). The scale bar corresponds to 20 μm. Two representative panels are shown for CTC‐ITB‐01 (1) and (2). MCF‐7 cells are depicted as reference cell line.
- C
PAM50 classifier results showing probabilities of pooled CTC‐ITB‐01 cells matching specific molecular breast cancer subtypes. Starting from lowest probability, CTC‐ITB‐01 was classified as 1.02% (s = 2.5%) normal‐like, 3.11% (s = 6.6%) Basal‐like, 13.11% (s = 9.3%) ERBB2‐positive, 16.77% (s = 23.7%) luminal A, and 65.22% (s = 16.6%) luminal B breast cancer subtype. Data were generated from n = 3 replicates.
- D
PAM50 classifier results showing probabilities of the non‐adherent and adherent CTC‐ITB‐01 fractions matching molecular subtypes. Selected bars are not visible due to extremely low probability (close to zero). Both fractions show greatest alignment with a luminal B subtype. Starting from lowest probability, the adherent fraction of CTC‐ITB‐01 was classified as 0% (± 0%) normal‐like, 6.22% (± 9.0%) Basal‐like, 17.85% (± 8.6%) ERBB2‐positive, 0% (s = 0%) luminal A, and 75.92% (s = 0.7%) luminal B breast cancer subtype. The suspension cell fraction of CTC‐ITB‐01 was classified as 2.04% (s = 3.5%) normal‐like, 0% (s = 0%) Basal‐like, 17.32% (s = 9.7%) ERBB2‐positive, 33.5% (s = 23.8%) luminal A, and 68.67% (s = 18.6%) luminal B breast cancer subtype, respectively. Data were generated from n = 3 replicates.
- E
ALDH activity measurement on viable cells via flow cytometry using the ALDEFLUOR™ assay. CTC‐ITB‐01 is compared to A549 as recommended control cell line. An internal (DEAB) control is also depicted. 77.92% of the gated CTC‐ITB‐01 population are ALDH+.
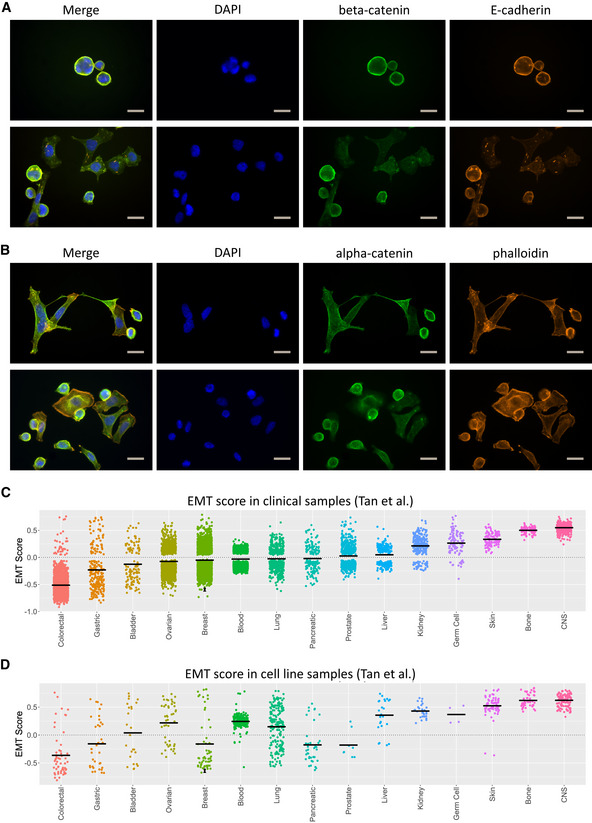
- A
ICC staining of CTC‐ITB‐01 for ß‐catenin (green), E‐cadherin (orange), and DAPI (blue). The scale bar corresponds to 20 μm. Two representative panels are shown for CTC‐ITB‐01.
- B
ICC staining of CTC‐ITB‐01 for α‐catenin (green), visualization of actin filaments by phalloidin (orange), and nuclei by DAPI (blue). The scale bar corresponds to 20 μm. Two representative panels are shown for CTC‐ITB‐01.
- C
Generic EMT score of the adherent and non‐adherently growing CTC‐ITB‐01 fractions in relation to tumor samples from different cancer entities. Scaling ranges from 1 (completely mesenchymal) to −1 (entirely epithelial). The adherent fraction is shown with a black dot, the non‐adherent fraction with a black triangle, and the mean score per cancer entity by a black line.
- D
Generic EMT score of the adherent and non‐adherently growing CTC‐ITB‐01 fractions in relation to established cancer cell lines. Scaling ranges from 1 (completely mesenchymal) to −1 (entirely epithelial). The adherent fraction is shown with a black dot, the non‐adherent fraction with a black triangle, and the mean score per cancer entity by a black line.
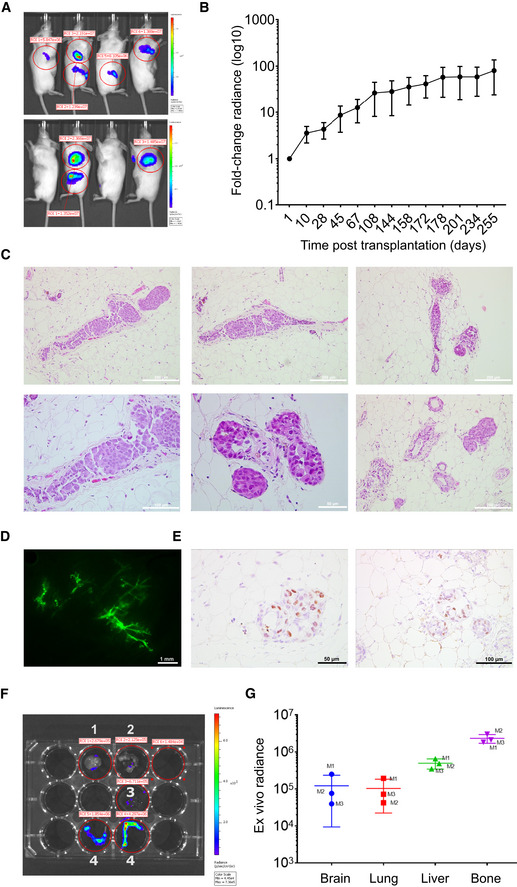
- A
In vivo bioluminescence imaging of CTC‐ITB‐01 in four NSG mice. Blue indicates low radiance, red indicates high radiance.
- B
Logarithmic plotting of in vivo radiance increase over time. Curves represent means ± SEM of measurements performed on multiple glands (n = 8).
- C
H&E staining of xenografted mouse mammary glands show formation of primary tumors.
- D
Stereoscope image of a mammary gland of immunodeficient NSG mouse. Fluorescently tagged CTC‐ITB‐01 cells in green.
- E
IHC staining for ER, confirms retained in vivo ER positivity of formed tumors. Representative images of ER staining in higher (left panel) and lower (right panel) magnification of 2 different areas of a xenografted mammary gland.
- F
Representative ex vivo luminescence images of indicated organs from engrafted mice. Organs include brain (1), lung (2), liver (3), and bones (4).
- G
Scatter plot showing ex vivo radiance intensity of metastatic organs in three different mice (M1, M2, M3), indicating highest intensity in liver and bone. Data represent means ± SD of measurements performed on metastatic organs derived from three different mice.
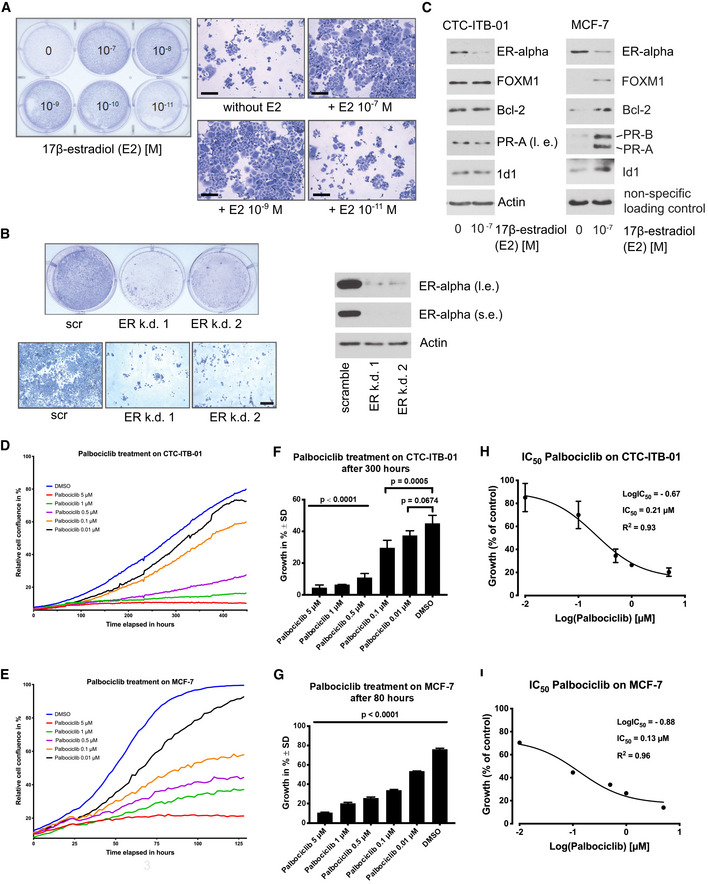
- A
Equal numbers of CTC‐ITB‐01 cells were seeded on 6‐well culture plates and grown in the presence or absence of different 17‐β‐estradiol concentrations as indicated. After 10 days, cells were fixed and stained with Coomassie blue staining (right panel). Macroscopic photographs are shown of the fixed cell colonies from cells grown in the absence or presence of the indicated E2 concentrations (right panel). Scale bar 200 μm.
- B
Stable knockdown of ER‐alpha within CTC‐ITB‐01 cells was performed by using lentiviral transfer of non‐targeted (scramble) or two different targeted shRNAs against ER‐alpha. CTC‐ITB‐01 cells were seeded on 6‐well plates. After 10 days, cells were fixed and stained (left upper panel). Macroscopic photos are shown of the fixed cells (left lower panel), scale bar 200 μm. Western blots of lysates from knockdown of ER‐alpha expression in CTC‐ITB‐01 cells transduced with the same amounts of lentiviral vectors were probed with the indicated antibodies. The extracts were obtained 72 h after lentiviral transduction (right panel). Where indicated, Western blots were visualized at long exposure (l.e.) and/or short exposure (s.e.).
- C
CTC‐ITB‐01 and MCF‐7 cells were grown under the same culture conditions in the presence or absence of E2 as indicated. 24 h after E2 deprivation or E2‐treatment cells were harvested. Western blots of the protein lysates were probed with antibodies targeting ER‐alpha, FOXM1, Bcl‐2, PR‐A, PR‐B and ID1, actin was used as loading control, visualized at long exposure (l.e.) and/or short exposure (s.e.).
- D, E
(D) Growth curves of CTC‐ITB‐01 and (E) MCF‐7 cells under varying concentrations of Palbociclib treatment were measured using an IncuCyte Zoom live cell imaging system. The mean values from three technical triplicates (one experiment) with standard deviation are shown.
- F, G
(F) Influence of Palbociclib on CTC‐ITB‐01 growth after 300 h and (G) MCF‐7 after 80 h. Data were chosen from one representative time point during the exponential growth phase. Statistical significance was analyzed with a one‐way ANOVA with Dunnett's multiple comparisons test and compared to the vehicle substance dimethyl sulfoxide (DMSO). The mean values from technical triplicates (one experiment) with standard deviation are shown.
- H, I
(H) Effect of Palbociclib on the growth of CTC‐ITB‐01 cells and (I) MCF‐7 cells. Concentrations were transformed to common logarithm. Three‐parameter non‐linear logistic regression was used to determine the IC50. The mean values from three technical triplicates (one experiment) with standard deviation are shown. Error bars for standard deviation smaller than the symbols are not displayed.
References
-
- Alix‐Panabieres C, Pantel K (2014a) Challenges in circulating tumour cell research. Nat Rev Cancer 14: 623–631 - PubMed
-
- Alix‐Panabieres C, Pantel K (2014b) Technologies for detection of circulating tumor cells: facts and vision. Lab Chip 14: 57–62 - PubMed
-
- Alix‐Panabieres C, Pantel K (2016) Clinical applications of circulating tumor cells and circulating tumor DNA as liquid biopsy. Cancer Discov 6: 479–491 - PubMed
Publication types
MeSH terms
Substances
Grants and funding
- 115749-CANCER-ID/Innovative Medicines Initiative (IMI)/International
- 70112504/Deutsche Krebshilfe (German Cancer Aid)/International
- 834974/European Research Council Advanced Investigator Grant/International
- KFS-3701-08-2015/Swiss Cancer League/International
- ISREC Fondation Recherche Cancer/International
LinkOut - more resources
Full Text Sources
Other Literature Sources
Medical
