

Progression of confirmed COVID-19 cases after the implementation of control measures
- PMID: 32667447
- PMCID: PMC7405732
- DOI: 10.5935/0103-507x.20200028
Progression of confirmed COVID-19 cases after the implementation of control measures
Abstract
Objective: To analyse the measures adopted by countries that have shown control over the transmission of coronavirus disease 2019 (COVID-19) and how each curve of accumulated cases behaved after the implementation of those measures.
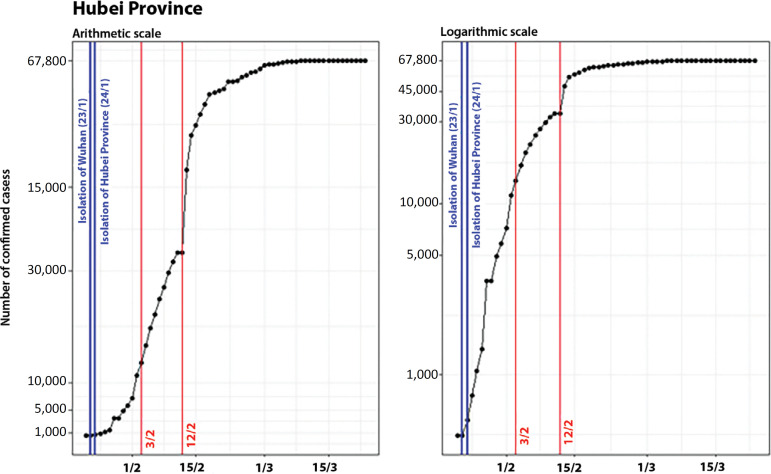
Methods: The methodology adopted for this study comprises three phases: systemizing control measures adopted by different countries, identifying structural breaks in the growth of the number of cases for those countries, and analyzing Brazilian data in particular.
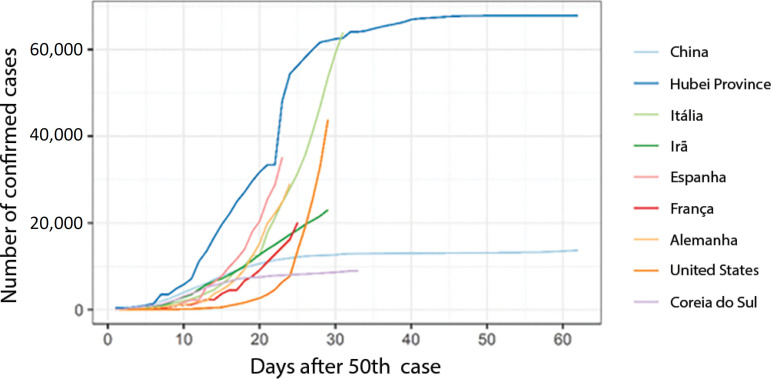
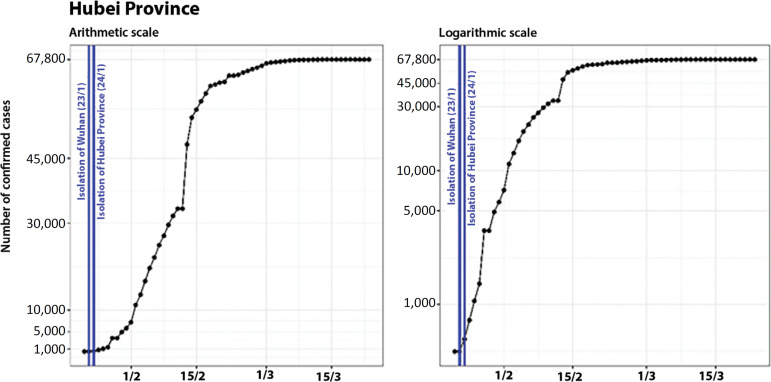
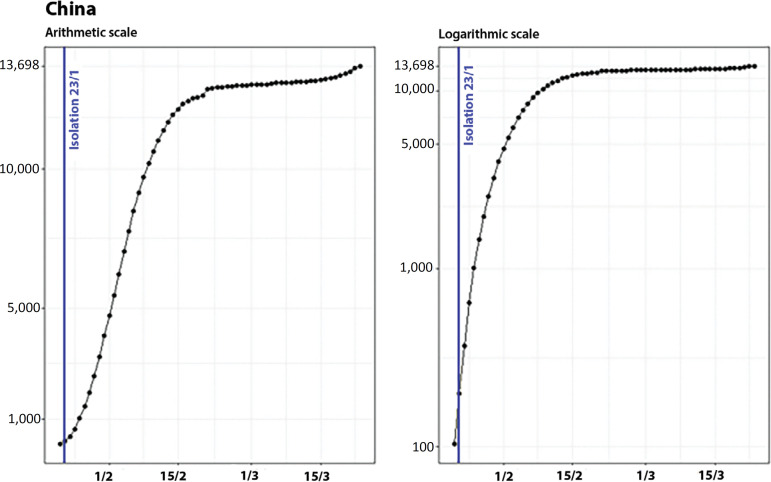
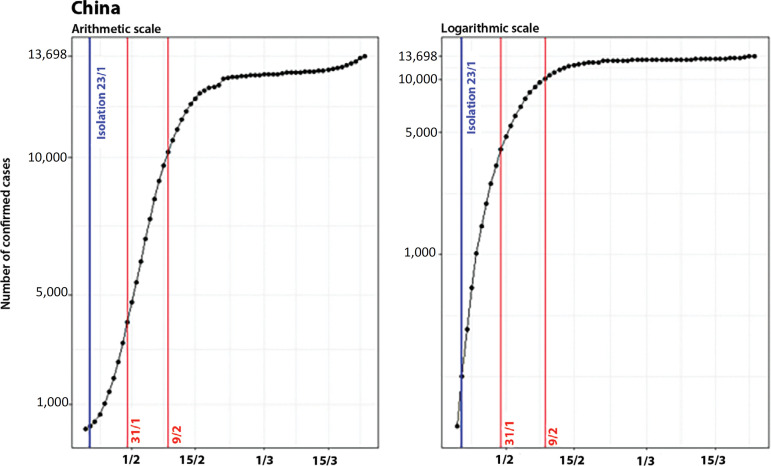
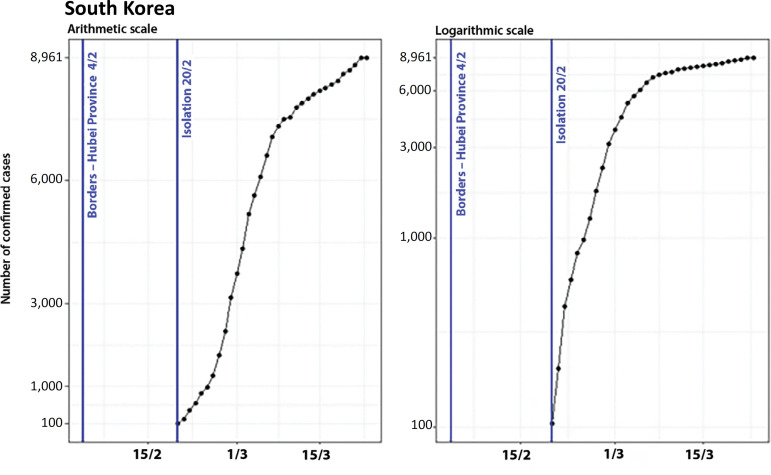
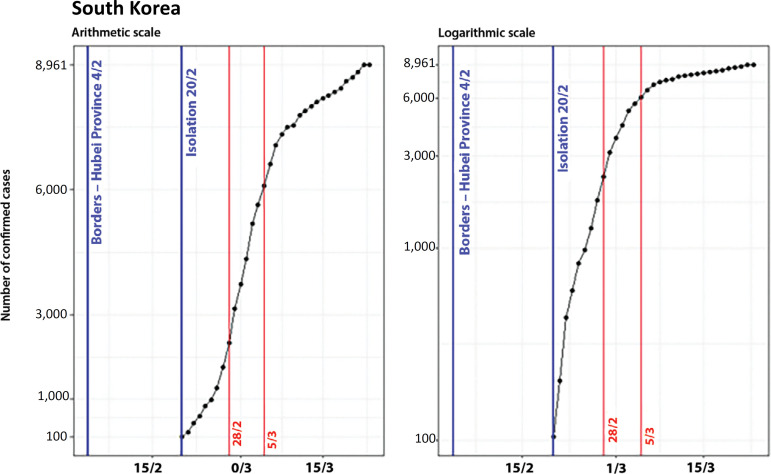
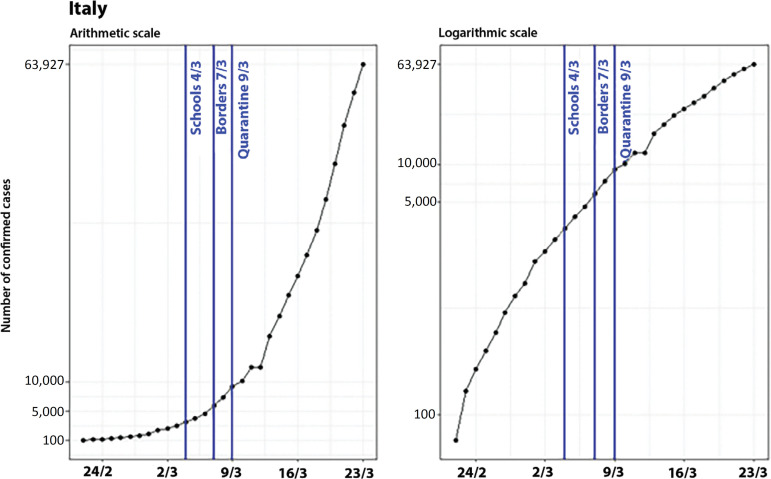
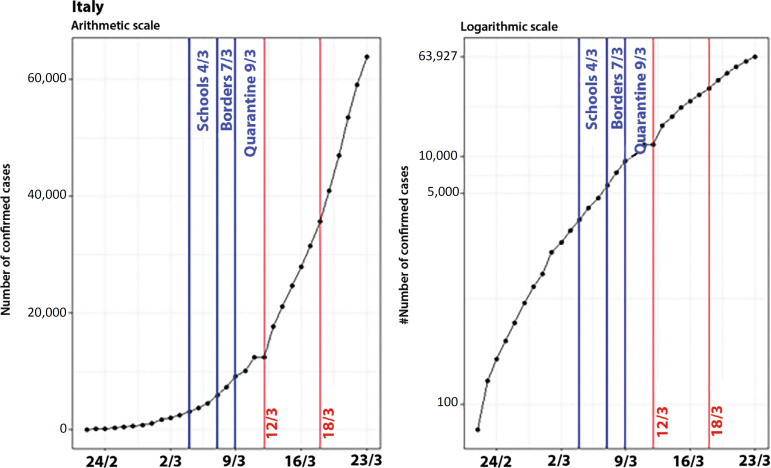
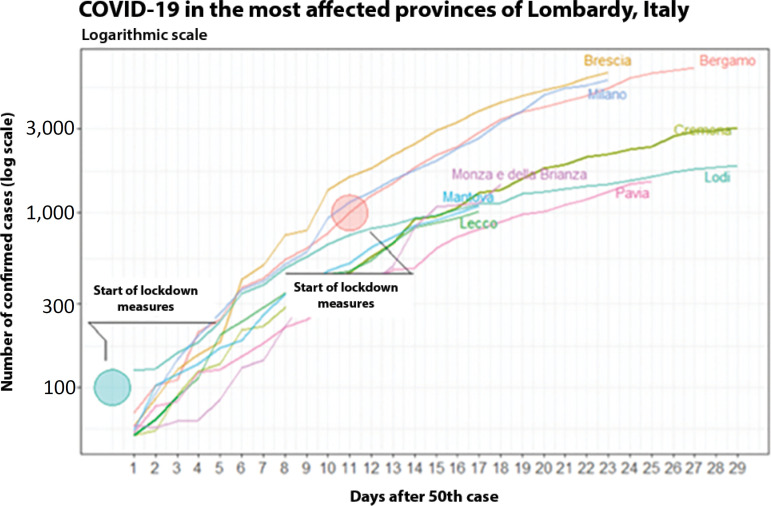
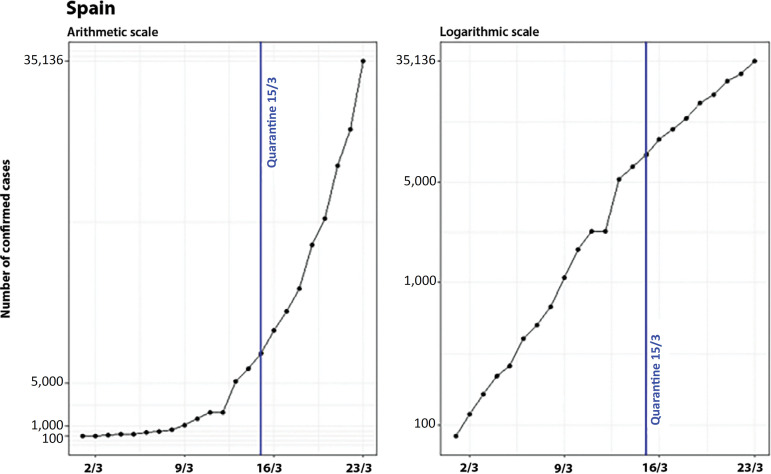
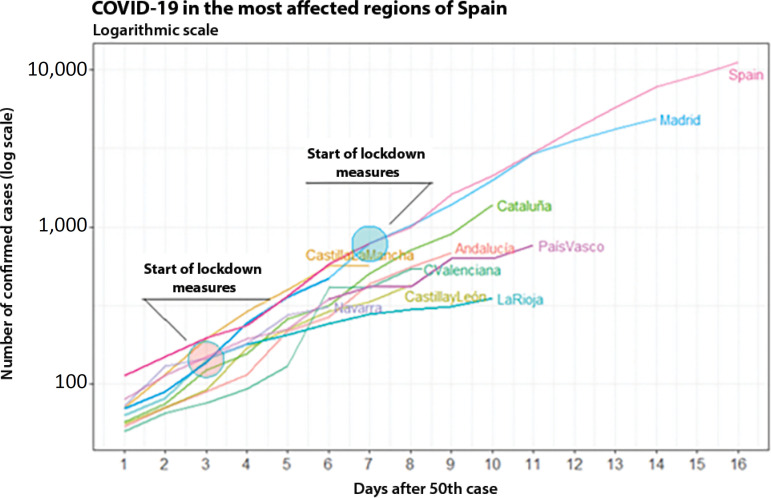
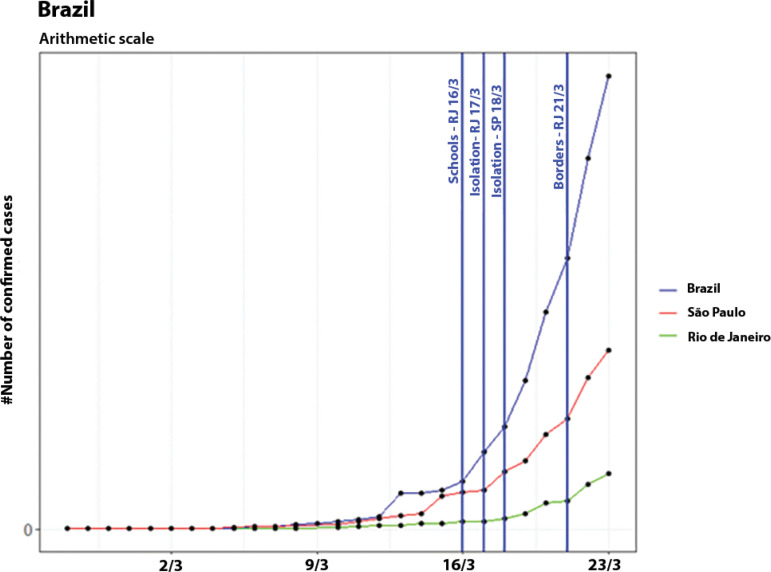
Results: We noted that China (excluding Hubei Province), Hubei Province, and South Korea have been effective in their deceleration of the growth rates of COVID-19 cases. The effectiveness of the measures taken by these countries could be seen after 1 to 2 weeks of their application. In Italy and Spain, control measures at the national level were taken at a late stage of the epidemic, which could have contributed to the high propagation of COVID-19. In Brazil, Rio de Janeiro and São Paulo adopted measures that could be effective in slowing the propagation of the virus. However, we only expect to see their effects on the growth of the curve in the coming days.
Conclusion: Our results may help decisionmakers in countries in relatively early stages of the epidemic, especially Brazil, understand the importance of control measures in decelerating the growth curve of confirmed cases.
Objetivo: Analisar as medidas adotadas por países que demonstraram controle sobre a transmissão da doença pelo novo coronavírus 2019 (COVID-19) e também como cada curva de casos acumulados se comportou após a implantação dessas medidas.
Métodos: A metodologia adotada para este estudo compreendeu três fases: sistematização das medidas de controle adotadas por diferentes países, identificação dos pontos de inflexão na curva do crescimento do número de casos nesses países e análise específica dos dados brasileiros.
Resultados: Observamos que China (excluindo-se Hubei), Hubei e Coreia do Sul foram eficazes na desaceleração das taxas de crescimento dos casos de COVID-19. A eficácia das medidas tomadas por esses países pode ser observada após 1 ou 2 semanas de sua aplicação. Na Itália e Espanha, foram tomadas medidas de controle em nível nacional em uma fase tardia da epidemia, o que pode ter contribuído para a elevada propagação da COVID-19. No Brasil, Rio de Janeiro e São Paulo adotaram medidas que podem ter sido eficazes na redução da rapidez da propagação do vírus, entretanto, só temos expectativa de ver seus efeitos no crescimento da curva nos próximos dias.
Conclusão: Nossos resultados podem ajudar os responsáveis pela tomada de decisões em países em estágios relativamente precoces da epidemia, especialmente no Brasil, a compreenderem a importância das medidas de controle para desaceleração da curva de crescimento de casos confirmados.
Conflict of interest statement
Figures
References
-
- Gumbrecht J, Howard J. WHO declares novel coronavirus outbreak a pandemic. CNN: Mar 11, 2020. https://edition.cnn.com/2020/03/11/health/coronavirus-pandemic-world-hea...
-
- Novel Coronavirus COVID-19 (2019-nCoV) Data Repository by John Hopkins CSSE. 2019. https://github.com/CSSEGISandData/COVID-19
-
- Zeileis A. Testing, monitoring, and dating structural changes. Repository CRAN. https://cran.r-project.org/web/packages/strucchange/strucchange.pdf Publication data 2019-10-12 18:35:49 UTC.
-
- Pueyo T. Coronavirus: Why you must act now. Politicians, community leaders and business leaders: what should you do and when? Mar 10, 2020. https://medium.com/@tomaspueyo/coronavirus-act-today-or-people-will-die-...
Publication types
MeSH terms
LinkOut - more resources
Full Text Sources
