. 2020 Oct 9;48(18):10015-10033.
doi: 10.1093/nar/gkaa590.

PARP1 catalytic variants reveal branching and chain length-specific functions of poly(ADP-ribose) in cellular physiology and stress response

Affiliations

PARP1 catalytic variants reveal branching and chain length-specific functions of poly(ADP-ribose) in cellular physiology and stress response

Lisa Aberle et al. Nucleic Acids Res. .

Abstract

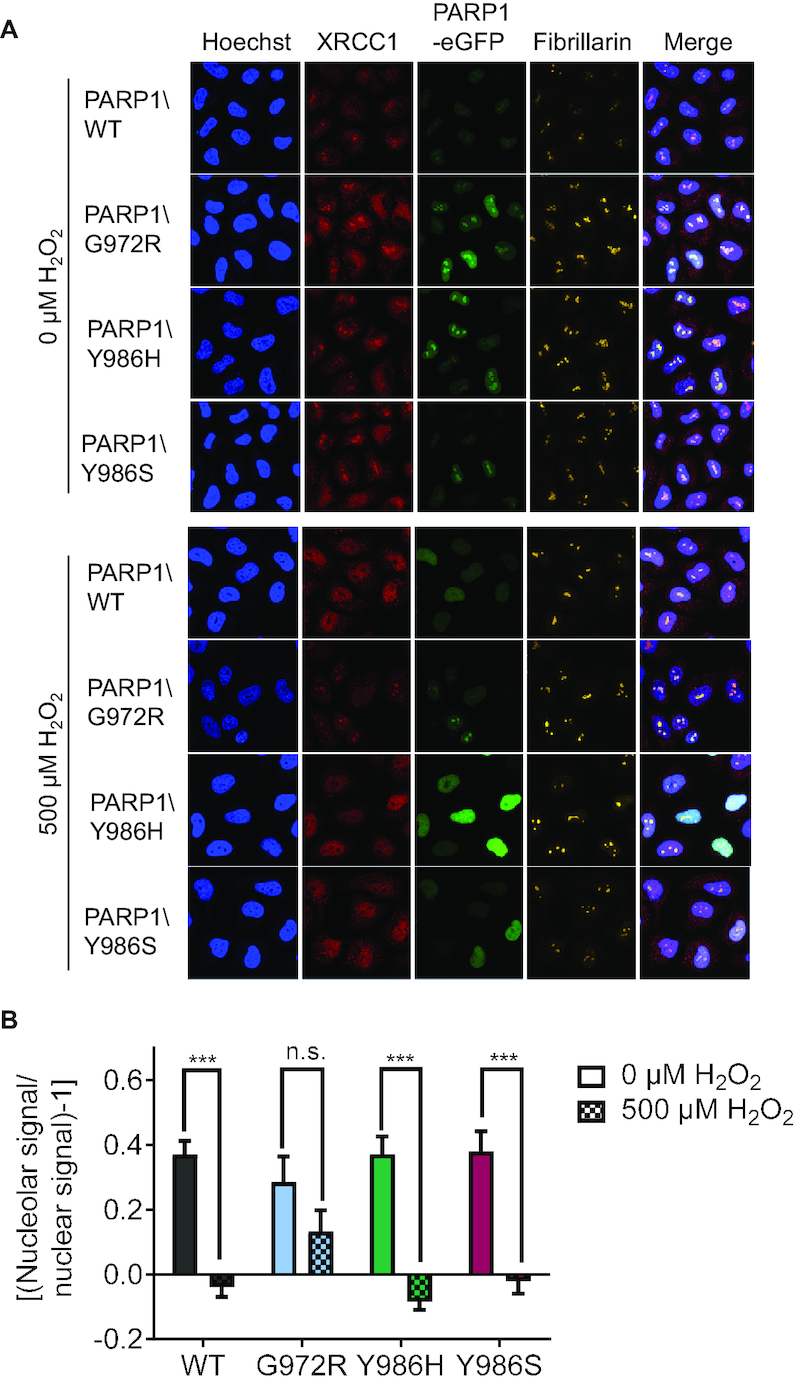
Poly(ADP-ribosyl)ation regulates numerous cellular processes like genome maintenance and cell death, thus providing protective functions but also contributing to several pathological conditions. Poly(ADP-ribose) (PAR) molecules exhibit a remarkable heterogeneity in chain lengths and branching frequencies, but the biological significance of this is basically unknown. To unravel structure-specific functions of PAR, we used PARP1 mutants producing PAR of different qualities, i.e. short and hypobranched (PARP1\G972R), short and moderately hyperbranched (PARP1\Y986S), or strongly hyperbranched PAR (PARP1\Y986H). By reconstituting HeLa PARP1 knockout cells, we demonstrate that PARP1\G972R negatively affects cellular endpoints, such as viability, cell cycle progression and genotoxic stress resistance. In contrast, PARP1\Y986S elicits only mild effects, suggesting that PAR branching compensates for short polymer length. Interestingly, PARP1\Y986H exhibits moderate beneficial effects on cell physiology. Furthermore, different PARP1 mutants have distinct effects on molecular processes, such as gene expression and protein localization dynamics of PARP1 itself, and of its downstream factor XRCC1. Finally, the biological relevance of PAR branching is emphasized by the fact that branching frequencies vary considerably during different phases of the DNA damage-induced PARylation reaction and between different mouse tissues. Taken together, this study reveals that PAR branching and chain length essentially affect cellular functions, which further supports the notion of a 'PAR code'.


Figures

Figure 1.
Figure 1.
Biochemical characterization of rec. PARP1 variants. (A) Schematic representation of the domain organization of human PARP1 and crystal structure of the catalytic domain (PDB code: 5WRQ). Amino acids substituted in the PARP1 variants that are used in this study are highlighted in red, with the G972R substitution resulting in short and hypobranched, Y986S in short and moderately hyperbranched and Y986H in strongly hyperbranched PAR chains. The E988K substitution, which results in mono-ADP-ribosyl transferase activity, is highlighted in green. (B) Time-dependent automodification reaction of rec. PARP1 variants in the absence or presence of DNA. PARylation was started by the addition of 100 μM TAMRA-labelled NAD+ (NAD+:TAMRA-NAD+ = 10:1) and analyzed by SDS-PAGE. Full blots are shown in Supplementary Figure S2. (C) Amount of PAR purified from rec. PARP1 variants as determined by UV absorption at 258 nm. (D) Mass-spectrometric quantification of the [A.U.C. of R2-Ado]/[A.U.C. of R-Ado] ratio of PAR generated and purified from rec. PARP1 variants. Means of n=3. Statistical analysis was performed for the whole data set using 1-way ANOVA testing with Dunnett's post test (###P < 0.001), or separately between PARP1\WT and each variant using an unpaired t-test (**P < 0.01; ***P < 0.001). (E) Analysis of chain length distribution of PAR generated and purified from rec. PARP1 variants by HPLC. 10 nmol PAR was loaded respectively.
Figure 2.
Figure 2.
Characterization of PAR formation in HeLa PARP1 KO cells reconstituted with different PARP1-eGFP variants. (A) Mass-spectrometric quantification of PAR levels (R-Ado) after treatment with 500 μM H2O2 for 5 min. Means ± SEM of n = 3–8 independent experiments, each normalized to PARP1\WT. Statistical analysis was performed using one-way ANOVA testing with Dunnett's post-test. (B) Mass-spectrometric quantification of the [A.U.C. of R2-Ado] / [A.U.C. of R-Ado] ratio of purified PAR after treatment with 500 μM H2O2 for 5 min. Means ± SEM of n = 3–8 independent experiments. Statistical analysis was performed for the whole data set using one-way ANOVA testing with Dunnett's post-test (###P < 0.001), or separately between PARP1\WT and each variant using an unpaired t-test (*P < 0.05; ***P < 0.001). (C) Intracellular NAD+ levels with or without H2O2 treatment (concentrations as indicated) for 7 min, as measured by an enzymatic NAD+ cycling assay. Means ± SEM of n = 3–4 independent experiments. Statistical analysis was performed using two-way ANOVA testing with Sidak's post test. (D) Single-cell immuno-epifluorescence analysis of PAR-synthesis using the anti-PAR-specific 10H antibody. Densitometric quantification of epifluorescence imaging data using a KNIME workflow as described in material and methods. Means ± SEM of n = 3 independent experiments. Statistical analysis was performed using two-way ANOVA testing.
Figure 3.
Figure 3.
Analyses of different endpoints of cellular physiology of HeLa PARP1 KO cells reconstituted with PARP1-eGFP variants. In all cases, PARP1-reconstituted HeLa PARP1 KO cells were analyzed. (A) Clonogenic survival assay. After transfection, cells were sorted and 100 GFP-positive cells were plated and cultivated for 7 days prior to colony counting. Means ± SEM of n = 3 independent experiments. [N.B. this data set is part of the experiment shown in Figure 5A and replotted here for ease of reader friendliness]. (B) Cell proliferation assay via cell trace violet and subsequent flow cytometric analysis. n = 1. (C) Cell cycle analysis via PI staining and subsequent flow cytometric analysis. Means ± SEM of n = 4 independent experiments. Statistical analysis was performed using repeated measures one-way ANOVA testing with Dunnett's post-test. (D) Cytotoxicity analysis via Annexin V/PI staining and subsequent flow cytometric analysis of cells before and after treatment with 10 μM ABT888. Means ± SEM of n = 6 independent experiments for untreated (including n = 4 values from the experiment shown in Figure 5B) and of n = 2 independent experiments for ABT888 treated cells. Statistical analysis was performed using two-way ANOVA testing with Sidak's post-test.
Figure 4.
Figure 4.
Expression analysis of PARP1-eGFP variants in reconstituted HeLa PARP1 KO cells compared to HeLa WT cells. (A–C) Densitometric analysis of western blot signal intensities of PARP1 protein levels in HeLa WT or PARP1 KO cells reconstituted with different PARP1 variants (A) 24 h, (B) 48 h or (C) 72 h after transfection. Cells were either untreated or treated with 10 μM ABT888 for the indicated duration. Signal intensities were normalized to transfection efficiencies, to β-actin as a loading control and to untreated HeLa WT cells for comparison. Means ± SEM of n = 2–3 independent experiments. Statistical analysis of ‘untreated’ versus ‘ABT888’ was performed using two-way ANOVA testing with Sidak's post-test. Representative blots are shown in Supplementary Figure S4.
Figure 5.
Figure 5.
Genotoxic stress resistance of HeLa PARP1 KO cells reconstituted with PARP1-eGFP variants. In all cases, PARP1-reconstituted HeLa PARP1 KO cells were analyzed. (A) Clonogenic survival assay upon H2O2 treatment. After transfection and respective H2O2 treatment, cells were sorted and 100 GFP-positive cells were plated and cultivated for 7 days prior to colony counting. Means ± SEM of n = 3 independent experiments. (B) Cytotoxicity analysis after CPT treatment via Annexin V/PI staining and subsequent flow cytometric analysis. Normalization to DMSO controls is presented in the right panel. Means ± SEM of n = 4 independent experiments. (C) Effect of CPT treatment on cell cycle progression analyzed via PI staining and subsequent flow cytometry. Means ± SEM of n = 4 independent experiments. Statistical analysis was performed using two-way ANOVA testing with Sidak's post-test.
Figure 6.
Figure 6.
PARP1 recruitment and dissociation at sites of laser-induced DNA damage in HeLa PARP1 KO cells reconstituted with PARP1-eGFP variants. (A) Representative images. (B) Quantification of recruitment dynamics from image data as shown in (A). Means ± SEM of n = 3 independent experiments, ≥ 42 cells were analyzed per PARP1 variant. Statistical analysis was performed using two-way ANOVA testing. (C) Normalized PARP1 recruitment data from (A), with maximum intensity values of each curve set to 100%, respectively. Statistical analysis was performed using two-way ANOVA testing.
Figure 7.
Figure 7.
PARP1 and XRCC1 recruitment in HeLa PARP1/XRCC1 double KO cells reconstituted with PARP1-eGFP variants and mRFP-XRCC1. (A) Quantification of PARP1 recruitment dynamics from image data as shown in Supplementary Figure S6. Means ± SEM of n = 4 independent experiments, ≥52 cells were analyzed per PARP1 variant. (B) Normalized PARP1 recruitment data from (A), with maximum intensity values of each curve set to 100%, respectively. (C) Quantification of XRCC1 recruitment dynamics from image data as shown in Supplementary Figure S6. Means ± SEM of n = 4 independent experiments, ≥52 cells were analyzed per PARP1 variant. (D) Normalized XRCC1 recruitment data from (C), with maximum intensity values for XRCC1 set to 100% for each condition, respectively. Statistical analysis was performed using two-way ANOVA testing.
Figure 8.
Figure 8.
Nucleolar-nucleoplasmic translocation of endogenous XRCC1 in HeLa PARP1 KO cells reconstituted with PARP1-eGFP variants. (A) Representative images from single-cell immunofluorescence analysis of endogenous XRCC1 translocation from the nucleoli to the nucleoplasm. (B) Densitometric quantification of confocal imaging data from (A) analyzing XRCC1 translocation via a KNIME workflow. Means ± SEM of n = 4 independent experiments. Statistical analysis was performed using two-way ANOVA testing with Sidak's post-test.
Figure 9.
Figure 9.
Effects of PARP1 variants on expression profiles of an array of 80 genes-of-interest. In all cases, PARP1-eGFP-reconstituted HeLa PARP1 KO cells were analyzed by high throughput RT qPCR. The volcano plots show the magnitude (fold regulation, x-axis) and the significance (–log10P-value, y-axis) of gene expression changes between PARP1 KO cells reconstituted with the respective PARP1 variant compared to cells reconstituted with PARP1\WT. Horizontal lines indicate the statistical significance threshold (P ≤ 0.05, statistical analysis was performed by an independent samples t-test, n = 3 independent experiments); vertical lines indicate no change in gene expression. Genes that are differentially expressed at a significant level are labelled with the corresponding names. All genes included in the analysis are listed in Supplementary Table S1.
Figure 10.
Figure 10.
Analysis of PAR branching during cellular genotoxic stress response and PARG activity on PAR produced by the different PARP1 variants in vitro. (A) Mass spectrometric quantification of R-Ado (black) and the [A.U.C. R2-Ado]/[A.U.C. R-Ado] ratio (orange) of PAR purified from HeLa WT cells after treatment with 500 μM H2O2 as indicated. Means ± SEM of n = 3 independent experiments. (B) Time-dependent degradation of PAR purified from rec. PARP1 variants by PARG. Generated ADP-ribose units were quantified via an ADP-ribose calibration curve as published previously (89). Background levels of ADP-ribose within the different PAR samples in the absence of PARG are subtracted. Means ± SEM of n = 3–4 independent experiments. Statistical analysis was performed using two-way ANOVA testing with Sidak's post-test.
Figure 11.
Figure 11.
Characterization of PAR levels and PAR branching in different mouse organs. (A) Mass-spectrometric analysis of PAR-amounts (R-Ado) purified from mouse tissues as indicated. Means ± SEM of n = 7 mice. Statistical analysis was performed using repeated measures one-way ANOVA testing with Dunnett's post-test. (B) Mass-spectrometric analysis of the [A.U.C. R2-Ado]/[A.U.C. R-Ado] ratio of purified PAR from mouse tissues as indicated. Means ± SEM of n = 6–7 mice. Statistical analysis was performed using mixed effects repeated measures analysis with Dunnett's post-test. ‘R’ refers to reference organ for statistical testing.

References

    1. Leung A.K.L. PARPs. Curr. Biol. 2017; 27:R1256–R1258. - PubMed
    1. Gupte R., Liu Z., Kraus W.L.. PARPs and ADP-ribosylation: recent advances linking molecular functions to biological outcomes. Genes Dev. 2017; 31:101–126. - PMC - PubMed
    1. Slade D. PARP and PARG inhibitors in cancer treatment. Genes Dev. 2020; 34:360–394. - PMC - PubMed
    1. Lord C.J., Ashworth A.. PARP inhibitors: synthetic lethality in the clinic. Science. 2017; 355:1152–1158. - PMC - PubMed
    1. Luscher B., Butepage M., Eckei L., Krieg S., Verheugd P., Shilton B.H.. ADP-Ribosylation, a multifaceted posttranslational modification involved in the control of cell physiology in health and disease. Chem. Rev. 2018; 118:1092–1136. - PubMed

Publication types

MeSH terms

Substances