

Age-related accumulation of de novo mitochondrial mutations in mammalian oocytes and somatic tissues
- PMID: 32667908
- PMCID: PMC7363077
- DOI: 10.1371/journal.pbio.3000745
Age-related accumulation of de novo mitochondrial mutations in mammalian oocytes and somatic tissues
Abstract
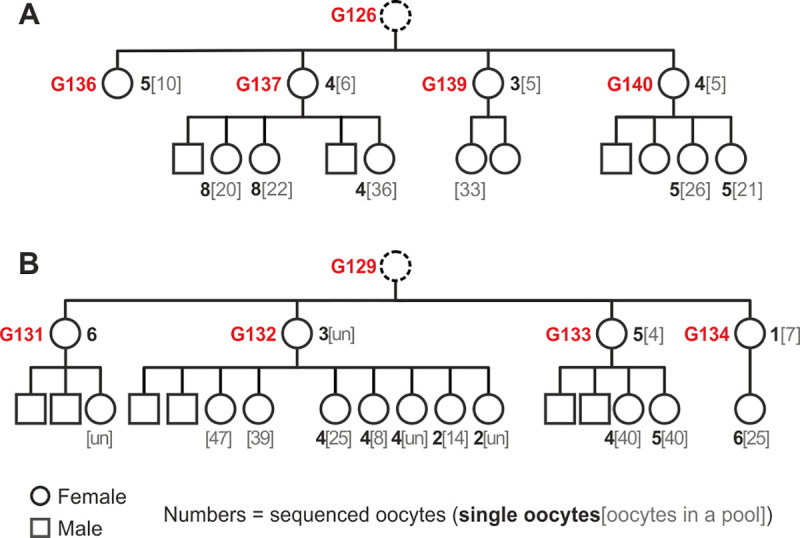
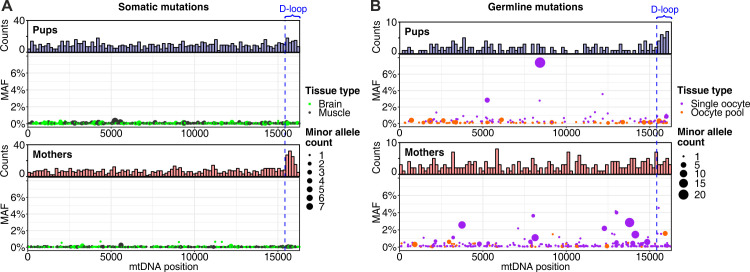
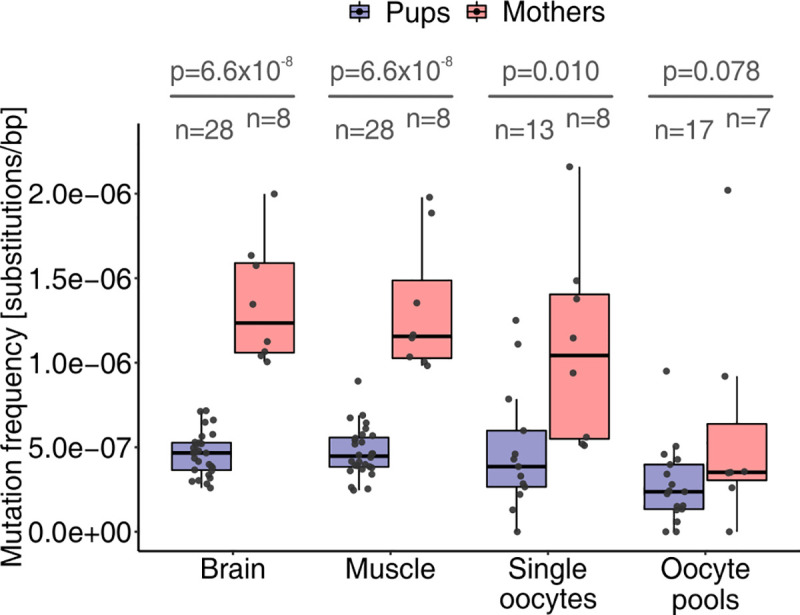
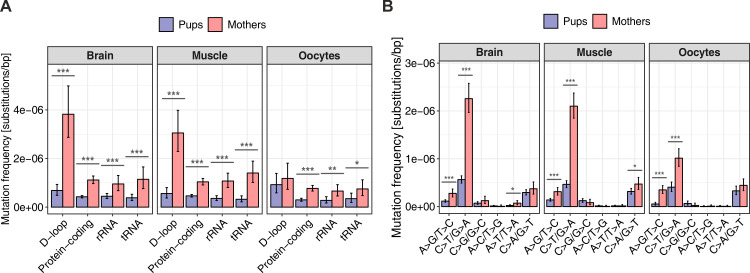
Mutations create genetic variation for other evolutionary forces to operate on and cause numerous genetic diseases. Nevertheless, how de novo mutations arise remains poorly understood. Progress in the area is hindered by the fact that error rates of conventional sequencing technologies (1 in 100 or 1,000 base pairs) are several orders of magnitude higher than de novo mutation rates (1 in 10,000,000 or 100,000,000 base pairs per generation). Moreover, previous analyses of germline de novo mutations examined pedigrees (and not germ cells) and thus were likely affected by selection. Here, we applied highly accurate duplex sequencing to detect low-frequency, de novo mutations in mitochondrial DNA (mtDNA) directly from oocytes and from somatic tissues (brain and muscle) of 36 mice from two independent pedigrees. We found mtDNA mutation frequencies 2- to 3-fold higher in 10-month-old than in 1-month-old mice, demonstrating mutation accumulation during the period of only 9 mo. Mutation frequencies and patterns differed between germline and somatic tissues and among mtDNA regions, suggestive of distinct mutagenesis mechanisms. Additionally, we discovered a more pronounced genetic drift of mitochondrial genetic variants in the germline of older versus younger mice, arguing for mtDNA turnover during oocyte meiotic arrest. Our study deciphered for the first time the intricacies of germline de novo mutagenesis using duplex sequencing directly in oocytes, which provided unprecedented resolution and minimized selection effects present in pedigree studies. Moreover, our work provides important information about the origins and accumulation of mutations with aging/maturation and has implications for delayed reproduction in modern human societies. Furthermore, the duplex sequencing method we optimized for single cells opens avenues for investigating low-frequency mutations in other studies.
Conflict of interest statement
The authors have declared that no competing interests exist.
Figures
Similar articles
-
Advanced age increases frequencies of de novo mitochondrial mutations in macaque oocytes and somatic tissues.Proc Natl Acad Sci U S A. 2022 Apr 12;119(15):e2118740119. doi: 10.1073/pnas.2118740119. Epub 2022 Apr 8. Proc Natl Acad Sci U S A. 2022. PMID: 35394879 Free PMC article.
-
A replication-linked mutational gradient drives somatic mutation accumulation and influences germline polymorphisms and genome composition in mitochondrial DNA.Nucleic Acids Res. 2021 Nov 8;49(19):11103-11118. doi: 10.1093/nar/gkab901. Nucleic Acids Res. 2021. PMID: 34614167 Free PMC article.
-
Replication Errors Made During Oogenesis Lead to Detectable De Novo mtDNA Mutations in Zebrafish Oocytes with a Low mtDNA Copy Number.Genetics. 2016 Dec;204(4):1423-1431. doi: 10.1534/genetics.116.194035. Epub 2016 Oct 21. Genetics. 2016. PMID: 27770035 Free PMC article.
-
Mitochondrial DNA and the mammalian oocyte.Curr Top Dev Biol. 2007;77:87-111. doi: 10.1016/S0070-2153(06)77004-1. Curr Top Dev Biol. 2007. PMID: 17222701 Review.
-
The role of mitochondria in the female germline: Implications to fertility and inheritance of mitochondrial diseases.Cell Biol Int. 2018 Jun;42(6):711-724. doi: 10.1002/cbin.10947. Epub 2018 Mar 1. Cell Biol Int. 2018. PMID: 29418047 Review.
Cited by
-
Maintaining mitochondrial DNA copy number mitigates ROS-induced oocyte decline and female reproductive aging.Commun Biol. 2024 Oct 1;7(1):1229. doi: 10.1038/s42003-024-06888-x. Commun Biol. 2024. PMID: 39354016 Free PMC article.
-
Mitochondrial haplotype and mito-nuclear matching drive somatic mutation and selection throughout aging.bioRxiv [Preprint]. 2023 Oct 23:2023.03.06.531392. doi: 10.1101/2023.03.06.531392. bioRxiv. 2023. Update in: Nat Ecol Evol. 2024 May;8(5):1021-1034. doi: 10.1038/s41559-024-02338-3. PMID: 36945529 Free PMC article. Updated. Preprint.
-
The Mitochondrial Genome in Aging and Disease and the Future of Mitochondrial Therapeutics.Biomedicines. 2022 Feb 18;10(2):490. doi: 10.3390/biomedicines10020490. Biomedicines. 2022. PMID: 35203698 Free PMC article. Review.
-
Mitochondrial mutations in Caenorhabditis elegans show signatures of oxidative damage and an AT-bias.Genetics. 2021 Oct 2;219(2):iyab116. doi: 10.1093/genetics/iyab116. Genetics. 2021. PMID: 34849888 Free PMC article.
-
Electrofusion Stimulation Is an Independent Factor of Chromosome Abnormality in Mice Oocytes Reconstructed via Spindle Transfer.Front Endocrinol (Lausanne). 2021 Jul 28;12:705837. doi: 10.3389/fendo.2021.705837. eCollection 2021. Front Endocrinol (Lausanne). 2021. PMID: 34413830 Free PMC article.
References
Publication types
MeSH terms
Substances
Grants and funding
LinkOut - more resources
Full Text Sources
Medical
