

doi: 10.1093/cid/ciaa975.
Implications of Efavirenz Pharmacogenetics When Switching From Efavirenz- to Dolutegravir-containing Antiretroviral Regimens
Affiliations
- PMID: 32667979
- PMCID: PMC8130017
- DOI: 10.1093/cid/ciaa975
Item in Clipboard
Implications of Efavirenz Pharmacogenetics When Switching From Efavirenz- to Dolutegravir-containing Antiretroviral Regimens
Clin Infect Dis.
.
Abstract
Many patients switch from efavirenz- to dolutegravir-based regimens. In a phase 1 dolutegravir-efavirenz interaction study, mean dolutegravir minimum concentration decreased by 60% and 85% among CYP2B6 normal and slow/intermediate metabolizers, respectively. Mean efavirenz half-life was 2.7 times greater in slow vs normal metabolizers. Slow metabolizers will experience more prolonged subtherapeutic dolutegravir concentrations.
Keywords: dolutegravir; efavirenz; pharmacogenetics.
© The Author(s) 2020. Published by Oxford University Press for the Infectious Diseases Society of America. All rights reserved. For permissions, e-mail: journals.permissions@oup.com.
Figures
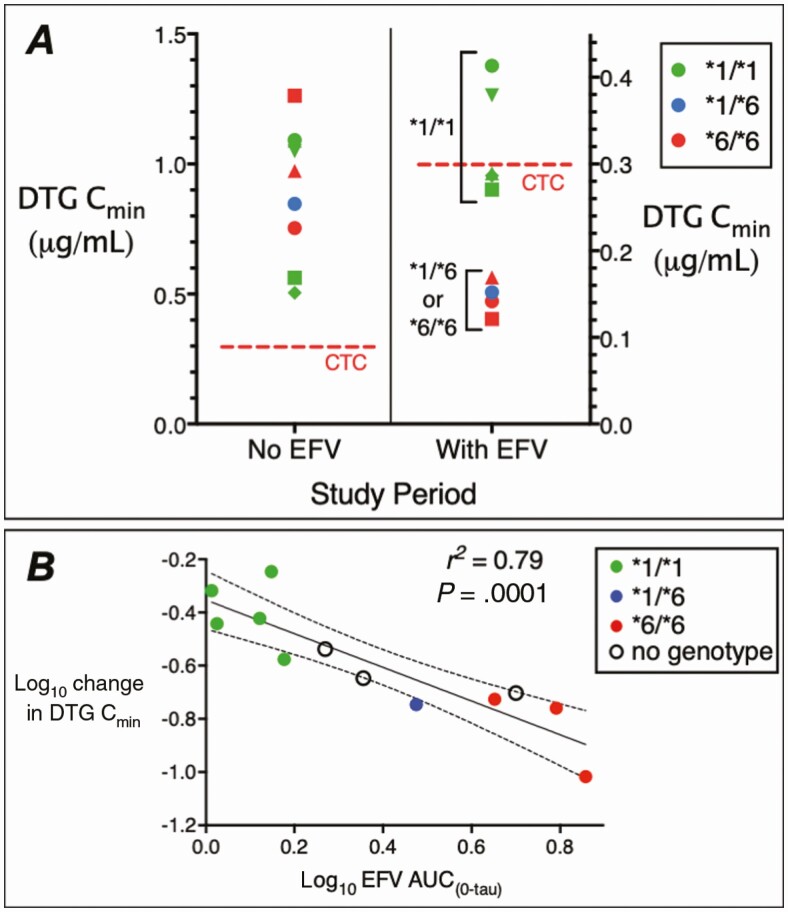
Pharmacogenetics of the interaction of dolutegravir (DTG) with efavirenz (EFV). A, Plasma DTG minimum concentration (Cmin) values among 9 volunteers after 5 days of DTG 50 mg every 24 hours without EFV (left), and after 14 days of DTG 50 mg every 24 hours plus EFV 600 mg every 24 hours (right). The red dashed lines indicate the DTG clinical target concentration (CTC) of 0.3 μg/mL. Different marker shapes distinguish participants. Note the different y-axis scales. B, Relationship between log10 change in plasma DTG Cmin values and log10 plasma EFV area under the concentration-time curve (AUC0–tau) values. Each marker represents log10 change in plasma DTG Cmin values from period 1 to period 2 in each participant. The black line represents linear regression and the dashed lines represent 95% confidence intervals. Colored markers indicate CYP2B6 metabolizer genotypes as normal (*1/*1) in green, intermediate (*1/*6) in blue, slow (*6/*6) in red, and individuals who did not consent for genetic testing as open circles.
Comment in
-
Strategies for Implementation Research to Investigate the Negative Pharmacokinetic Interaction Between Efavirenz and Dolutegravir.Clin Infect Dis. 2021 May 18;72(10):1823-1825. doi: 10.1093/cid/ciaa982. Clin Infect Dis. 2021. PMID: 32667998 Free PMC article. No abstract available.
References
-
- World Health Organization. Update of recommendations on first- and second-line antiretroviral regimens—policy brief. Available at: https://www.who.int/hiv/pub/arv/arv-update-2019-policy/en/. Accessed 16 March 2020.
-
- Vitoria M, Hill A, Ford N, et al. . The transition to dolutegravir and other new antiretrovirals in low-income and middle-income countries: what are the issues? AIDS 2018; 32:1551–61. - PubMed
-
- Trottier B, Lake JE, Logue K, et al. . Dolutegravir/abacavir/lamivudine versus current ART in virally suppressed patients (STRIIVING): a 48-week, randomized, non-inferiority, open-label, phase IIIb study. Antivir Ther 2017; 22:295–305. - PubMed
-
- Generaux G, Song I, Bowers B, Piscitelli S. A mechanistic SimCYP simulation evaluating dolutegravir and efavirenz pharmacokinetics following a switch from once-daily efavirenz to once-daily dolutegravir. In: 15th International Workshop on Clinical Pharmacology of HIV and Hepatitis Therapy, Washington, DC, 19–21 May 2014.
Publication types
MeSH terms
Substances
Grants and funding
LinkOut - more resources
Full Text Sources
Medical
