Comment
. 2020 Aug 18;53(2):442-455.e4.
doi: 10.1016/j.immuni.2020.06.024. Epub 2020 Jun 30.

Next-Generation Sequencing of T and B Cell Receptor Repertoires from COVID-19 Patients Showed Signatures Associated with Severity of Disease

Affiliations
Comment

Next-Generation Sequencing of T and B Cell Receptor Repertoires from COVID-19 Patients Showed Signatures Associated with Severity of Disease

Christoph Schultheiß et al. Immunity. .

Abstract

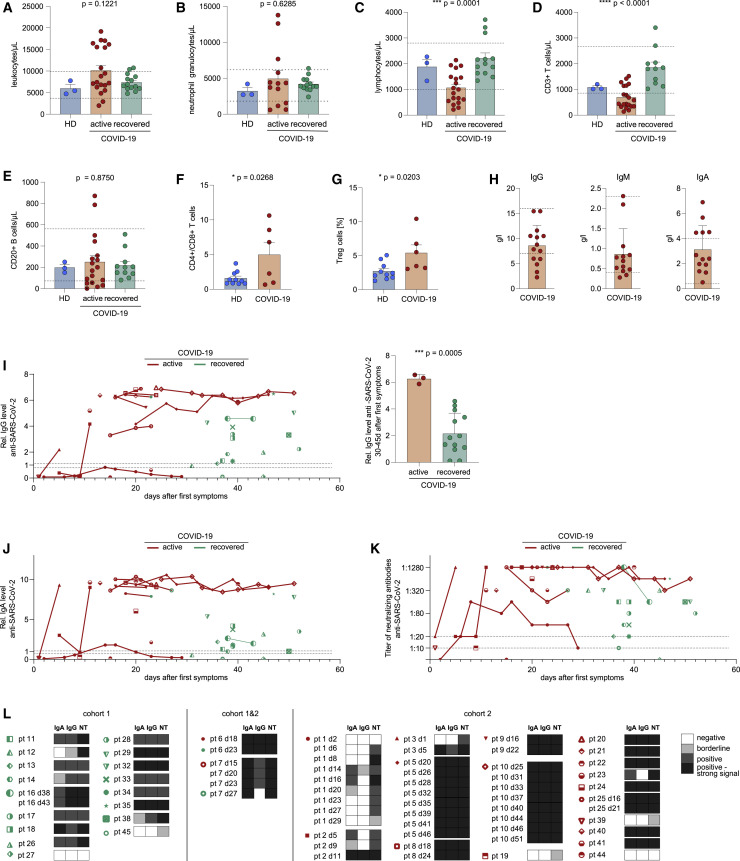
We profiled adaptive immunity in COVID-19 patients with active infection or after recovery and created a repository of currently >14 million B and T cell receptor (BCR and TCR) sequences from the blood of these patients. The B cell response showed converging IGHV3-driven BCR clusters closely associated with SARS-CoV-2 antibodies. Clonality and skewing of TCR repertoires were associated with interferon type I and III responses, early CD4+ and CD8+ T cell activation, and counterregulation by the co-receptors BTLA, Tim-3, PD-1, TIGIT, and CD73. Tfh, Th17-like, and nonconventional (but not classical antiviral) Th1 cell polarizations were induced. SARS-CoV-2-specific T cell responses were driven by TCR clusters shared between patients with a characteristic trajectory of clonotypes and traceability over the disease course. Our data provide fundamental insight into adaptive immunity to SARS-CoV-2 with the actively updated repository providing a resource for the scientific community urgently needed to inform therapeutic concepts and vaccine development.

Keywords: B cell repertoire; COVID-19; SARS-CoV-2-specific antibody; T cell compartments; T cell receptor clusters; T cell repertoire; cytokine profile; immunoglobulin heavy chain; interferon.


Conflict of interest statement

Declaration of Interests The authors declare no competing interests.

Figures

Figure 1
Figure 1
COVID-19 Disease Courses in Patients from Cohorts 1 and 2 Overview of COVID-19 disease course, intervention, and sample collection of patients infected with SARS-CoV-2 in cohort 1 (recovered) and 2 (active). pt, patient. See also Tables S1 and S2.
Figure 2
Figure 2
Basic Laboratory Characteristics of COVID-19 Cohorts (A–E) Total number of leukocytes (A), granulocytes (B), lymphocytes (C), CD3+ T cells (D), and CD20+ B cells (E) per microliter of blood in HDs and COVID-19 cohorts 1 (recovered) and 2 (active). The gray dotted lines indicate the respective lower and upper limits of the reference range. (F and G) Ratio of CD4+:CD8+ T cells (F) and percentage of regulatory T cells (G) in healthy donors (HDs) and patients with active COVID-19. (H) Immunoglobulin (Ig) levels in patients with active COVID-19. Gray dotted lines indicate respective lower and upper limits of reference range. (I and J) Relative levels of anti-SARS-CoV-2 IgG (I) and IgA (J). Black dotted lines indicate borderline range. (K) Neutralizing antibodies against infectious SARS-CoV-2 isolate were analyzed. Analysis was started with a 1:10 dilution. Seropositivity is defined by a titer ≥1:20. (L) Heatmap of results from (I)–(K). NT, neutralizing anti-SARS-CoV-2 antibodies. The error bars indicate mean ± SDs. Statistical analysis: 2-sided unpaired t-test (2 groups), ordinary 1-way ANOVA (3 groups).
Figure 3
Figure 3
Profiling of Soluble Factors in COVID-19 Patients Shows Persistent Cytokine Deregulation and Interferon (IFN) I and III Responses Mean plasma levels of cytokines key to B cell function (A) and viral response (B), as well as soluble immune checkpoints (C) in patients with active disease (n = 20) or after recovery (n = 19) compared to HDs (n = 32). All samples were measured at least in duplicates. Additional data are included in Figure S2. The error bars indicate means ± SDs. Statistical analysis: ordinary 1-way ANOVA. See also Figures S1 and S2.
Figure 4
Figure 4
T Cells from COVID-19 Patients Show Early-Phase CD4+/CD8+ Activation and Helper Cell Polarization toward Tfh, Th17, and Th1 Responses (A) Unbiased analysis of flow cytometry data using SPADEVizR trees shows significant enrichment of differentially abundant clusters (DACs) in active COVID-19 patients and HDs. (B) Results of manual flow cytometry analysis of T and NK cell surface markers depict increased expression of inhibitory markers and ectoenzymes. Values are represented as the percentage of the respective cell population. (C) Comparison of T and NK cell activation and exhaustion markers between COVID-19 patients and HDs. ++, Significantly increased in COVID-19; (+), increased in COVID-19; =, similar in COVID-19 and HDs; (-) decreased in COVID-19, -, significantly decreased in COVID-19; /, not applicable. Additional data are included in Figure S3. (D) Th cell subsets in HDs and COVID-19 patients. Values are represented as the percentage of CD4+ T cells, respectively. Tfh, T follicular helper cells. Th1, non-classical Th1 cells. (E) Differentiation and maturation profiles of CD8+ and CD4+ T cells. The error bars indicate mean ± SEMs. Statistical test: 2-sided unpaired t test. See also Figure S3.
Figure 5
Figure 5
B Cell Repertoire Analysis from Living COVID-19 Sequence Repository Shows BCR Rearrangements Converging toward IGHV3 Usage with Low Somatic Hypermutation and Homology with Antibody Sequence Selected against the SARS-VoV-2 S1 Antigen (A) Peripheral blood IGH repertoire metrics of HDs and patients with active COVID-19 and after recovery. (B) Percentage of peripheral blood BCRs with somatic hypermutation in HDs and patients with active COVID-19 and after recovery. IGH hypermutation in patients with active COVID-19, depending on ventilation status and severity of disease. ECMO, extracorporeal membrane oxygenation. The error bars indicate mean ± SDs. Ordinary 1-way ANOVA (3 groups) or 2-sided unpaired t-test (2 groups) were used to study the differences between cohorts. (C) B cell repertoire-wide phylogenetic tree analysis of SARS-CoV-2 ELISA-positive (n = 13) versus -negative (n = 6) samples (left panel), HDs (upper right panel), and an Ebola vaccination cohort (lower right panel). The top 50 clones per IGH repertoire were used for the analysis. (D) Sequence alignment between BCR sequences derived from IGH repertoires of COVID-19 patients from our cohorts, with a SARS-CoV-2 neutralizing single-domain antibody (n3010) recently isolated by Wu et al. (2020c). The asterisk indicates the number of patients. See also Figure S4 and Tables S3, S4, and S5.
Figure 6
Figure 6
T Cell Repertoire Analysis from Living COVID-19 Sequence Repository Shows COVID-19-Specific, Shared TCR Clusters with Characteristic Clonotype Trajectories over Time (A) Peripheral blood TRB repertoire metrics of HDs and patients with active COVID-19 and after recovery. The error bars indicate means ± SDs. Ordinary 1-way ANOVA was used to study differences between cohorts. (B) PCA of combinatorial TRBV/TRBJ gene usage in HDs and patients with active COVID-19 and after recovery. The statistical analysis was performed using the Pillai-Bartlett test of multivariate analysis of variance (MANOVA) of principal components 1 and 2. (C) Distribution and pGen of COVID-19-specific T cell clusters in patients with active COVID-19 and after recovery. (D) Principal-components analysis (PCA) of normalized clonotype frequencies of the most abundant 1,000 clonotypes over all time points (left panel). Mean trajectory ± SE of clonotypes belonging to pattern 1 (expanding) or pattern 2 (contracting) (right panel). See also Figure S4 and Tables S3 and S6.

Comment on

  • COVID-19: consider cytokine storm syndromes and immunosuppression.
    Mehta P, McAuley DF, Brown M, Sanchez E, Tattersall RS, Manson JJ; HLH Across Speciality Collaboration, UK. Mehta P, et al. Lancet. 2020 Mar 28;395(10229):1033-1034. doi: 10.1016/S0140-6736(20)30628-0. Epub 2020 Mar 16. Lancet. 2020. PMID: 32192578 Free PMC article. No abstract available.

References

    1. Aeffner F., Woods P.S., Davis I.C. Ecto-5′-nucleotidase CD73 modulates the innate immune response to influenza infection but is not required for development of influenza-induced acute lung injury. Am. J. Physiol. Lung Cell. Mol. Physiol. 2015;309:L1313–L1322. - PMC - PubMed
    1. Aloui C., Prigent A., Sut C., Tariket S., Hamzeh-Cognasse H., Pozzetto B., Richard Y., Cognasse F., Laradi S., Garraud O. The signaling role of CD40 ligand in platelet biology and in platelet component transfusion. Int. J. Mol. Sci. 2014;15:22342–22364. - PMC - PubMed
    1. Becattini S., Latorre D., Mele F., Foglierini M., De Gregorio C., Cassotta A., Fernandez B., Kelderman S., Schumacher T.N., Corti D. T cell immunity. Functional heterogeneity of human memory CD4+ T cell clones primed by pathogens or vaccines. Science. 2015;347:400–406. - PubMed
    1. Bolotin D.A., Poslavsky S., Mitrophanov I., Shugay M., Mamedov I.Z., Putintseva E.V., Chudakov D.M. MiXCR: software for comprehensive adaptive immunity profiling. Nat. Methods. 2015;12:380–381. - PubMed
    1. Brochet X., Lefranc M.-P., Giudicelli V. IMGT/V-QUEST: the highly customized and integrated system for IG and TR standardized V-J and V-D-J sequence analysis. Nucleic Acids Res. 2008;36:W503–W508. - PMC - PubMed