. 2020 Aug 12;28(2):273-284.e6.
doi: 10.1016/j.chom.2020.06.001. Epub 2020 Jul 14.

High-Fat Diet and Antibiotics Cooperatively Impair Mitochondrial Bioenergetics to Trigger Dysbiosis that Exacerbates Pre-inflammatory Bowel Disease

Affiliations

High-Fat Diet and Antibiotics Cooperatively Impair Mitochondrial Bioenergetics to Trigger Dysbiosis that Exacerbates Pre-inflammatory Bowel Disease

Jee-Yon Lee et al. Cell Host Microbe. .

Abstract

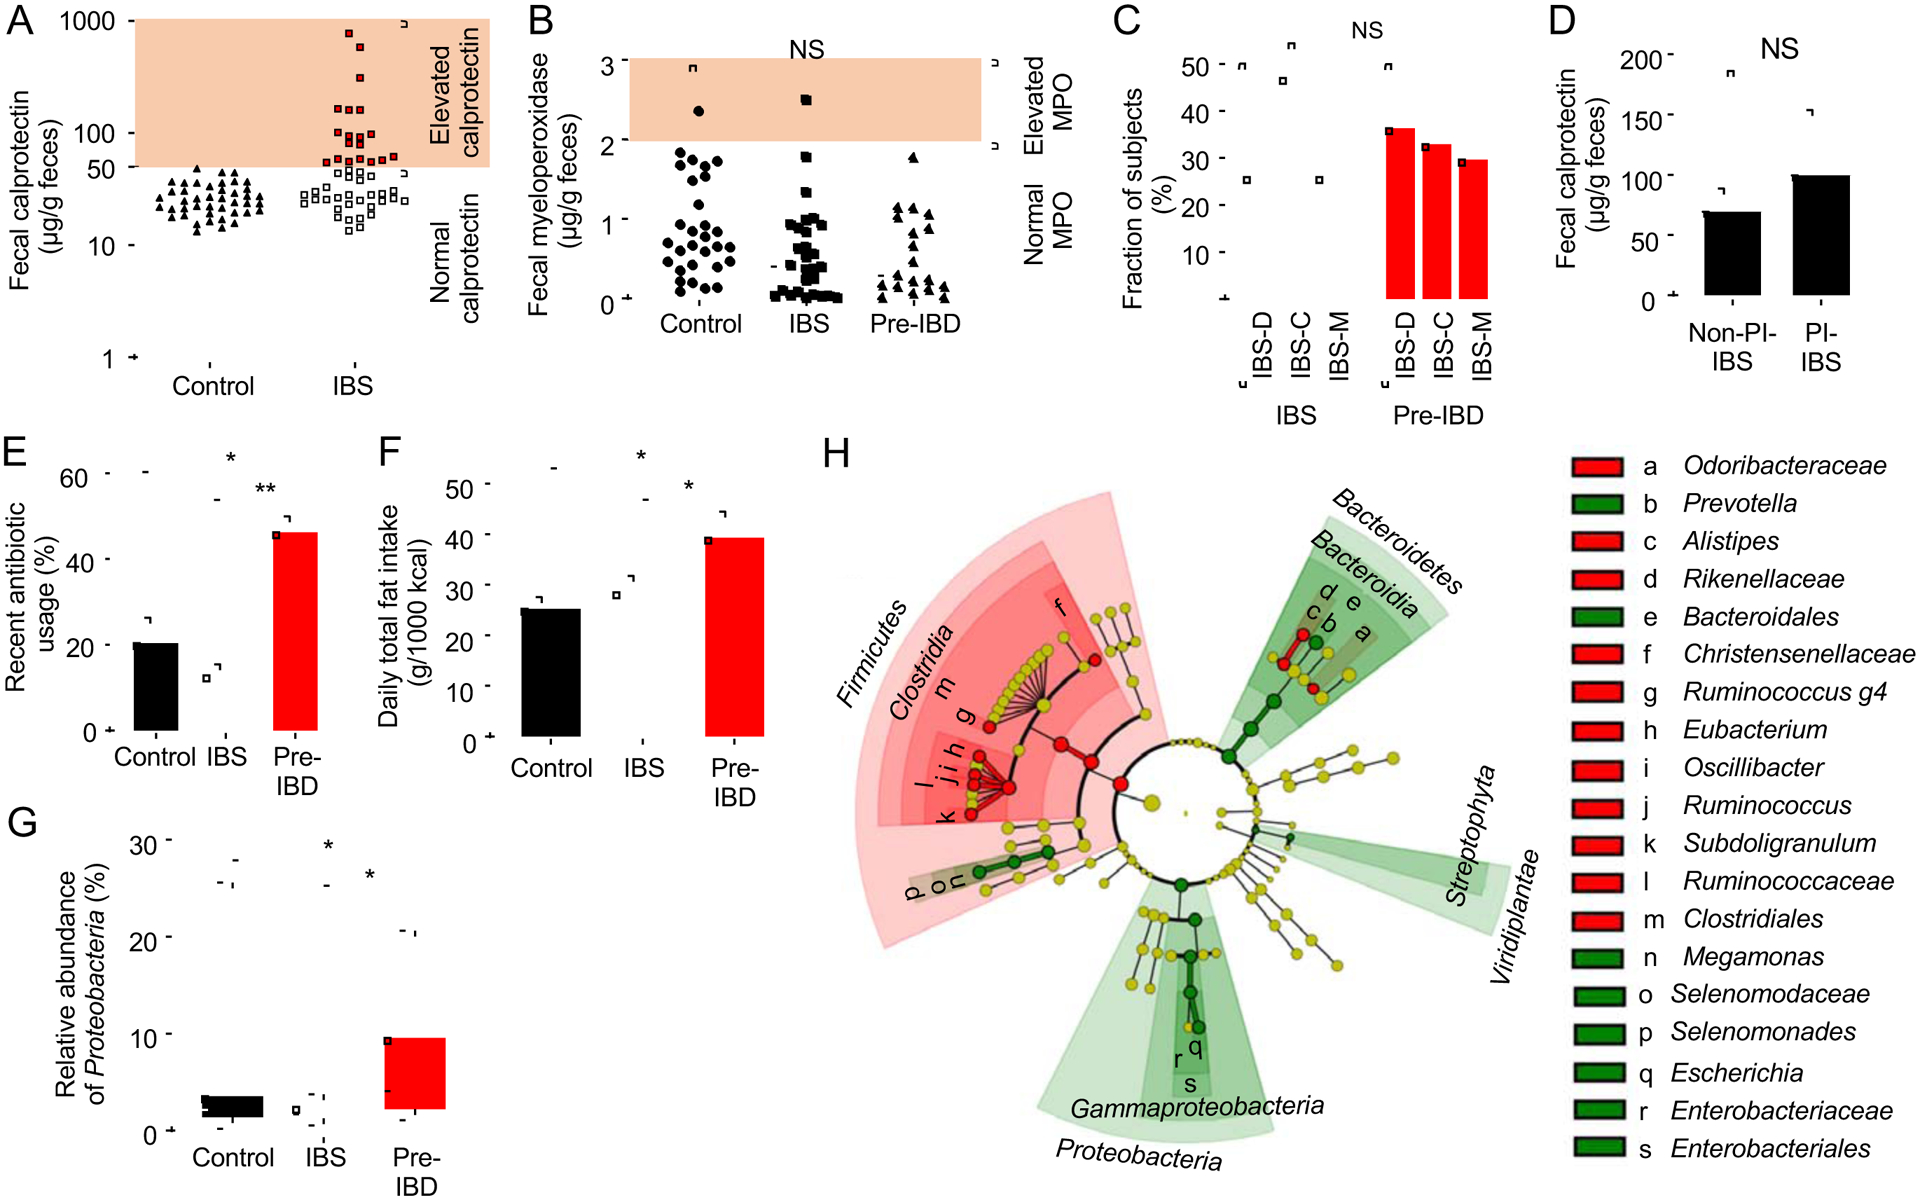
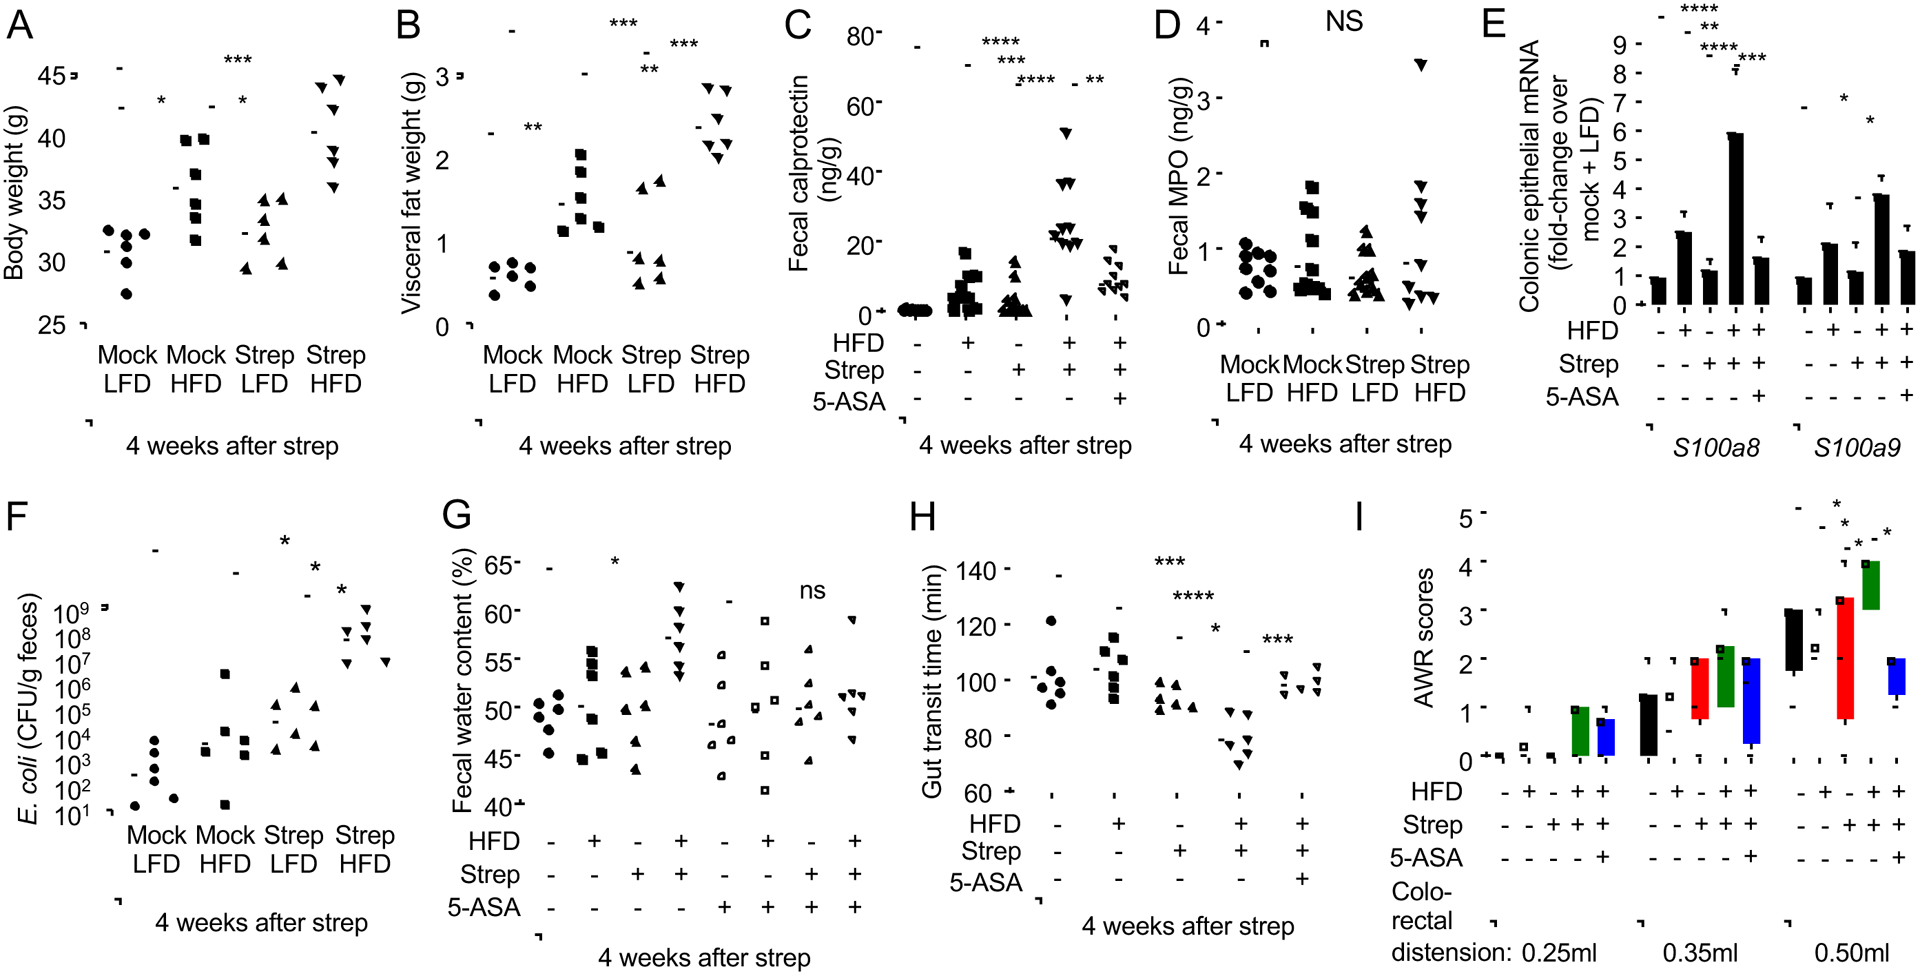
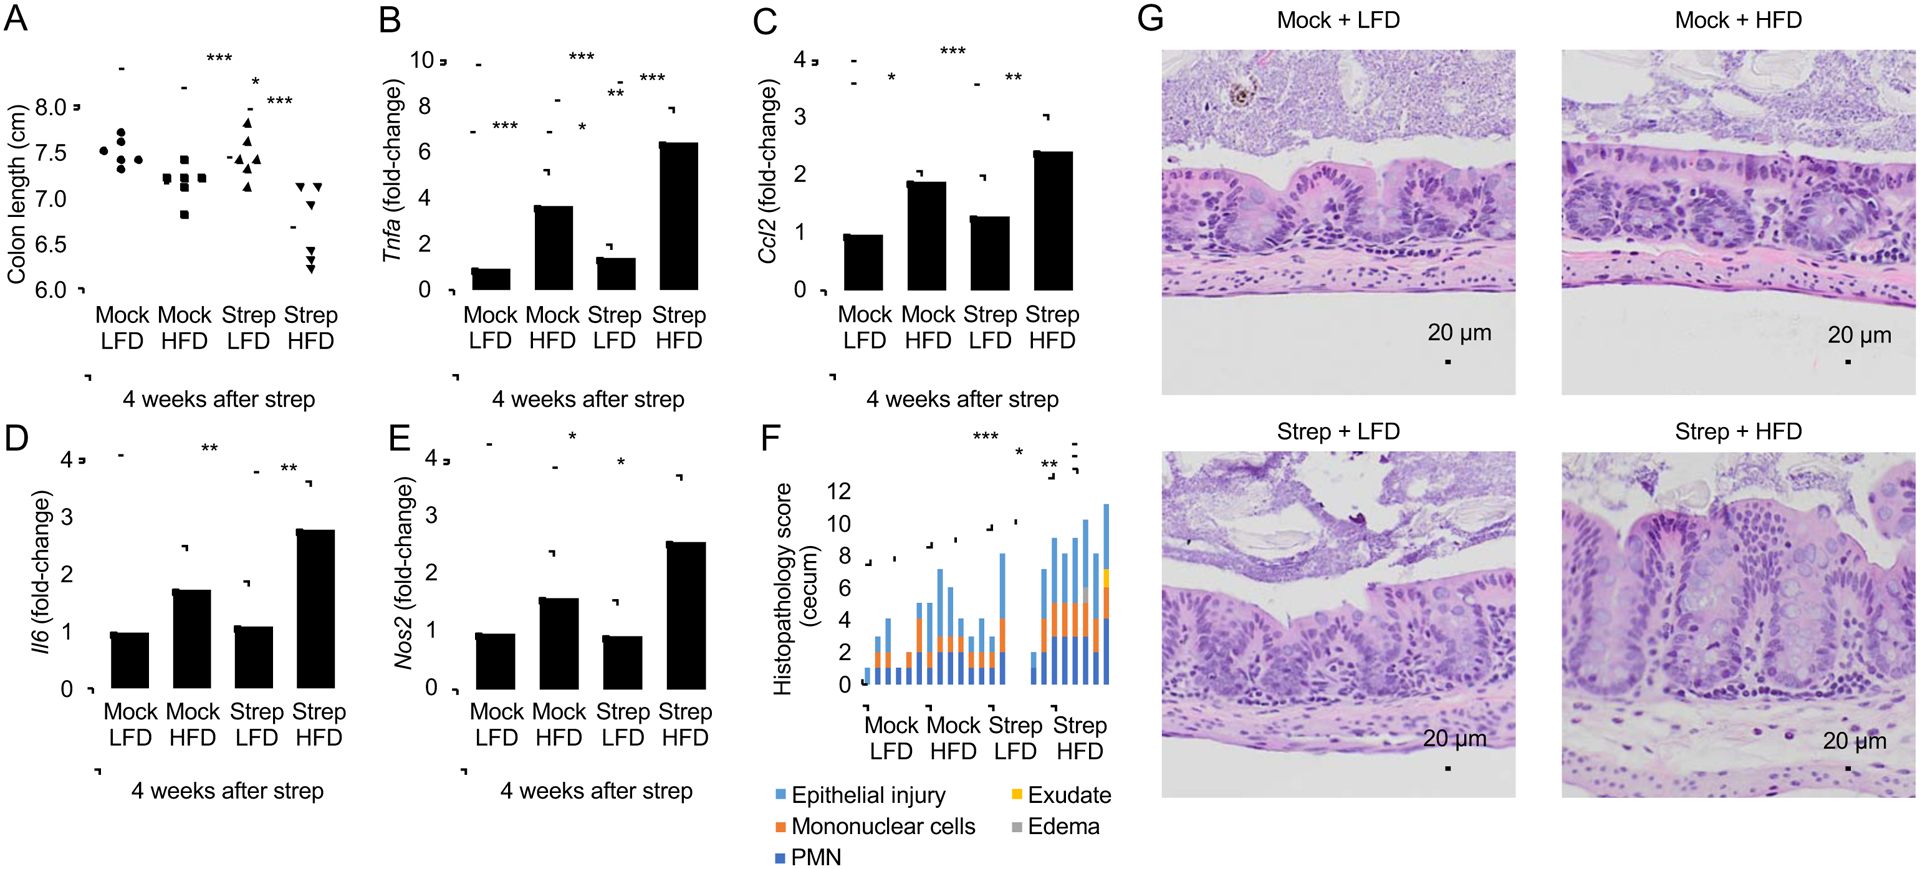
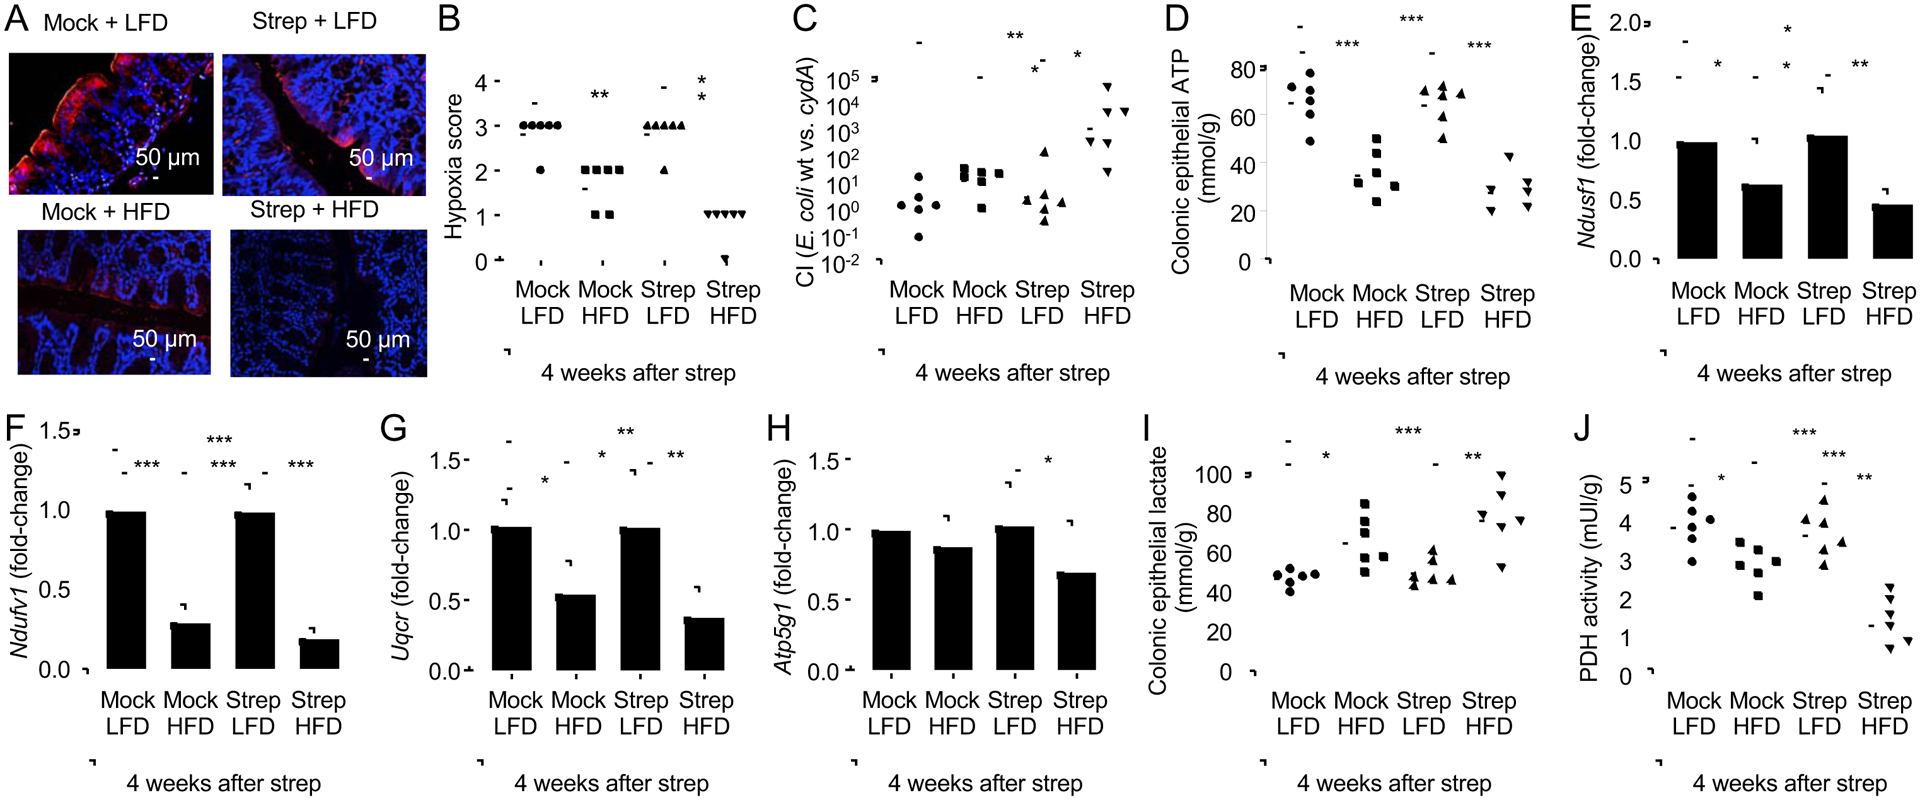
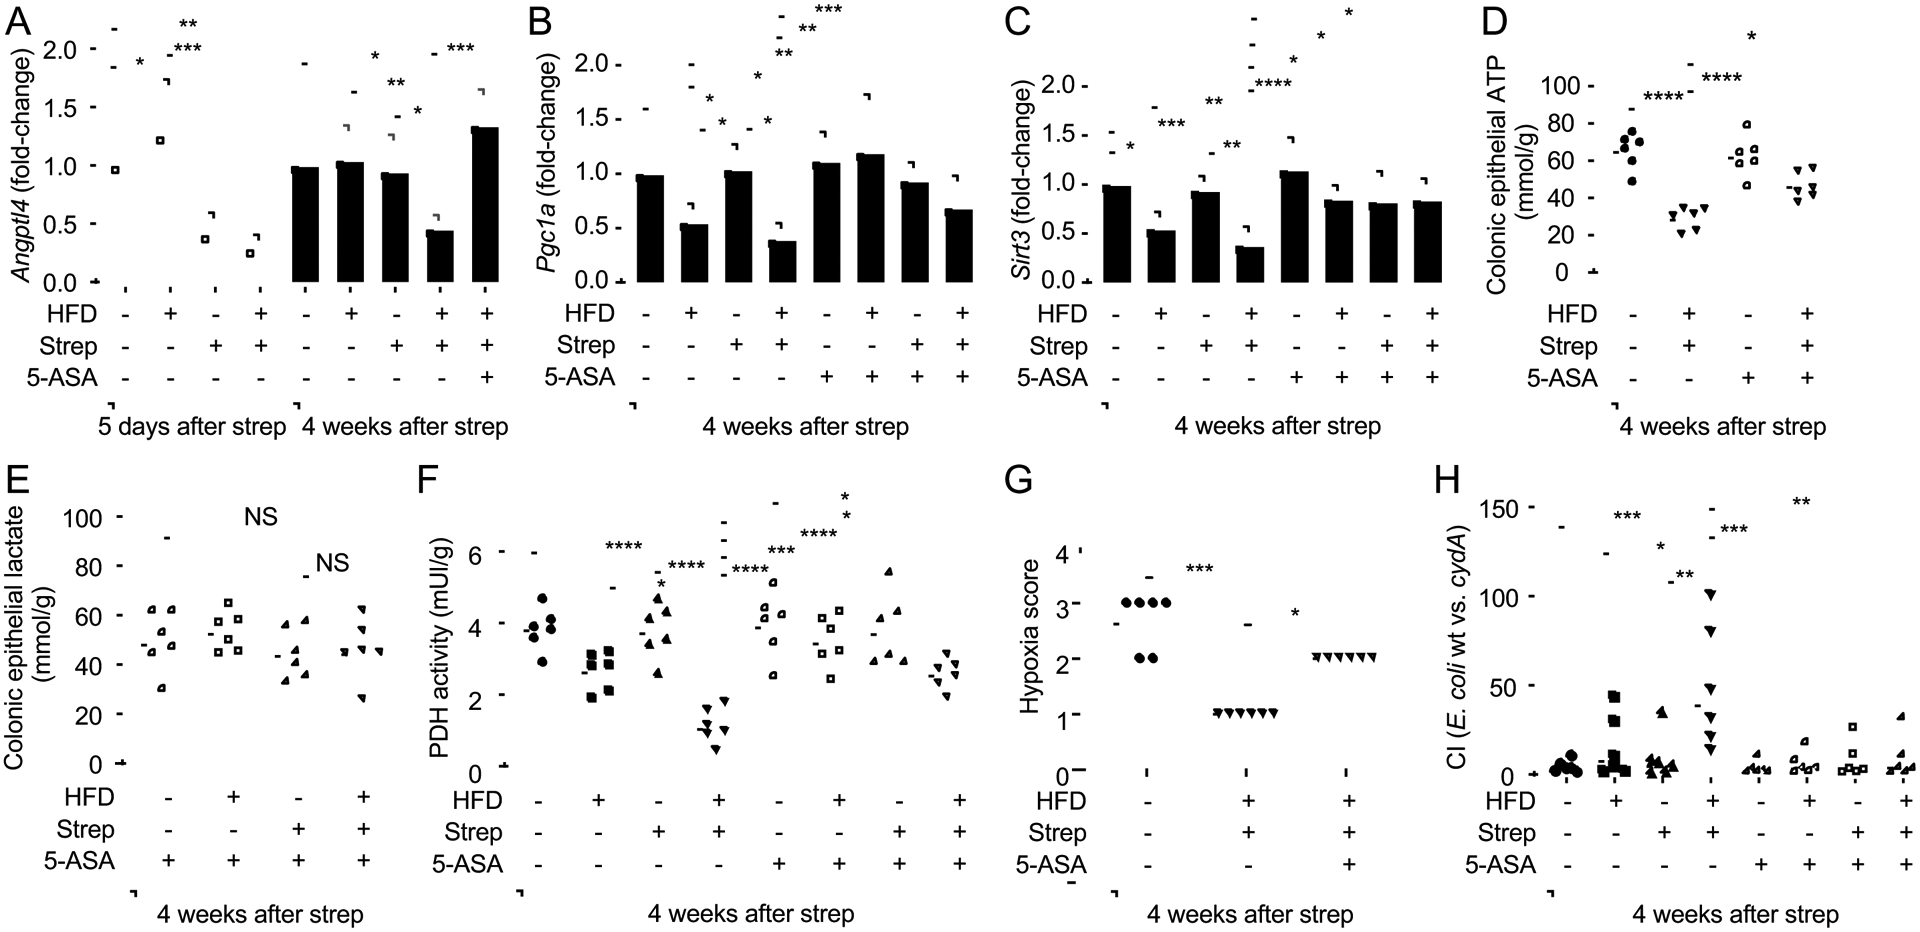
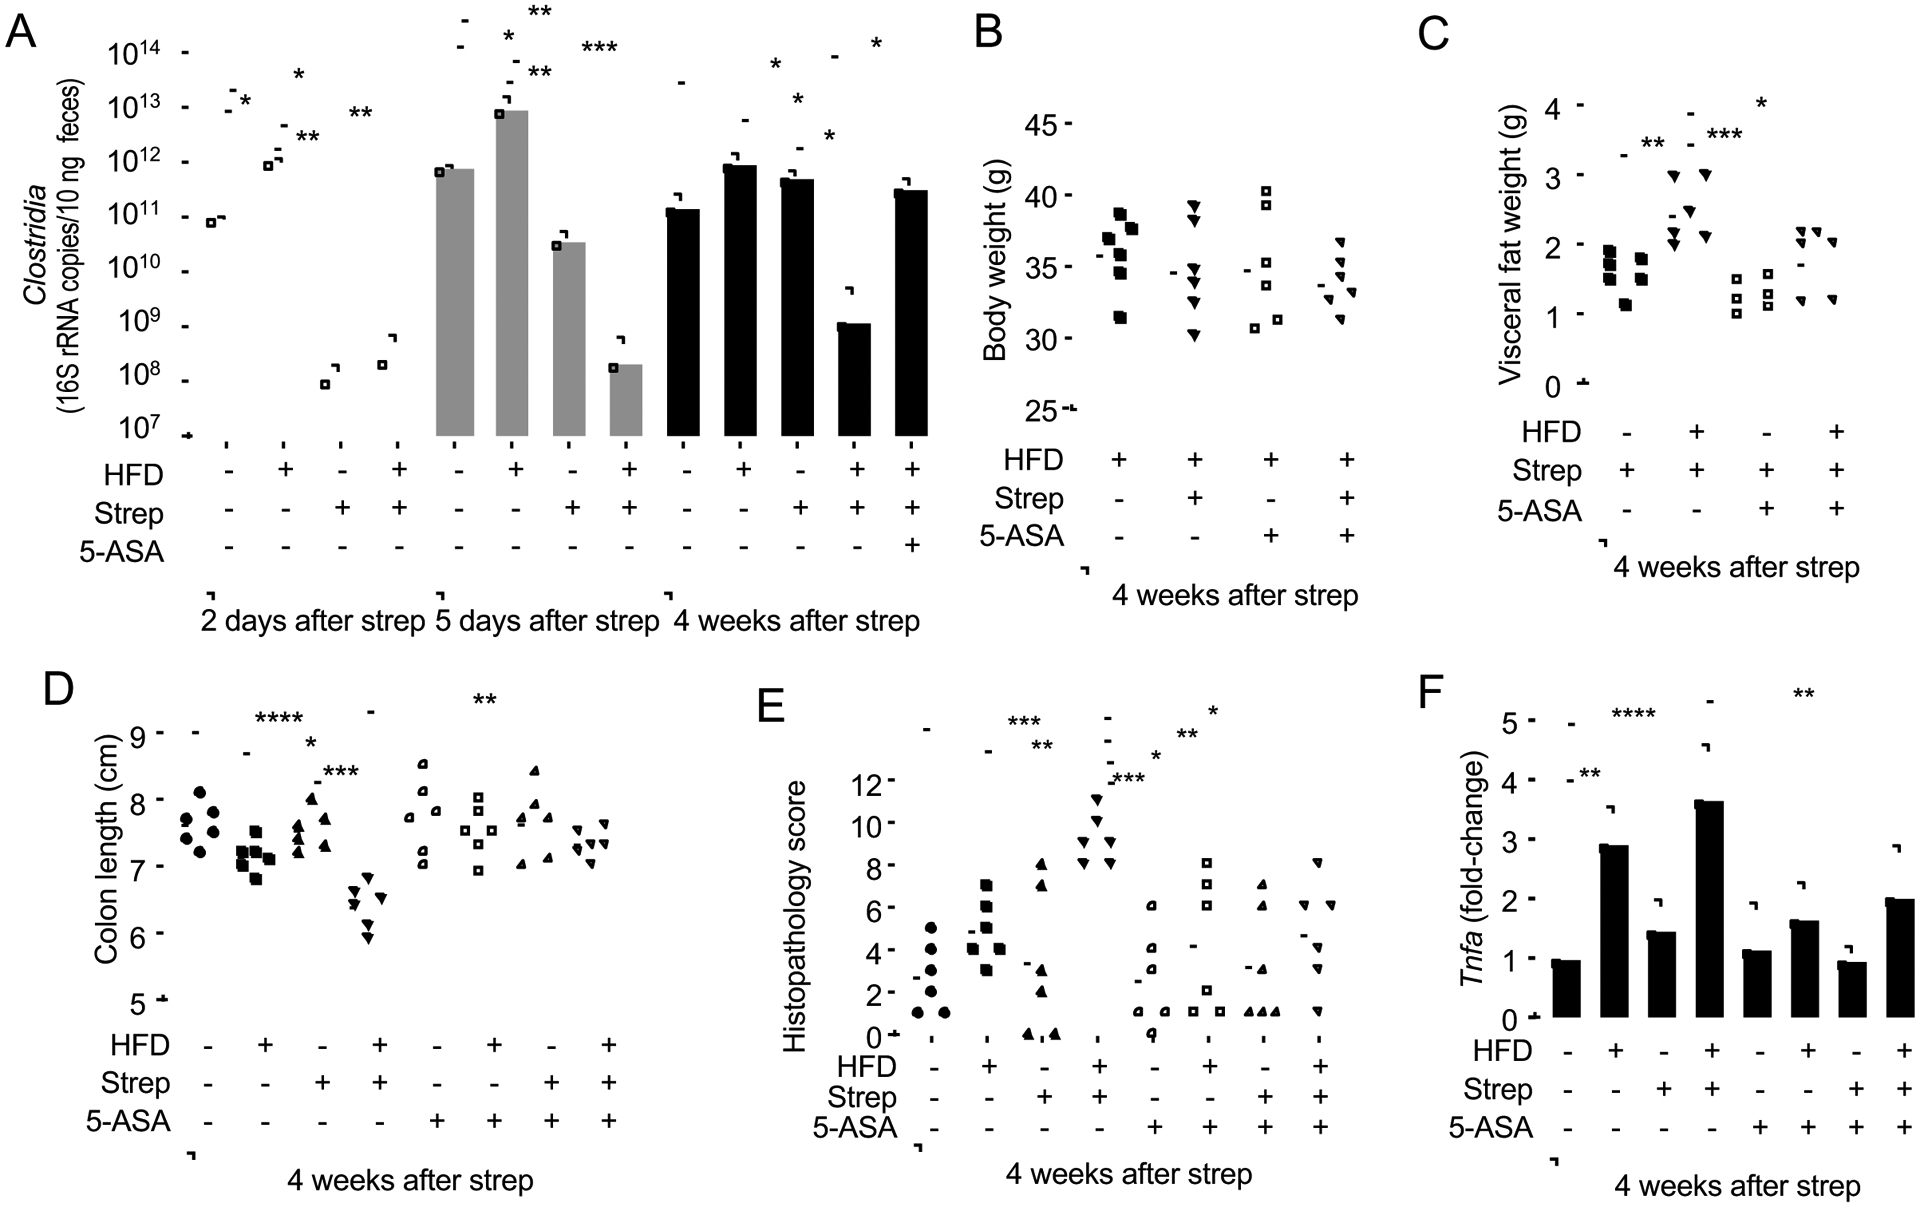
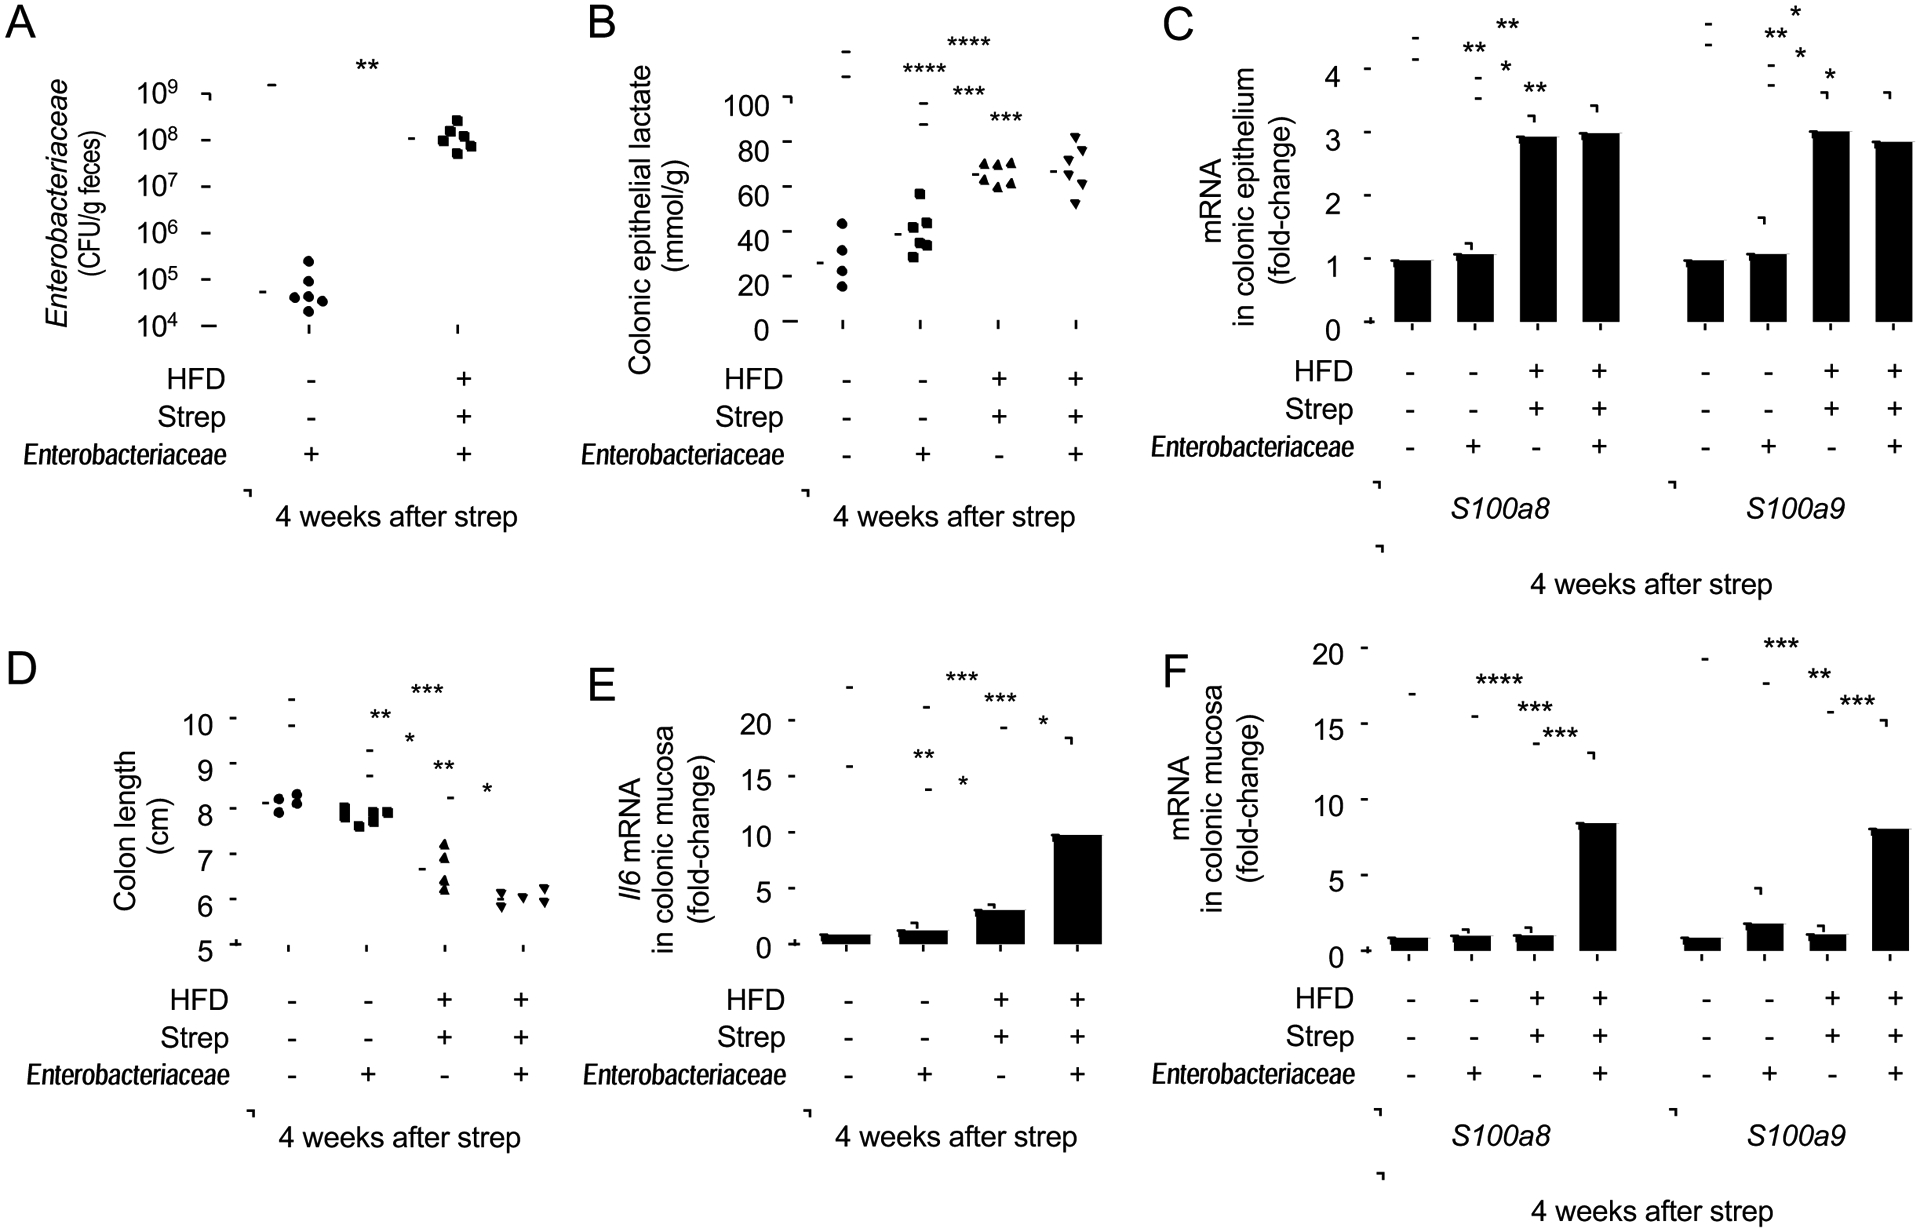
The clinical spectra of irritable bowel syndrome (IBS) and inflammatory bowel disease (IBD) intersect to form a scantily defined overlap syndrome, termed pre-IBD. We show that increased Enterobacteriaceae and reduced Clostridia abundance distinguish the fecal microbiota of pre-IBD patients from IBS patients. A history of antibiotics in individuals consuming a high-fat diet was associated with the greatest risk for pre-IBD. Exposing mice to these risk factors resulted in conditions resembling pre-IBD and impaired mitochondrial bioenergetics in the colonic epithelium, which triggered dysbiosis. Restoring mitochondrial bioenergetics in the colonic epithelium with 5-amino salicylic acid, a PPAR-γ (peroxisome proliferator-activated receptor gamma) agonist that stimulates mitochondrial activity, ameliorated pre-IBD symptoms. As with patients, mice with pre-IBD exhibited notable expansions of Enterobacteriaceae that exacerbated low-grade mucosal inflammation, suggesting that remediating dysbiosis can alleviate inflammation. Thus, environmental risk factors cooperate to impair epithelial mitochondrial bioenergetics, thereby triggering microbiota disruptions that exacerbate inflammation and distinguish pre-IBD from IBS.

Keywords: antibiotics; dysbiosis; high-fat diet; inflammatory bowel disease; irritable bowel syndrome; microbiota.


Conflict of interest statement

Declaration of Interests The authors declare no competing interests.

Figures

Figure 1:
Figure 1:. Subtyping patients using the biomarker fecal calprotectin identifies risk factors for pre-IBD.
(A) Levels of fecal calprotectin were measured in healthy subjects (control) and subjects with symptoms of IBS. IBS participants were sub-grouped into those with normal fecal calprotectin levels (IBS) and elevated fecal calprotectin levels (pre-IBD). (B) Levels of fecal myeloperoxidase (MPO) was measured in patients by ELISA. (C) The graph shows the percentage of IBS patients or pre-IBD patients that had stool forms consistent with IBS-C, IBS-D or IBS-M. (D) Fecal calprotectin levels in patients with PI-IBS and in patients without a history of infection (Non-PI-IBS). (E) Fraction of subjects with a history of antibiotic usage within one year. (F) Daily fat intake was determined by calculating nutrient density and expressed as intake / 1000kcal. (G) Relative abundance of Proteobacteria was determined by microbiota profiling from feces. (H) The cladogram shows differences in taxa composition determined by microbiota profiling of feces of IBS patients and pre-IBD patients. Green, elevated in pre-IBD compared to IBS; Red, reduced in pre-IBD compared to IBS. (A and B) Each symbol represents data from one individual subject. (C-F) Bars represent mean ± standard deviation. (G) The boxes in the Whisker blot represent the 1st to 3rd quartile ranges and the horizontal lines represent the median value. The bars in the whisker blot represent the minimum and maximum value in each group. *, P<0.05; NS, P>0.05. P values were calculated by one-way ANOVA followed by Bonferroni multiple comparison test (F), by Kruskal–Wallis rank test followed by Dunn’s test (A-B, D, G) or by chi square test for categorical data (C,E). See also Figure S1, S2 and S3 and Table S1, S2, S3, S4, S5 and S6
Figure 2:
Figure 2:. A history streptomycin treatment in mice on a high-fat diet induces signs of pre-IBD.
Groups of male (A-G and I) or female (H) mice (N = 6) were reared on a high-fat diet (HFD, 45% fat) or on a low-fat diet (LFD, 10% fat) and were mock treated or treated with a single dose of streptomycin (Strep) four weeks before necropsy. Mouse body weight (A) and visceral fat weight (B) were determined during necropsy. (C, E and G-I) Chow was supplemented with 5-ASA (5-ASA: +) or did not contain supplementation (5-ASA: −). (C) Fecal calprotectin levels were determined by ELISA. (D) Fecal myeloperoxidase (MPO) levels were determined by ELISA. (E) Transcript levels of the indicated genes were determined by quantitative real-time PCR in RNA isolated from colonocyte preparations. (F) Mice were inoculated with E.coli and numbers in the feces determined 4 weeks later. (G and H) The water content of mouse feces (G) and gut transit time (H) were measured. (I) Abdominal withdrawal reflex (AWR) scores at different levels of colorectal distension were measured. (A-B and E-H) Symbols represent data from individual animals and black bars represent geometric mean. *, P<0.05; **, P<0.01; ***, P<0.001; ****, P<0.0001; NS, P>0.05. (C-G) Data were transformed logarithmically before analysis. P values were calculated by one-way ANOVA followed by Tukey’s multiple-comparison tests (A-H) or by a one-tailed non-parametric test (Kruskal Wallis test) followed by Dunn’s multiple-comparison test (I). See also Figure S4, Figure S5 and Table S2.
Fig. 3:
Fig. 3:. Pre-IBD risk factors induce low-grade mucosal inflammation.
Groups of male mice (N = 6) were reared on a high-fat diet (HFD, 45% fat) or on a low3 fat diet (LFD, 10% fat) and were mock treated or treated with a single dose of streptomycin (Strep) four weeks before necropsy. (A) Colon length was determined during necropsy. (B-E) RNA was isolated from preparations of colonic epithelial cells (colonocytes) and transcript levels of Tnfa (B), Ccl2 (C), Il6 (D) and Nos2 (E) were determined by quantitative real-time PCR. Bars represent geometric mean± standard deviation. (F) A veterinary pathologist scored histopathological changes in blinded sections of the cecum. (G) Representative images of Histopathological changes in H&E stained sections of the cecal mucosa. No inflammation or alteration of the mucosal architecture in sections of mock-treated mice on a low-fat diet (Mock + LFD). No inflammation or alteration of the mucosal architecture is present in streptomycin-treated mice on a low-fat diet (Strep + LFD), but occasionally, mild neutrophil infiltration of the lamina propria is observed. In mock-treated mice on a high-fat diet (Mock + HFD) there is mild infiltration of the lamina propria by neutrophils, the mucus layer is diminished, and the surface epithelium is multifocally attenuated with frequent apoptotic cells and occasional loss of cellular adhesion with sloughing. In streptomycin-treated mice on a High-fat diet (Strep + HFD) there is mild to moderate infiltration of the lamina propria and submucosa by neutrophils. The submucosa is mildly expanded by edema. The mucus layer is diminished. The surface epithelium is multifocally attenuated with frequent apoptotic cells and occasional loss of cellular adhesion with sloughing. *, P<0.05; **, P<0.01; ***, P<0.001. (B-E) Data were transformed logarithmically before analysis. P values were calculated by one-way ANOVA followed by Tukey’s multiple-comparison tests (A-E) or by a one-tailed non-parametric test (Kruskal Wallis test) followed by Dunn’s multiple-comparison test (F). See also Table S3.
Figure 4:
Figure 4:. A history streptomycin treatment in mice on a high-fat diet alters epithelial energy metabolism and increases oxygen bioavailability in the colon
Groups of male mice (N = 6) were reared on a high-fat diet (HFD, 45% fat) or on a low-fat diet (LFD, 10% fat) and were mock treated or treated with a single dose of streptomycin (Strep) four weeks before necropsy. (A-B) Binding of pimonidazole was detected using hypoxyprobe-1 primary antibody and a Cy-3 conjugated goat anti-mouse secondary antibody (red fluorescence) in the sections of proximal colon that were counterstained with DAPI nuclear stain (blue fluorescence). (A) Representative images are shown. (B) Pimonidazole staining was quantified by scoring blinded sections of proximal colon. (C) Mice were inoculated with a 1:1 mixture of E.coli wild type (wt) and an isogenic respiration-deficient (cydA) mutant and the competitive index (CI) in colon contents was determined 4 weeks after streptomycin treatment. (D-J) Colonocytes were isolated from the colonic mucosa to measure cytosolic concentrations of ATP (D). (E-H) Transcript levels of genes encoding components of the electron transport chain, including Ndufs1 (E), Ndufv1 (F), Uqcr (G) and Atp5g1 (H) were determined by quantitative real-time PCR in RNA isolated from colonocytes. Lysates of colonocytes were used to measure cytosolic concentrations of lactate (I) and pyruvate dehydrogenase activity (PDH) (J). (B-D, I and J) Dots represent data from individual animals and bars represent geometric mean. (E-H) Bars represent geometric mean± standard deviation. *, P<0.05; **, P<0.01; ***, P<0.001; ****, P<0.0001. (C, E-H) Data were transformed logarithmically before analysis. P values were calculated by a one-tailed non-parametric test (Kruskal Wallis test) followed by Dunn’s multiple-comparison test (B) or by one-way ANOVA followed by Tukey’s multiple-comparison tests (C-J and F). See also Table S2.
Figure 5:
Figure 5:. 5-ASA treatment restores mitochondrial activity and limits the bioavailability of oxygen in the colon of streptomycin-treated mice on a high-fat diet
Groups of male mice (N = 6) were reared on a high-fat diet (HFD: +) or on a low-fat diet (HFD: −) and were mock treated (Strep: −) or treated with a single dose of streptomycin (Strep: +) four weeks before necropsy. Chow was supplemented with 5-ASA (5-ASA: +) or did not contain supplementation (5-ASA: −). (A-F) Colonocytes were isolated from the colonic mucosa for analysis. Transcript levels of Angptl4 (A), Pgc1a (B) and Sirt3 (C) were determined by quantitative real-time PCR from RNA isolated from colonocytes. Lysates of colonocytes were used to measure concentrations of ATP (D), lactate (E) and pyruvate dehydrogenase activity (PDH) (F). (G) Pimonidazole staining was quantified by scoring blinded sections of proximal colon. (H) Mice were inoculated with a 1:1 mixture of E.coli wild type (wt) and an isogenic respiration-deficient (cydA) mutant and the competitive index (CI) in colon contents was determined 4 weeks later. (A-C) Bars represent geometric mean± standard deviation. (D-H) Dots represent data from individual animals and bars represent geometric mean. *, P<0.05; **, P<0.01; ***, P<0.001; ****, P<0.0001; NS, P>0.05. (A-C, H) Data were transformed logarithmically before analysis. P values were calculated by one-way ANOVA followed by Tukey’s multiple-comparison tests (A-F, H) or by one-tailed non-parametric test (Kruskal Wallis test) followed by Dunn’s multiple-comparison test (G). See also Table S2.
Figure 6:
Figure 6:. 5-ASA treatment abrogates colonic signs of disease in streptomycin-treated mice on a high-fat diet
Groups of male mice (N = 6) were reared on a high-fat diet (HFD: +) or on a low-fat diet (HFD: −) and were mock treated (Strep: −) or treated with a single dose of streptomycin (Strep: +) four weeks before necropsy. Chow was supplemented with 5-ASA (5-ASA: +) or did not contain supplementation (5-ASA: −). (A) The abundance of Clostridia in fecal samples collected was determined by quantitative real-time PCR using class specific primers for the 16S rRNA gene. Mouse body weight (B), visceral fat weight (C) and colon length (D) were determined during necropsy. (E) A veterinary pathologist scored histopathological changes in blinded sections of the cecum. (F) Colonocytes were isolated from the colonic mucosa and transcription levels of Tnfa determined by quantitative real-time PCR. (A and F) Bars represent geometric mean± standard deviation. (B-E) Dots represent data from individual animals and bars represent geometric mean. *, P<0.05; **, P<0.01; ***, P<0.001; ****, P<0.0001. (F) Data were transformed logarithmically before analysis. P values were calculated by one-way ANOVA followed by Tukey’s multiple-comparison tests (A-D, F) or by one-tailed non-parametric test (Kruskal Wallis test) followed by Dunn’s multiple-comparison test (E). See also Table S2.
Figure 7:
Figure 7:. Endogenous Enterobacteriaceae exacerbate signs of disease in streptomycin-treated mice on a high-fat diet
Groups of male Enterobacteriaceae-free mice (N = 6) were reared on a high-fat diet (HFD: +) or on a low-fat diet (HFD: −) and were mock treated (Strep: −) or treated with a single dose of streptomycin (Strep: +) four weeks before necropsy. One day after streptomycin treatment, mice were mock inoculated (Enterobacteriaceae: −) or received commensal isolates of E. coli, K. oxytoca and P. vulgaris (Enterobacteriaceae: +). (A) Colony-forming units (CFU) of Enterobacteriaceae in the feces were determined. (B) Lysates of colonocytes were used to measure concentrations of lactate. (C) Transcript levels of the indicated genes were determined by quantitative real-time PCR in RNA isolated from colonocyte preparations. (D) Colon length was determined during necropsy. (E and F) Transcript levels of Il6 (E), S100a8 and S100a9 (F) were determined by quantitative real-time PCR in RNA isolated from the colonic mucosa. *, P<0.05; **, P<0.01; ***, P<0.001; ****, P<0.0001. (A,C,E,F) Data were transformed logarithmically before analysis. P values were calculated by Student’s t test (A) or by one-way ANOVA followed by Tukey’s multiple-comparison tests (B-F). See also Table S2.

Comment in

References

    1. Abdul Rani R, Raja Ali RA, and Lee YY (2016). Irritable bowel syndrome and inflammatory bowel disease overlap syndrome: pieces of the puzzle are falling into place. Intest Res 14, 297–304. - PMC - PubMed
    1. Ahn BH, Kim HS, Song S, Lee IH, Liu J, Vassilopoulos A, Deng CX, and Finkel T (2008). A role for the mitochondrial deacetylase Sirt3 in regulating energy homeostasis. Proc Natl Acad Sci U S A 105, 14447–14452. - PMC - PubMed
    1. Albenberg LG, Lewis JD, and Wu GD (2012). Food and the gut microbiota in inflammatory bowel diseases: a critical connection. Curr Opin Gastroenterol 28, 314–320. - PMC - PubMed
    1. Banerjee A, Srinivas M, Eyre R, Ellis R, Waugh N, Bardhan KD, and Basumani P (2015). Faecal calprotectin for differentiating between irritable bowel syndrome and inflammatory bowel disease: a useful screen in daily gastroenterology practice. Frontline Gastroenterol 6, 20–26. - PMC - PubMed
    1. Berrill JW, Green JT, Hood K, and Campbell AK (2013). Symptoms of irritable bowel syndrome in patients with inflammatory bowel disease: examining the role of sub-clinical inflammation and the impact on clinical assessment of disease activity. Aliment Pharmacol Ther 38, 44–51. - PubMed

Publication types

MeSH terms