. 2020 Jul 14;53(1):217-232.e5.
doi: 10.1016/j.immuni.2020.06.013.

An Integrated Multi-omic Single-Cell Atlas of Human B Cell Identity

Affiliations

An Integrated Multi-omic Single-Cell Atlas of Human B Cell Identity

David R Glass et al. Immunity. .

Abstract

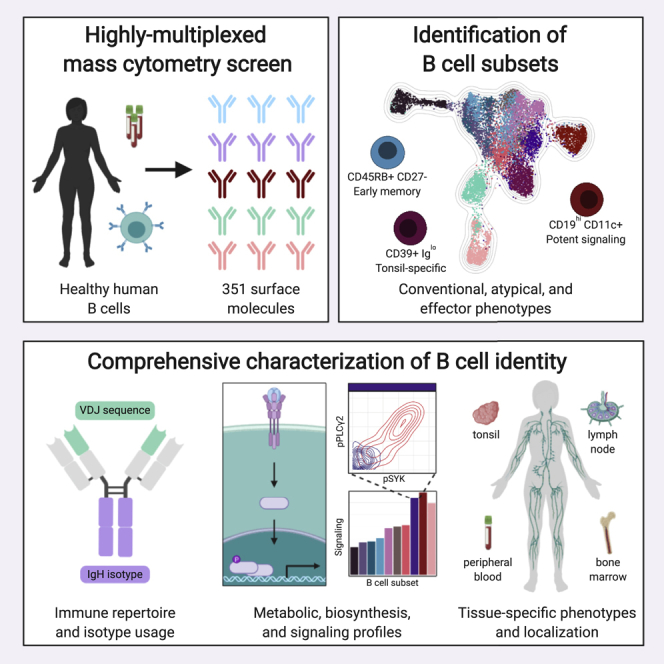
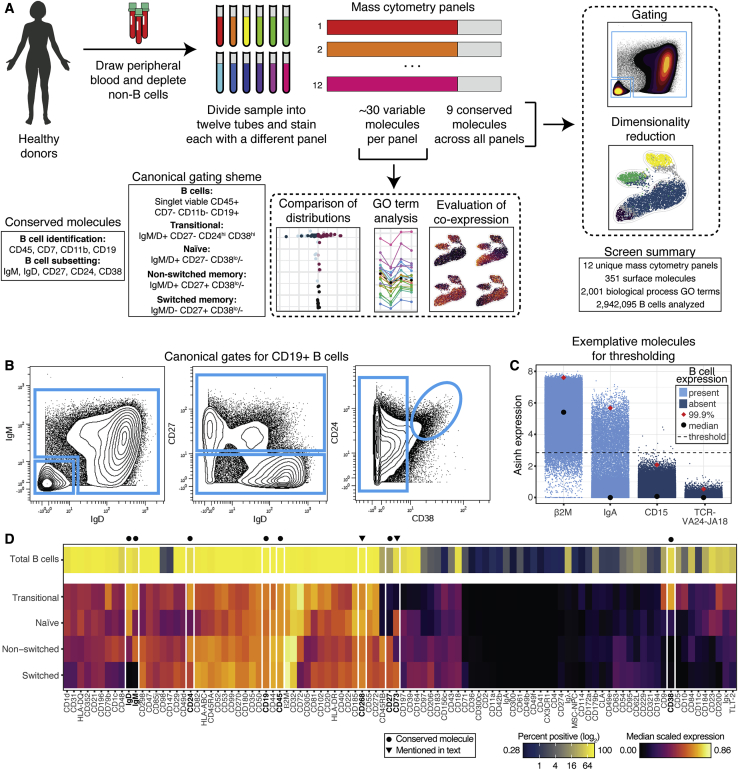
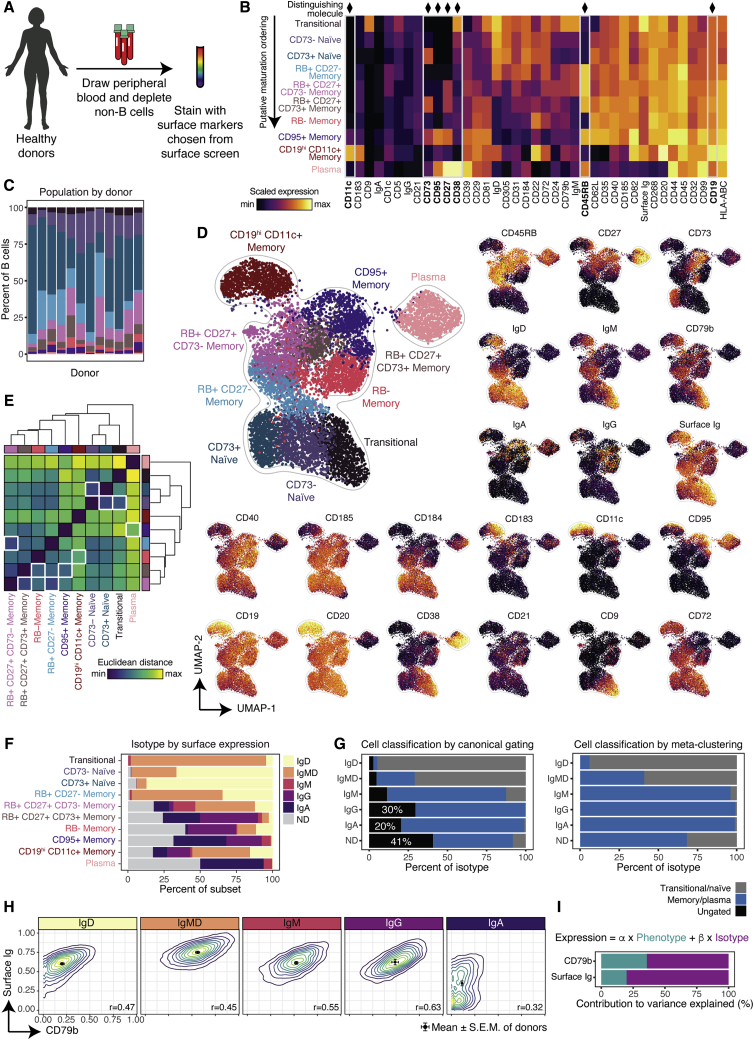
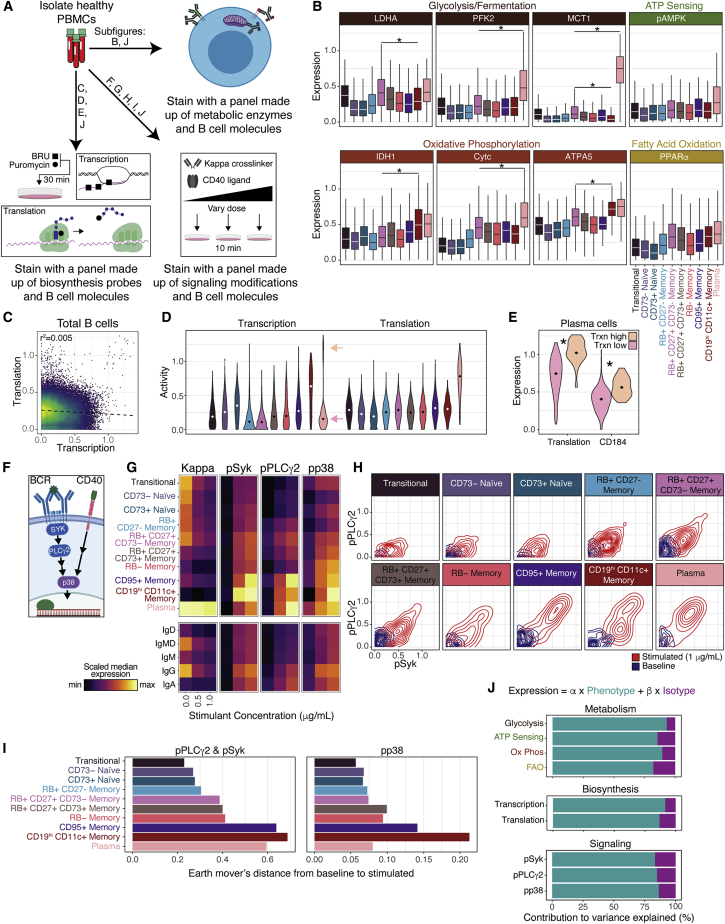
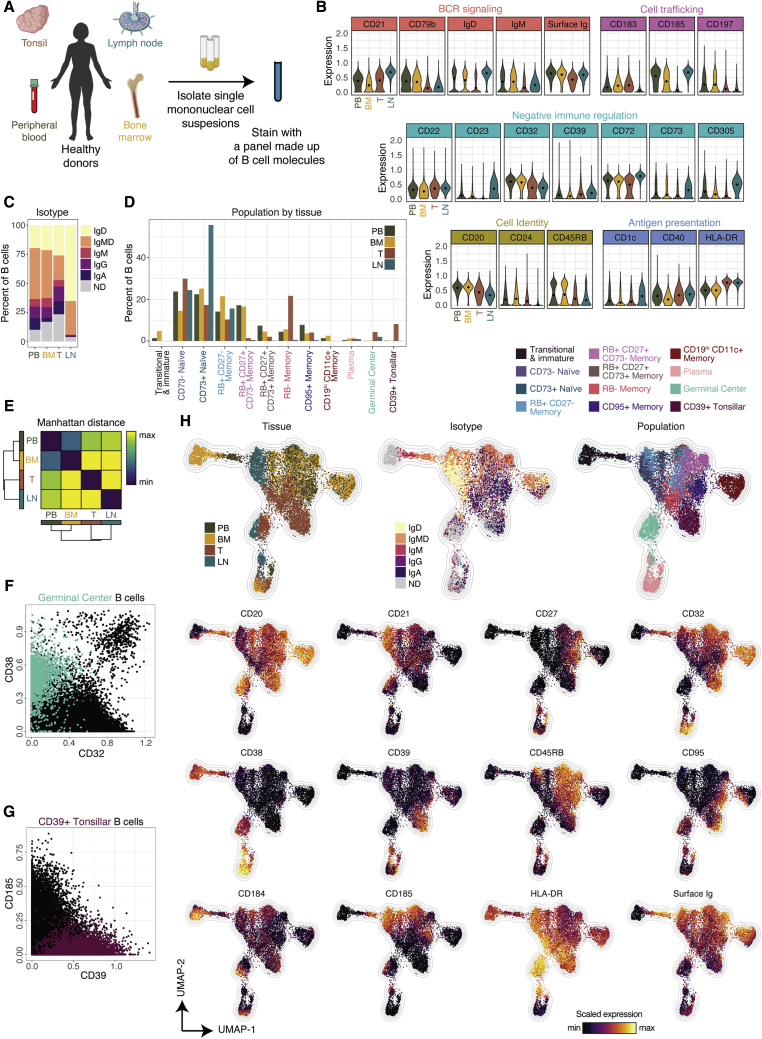
B cells are capable of a wide range of effector functions including antibody secretion, antigen presentation, cytokine production, and generation of immunological memory. A consistent strategy for classifying human B cells by using surface molecules is essential to harness this functional diversity for clinical translation. We developed a highly multiplexed screen to quantify the co-expression of 351 surface molecules on millions of human B cells. We identified differentially expressed molecules and aligned their variance with isotype usage, VDJ sequence, metabolic profile, biosynthesis activity, and signaling response. Based on these analyses, we propose a classification scheme to segregate B cells from four lymphoid tissues into twelve unique subsets, including a CD45RB+CD27- early memory population, a class-switched CD39+ tonsil-resident population, and a CD19hiCD11c+ memory population that potently responds to immune activation. This classification framework and underlying datasets provide a resource for further investigations of human B cell identity and function.

Keywords: B cells; cell atlas; human; mass cytometry; multi-omic; single cell.


Conflict of interest statement

Declaration of Interests The authors declare no competing interests.

Figures

None
Graphical abstract
Figure 1
Figure 1
A highly multiplexed single-cell surface screen reveals the human B cell surface proteome (A) Experimental overview (n = 2 donors). (B) Representative gating of canonical populations. (C) Representative thresholding of positivity for molecules on the screen. (D) Percent positive of total B cells (top row) and median expression by subset (bottom rows) of molecules expressed by B cells.
Figure 2
Figure 2
Differential expression analysis reveals the anergic profile of naive B cells (A) Difference in median expression for each pairwise comparison of subsets. All non-white tiles are significant (p < 0.005). (B) Volcano plots of the comparisons, colored by association with the GO term “transport.” Significantly different molecules listed in boxes are ordered by decreasing magnitude of difference of expression. (C) Median expression of transport molecules (colors). Mean of median expression of all transport molecules (black). (D) Mean of median expression of molecules associated with GO terms (color). Mean of median expression of all molecules (black). (E) Expression of six molecules more highly expressed in naive cells (p < 0.005).
Figure 3
Figure 3
CD45RB marks human memory B cells and identifies an early memory population (A) Computational workflow. (B) UMAP plots of molecules correlated with the conserved molecule in their row. Arrows indicate RB+CD27 cells. (C) UMAP plot colored by subset. (D) Biaxial plot colored by subset. Percent of CD38lo B cells in each quadrant is quantified (red text). (E) Percent of cells in each quadrant from (D). (F) Experimental workflow. (G) Mean IgH mutation frequencies. All pairwise comparisons were significantly different (p < 0.005), except where indicated. (H) Sequence diversity across a range of diversity orders. Shaded regions indicate 95% confidence interval. (I) Computational workflow. (J) Z-scores of frequencies of shared clonality.
Figure 4
Figure 4
Segregating B cells into phenotypically and isotypically distinct subsets (A) Experimental workflow (n = 3 donors). (B) Median expression by subset. (C) Percent of B cells for all subsets, colored as in (B). (D) UMAP plot generated from an equal subsampling by subset. (E) IgH isotype usage by subset. ND denotes “not determined”; IgMD denotes co-expression of IgM and IgD. (F) Euclidean distance between each B cell subset based on median expression profile. White boxes denote column minimum. (G) Subset composition by isotype as determined by canonical gating or meta-clustering. (H) Contour plots by IgH isotype. Dots and error bars indicate mean and SEM of individual donors. (I) Relative contribution of phenotype and isotype to the variance explained by linear models created to predict single-cell expression of CD79b or surface Ig.
Figure 5
Figure 5
Interrogation of B cell subset function reveals differential metabolic, biosynthesis, and immune signaling activity (A) Experimental workflow (n = 9 donors). (B) Expression of metabolic enzymes. Stars indicate significance (p < 0.005). Boxes represent interquartile range (IQR) and whiskers represent IQR +/− 1.5*IQR (C) Biaxial of biosynthesis activity. (D) Violin plots of biosynthesis activity. Bimodality indicated by arrows. (E) Violin plots of significantly differentially expressed molecules (p < 0.005). (F) Signaling diagram. (G) Median expression of Igλ B cells, grouped by phenotype or isotype. (H) Contour plots of signaling molecules. (I) Quantification of earth mover’s distance from baseline samples to stimulated samples (1 μg/mL) for pPLCγ2 and pSyk and pp38. (J) Relative contribution of phenotype and isotype to the variance explained by linear models created to predict single-cell expression of metabolic pathways, biosynthesis activity, or cell signaling.
Figure 6
Figure 6
Characterization of lymphoid tissue-specific B cell populations (A) Experimental workflow (n = 11 donors). (B) Violin plots of molecules significantly differentially expressed by at least two tissues (p < 0.005). (C) IgH isotype usage by tissue. ND denotes “not determined”; IgMD denotes co-expression of IgM and IgD. (D) Subset composition by tissue. (E) Manhattan distance between each tissue based on subset composition. (F) Biaxial of B cells colored as GC or other. (G) Biaxial of B cells colored as CD39+ tonsillar or other. (H) UMAP plot generated from an equal subsampling by tissue, then an equal subsampling by subset.

References

    1. Abdel-Wahab N., Shah M., Suarez-Almazor M.E. Adverse Events Associated with Immune Checkpoint Blockade in Patients with Cancer: A Systematic Review of Case Reports. PLoS ONE. 2016;11:e0160221. - PMC - PubMed
    1. Antonioli L., Pacher P., Vizi E.S., Haskó G. CD39 and CD73 in immunity and inflammation. Trends Mol. Med. 2013;19:355–367. - PMC - PubMed
    1. Becht E., McInnes L., Healy J., Dutertre C.A., Kwok I.W.H., Ng L.G., Ginhoux F., Newell E.W. Dimensionality reduction for visualizing single-cell data using UMAP. Nat. Biotechnol. 2018;37 doi: 10.1038/nbt.4314. - DOI - PubMed
    1. Bendall S.C., Davis K.L., Amir A.D., Tadmor M.D., Simonds E.F., Chen T.J., Shenfeld D.K., Nolan G.P., Pe’er D. Single-cell trajectory detection uncovers progression and regulatory coordination in human B cell development. Cell. 2014;157:714–725. - PMC - PubMed
    1. Boyd S.D., Crowe J.E. Deep sequencing and human antibody repertoire analysis. Current Opinion in Immunology. 2016;40:103–109. - PMC - PubMed

Publication types

MeSH terms