. 2020 Jul 14;32(2):107899.
doi: 10.1016/j.celrep.2020.107899.

Social Behavior Is Modulated by Valence-Encoding mPFC-Amygdala Sub-circuitry

Affiliations

Social Behavior Is Modulated by Valence-Encoding mPFC-Amygdala Sub-circuitry

Wen-Chin Huang et al. Cell Rep. .

Abstract

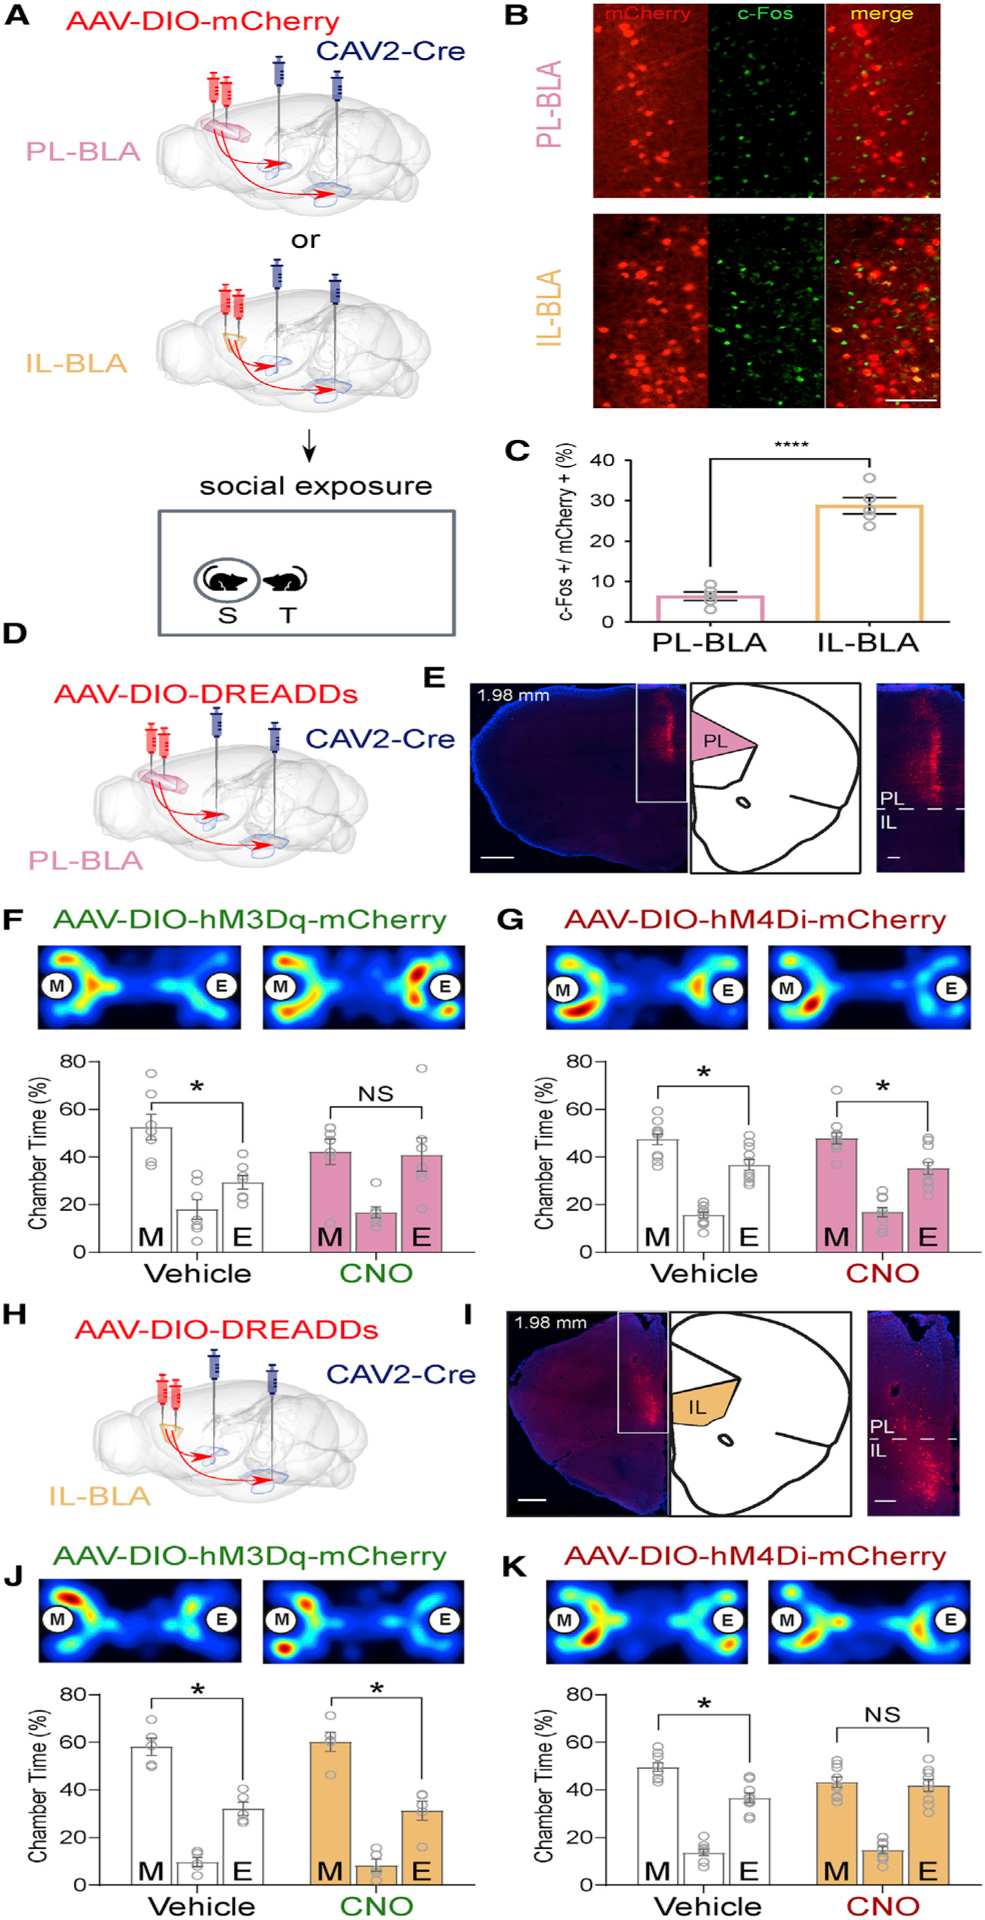
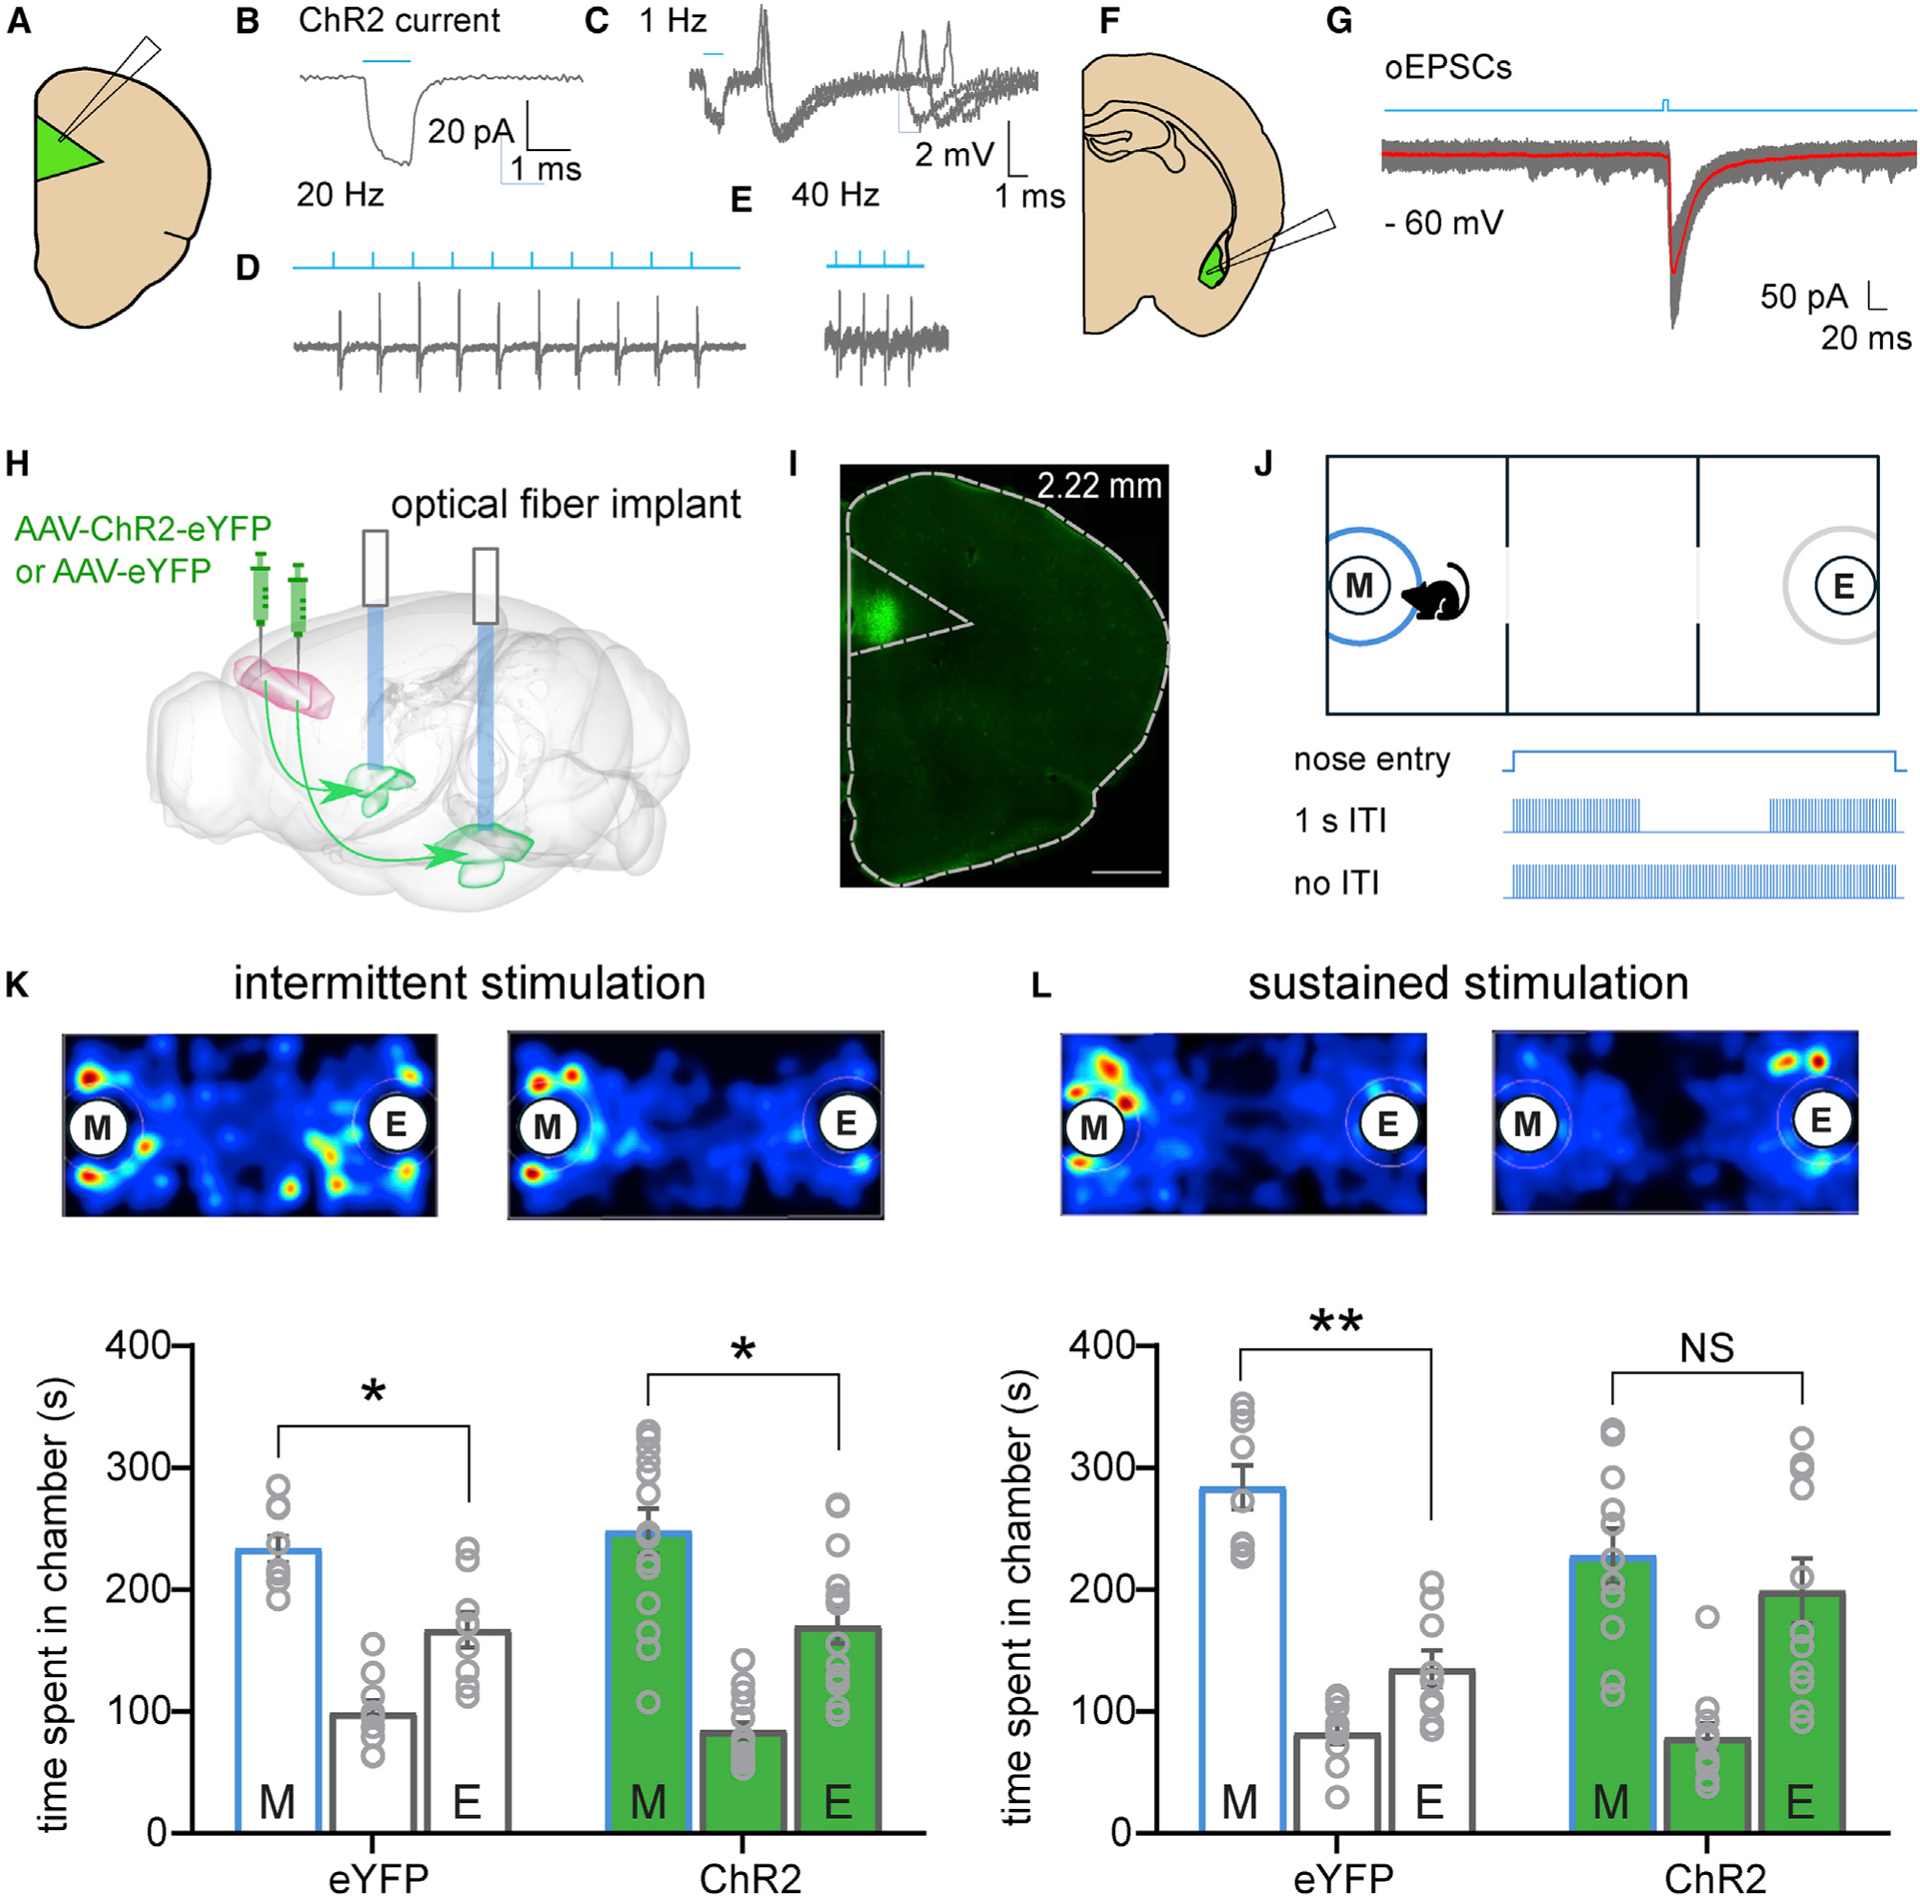
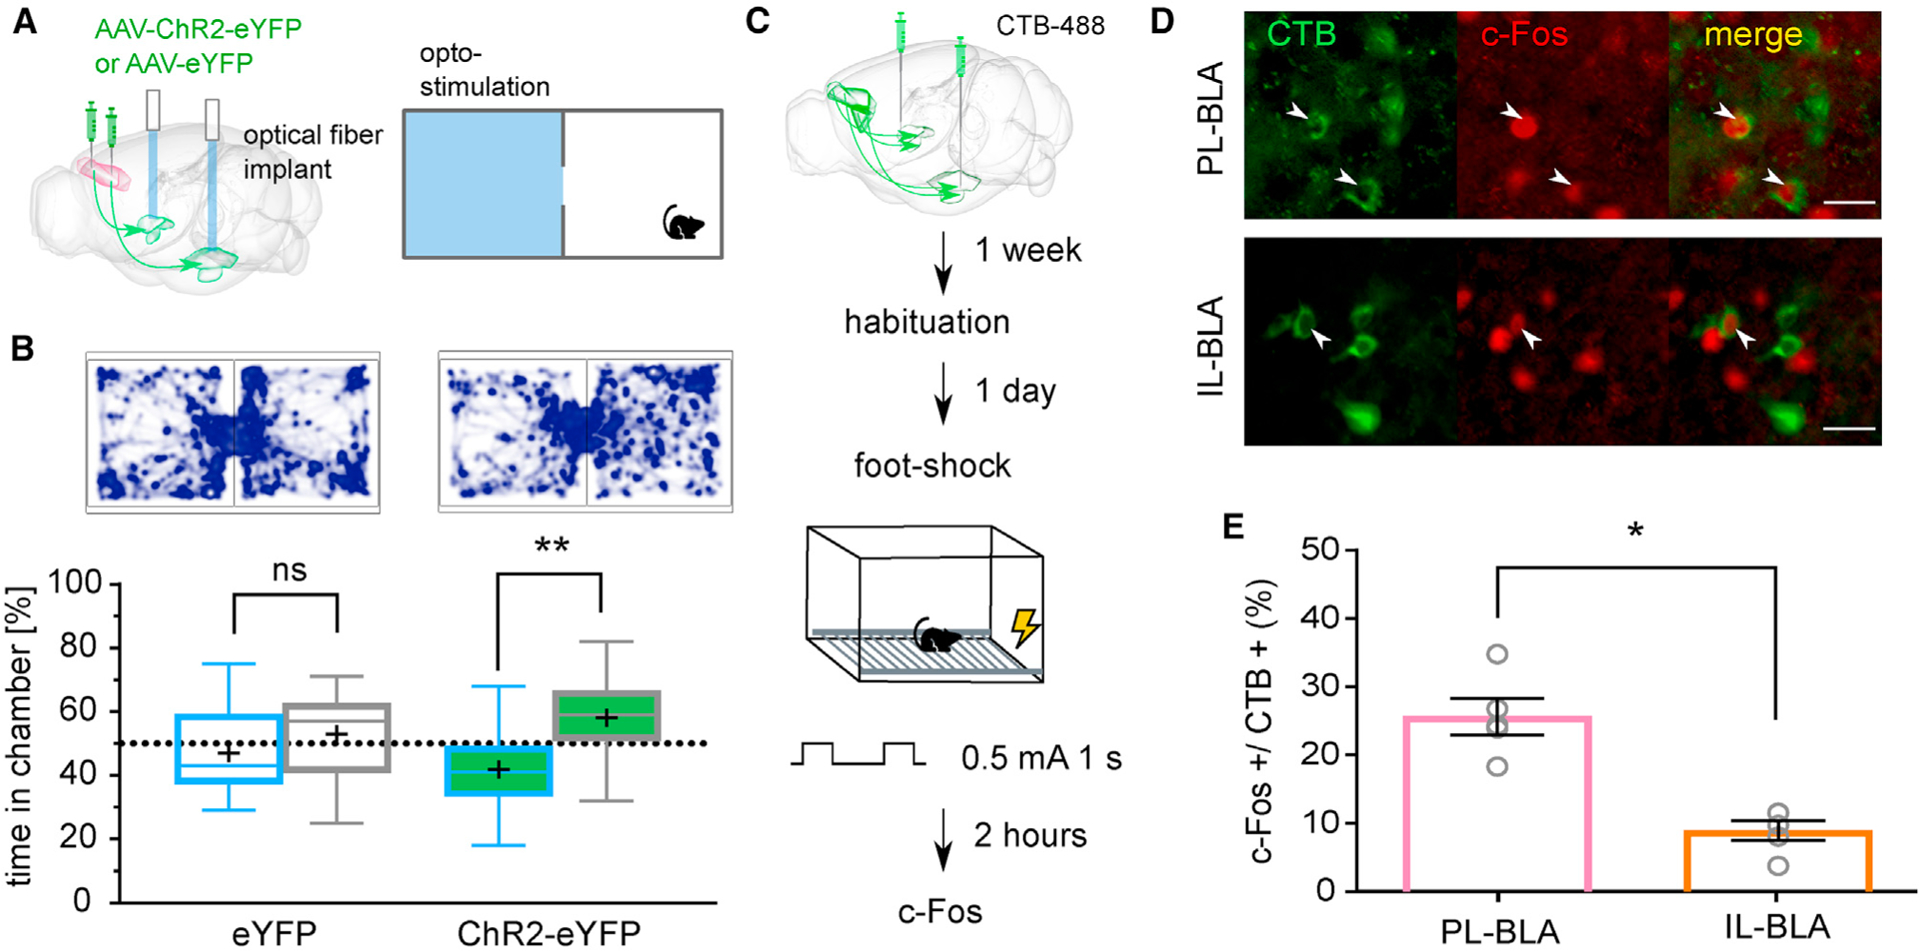
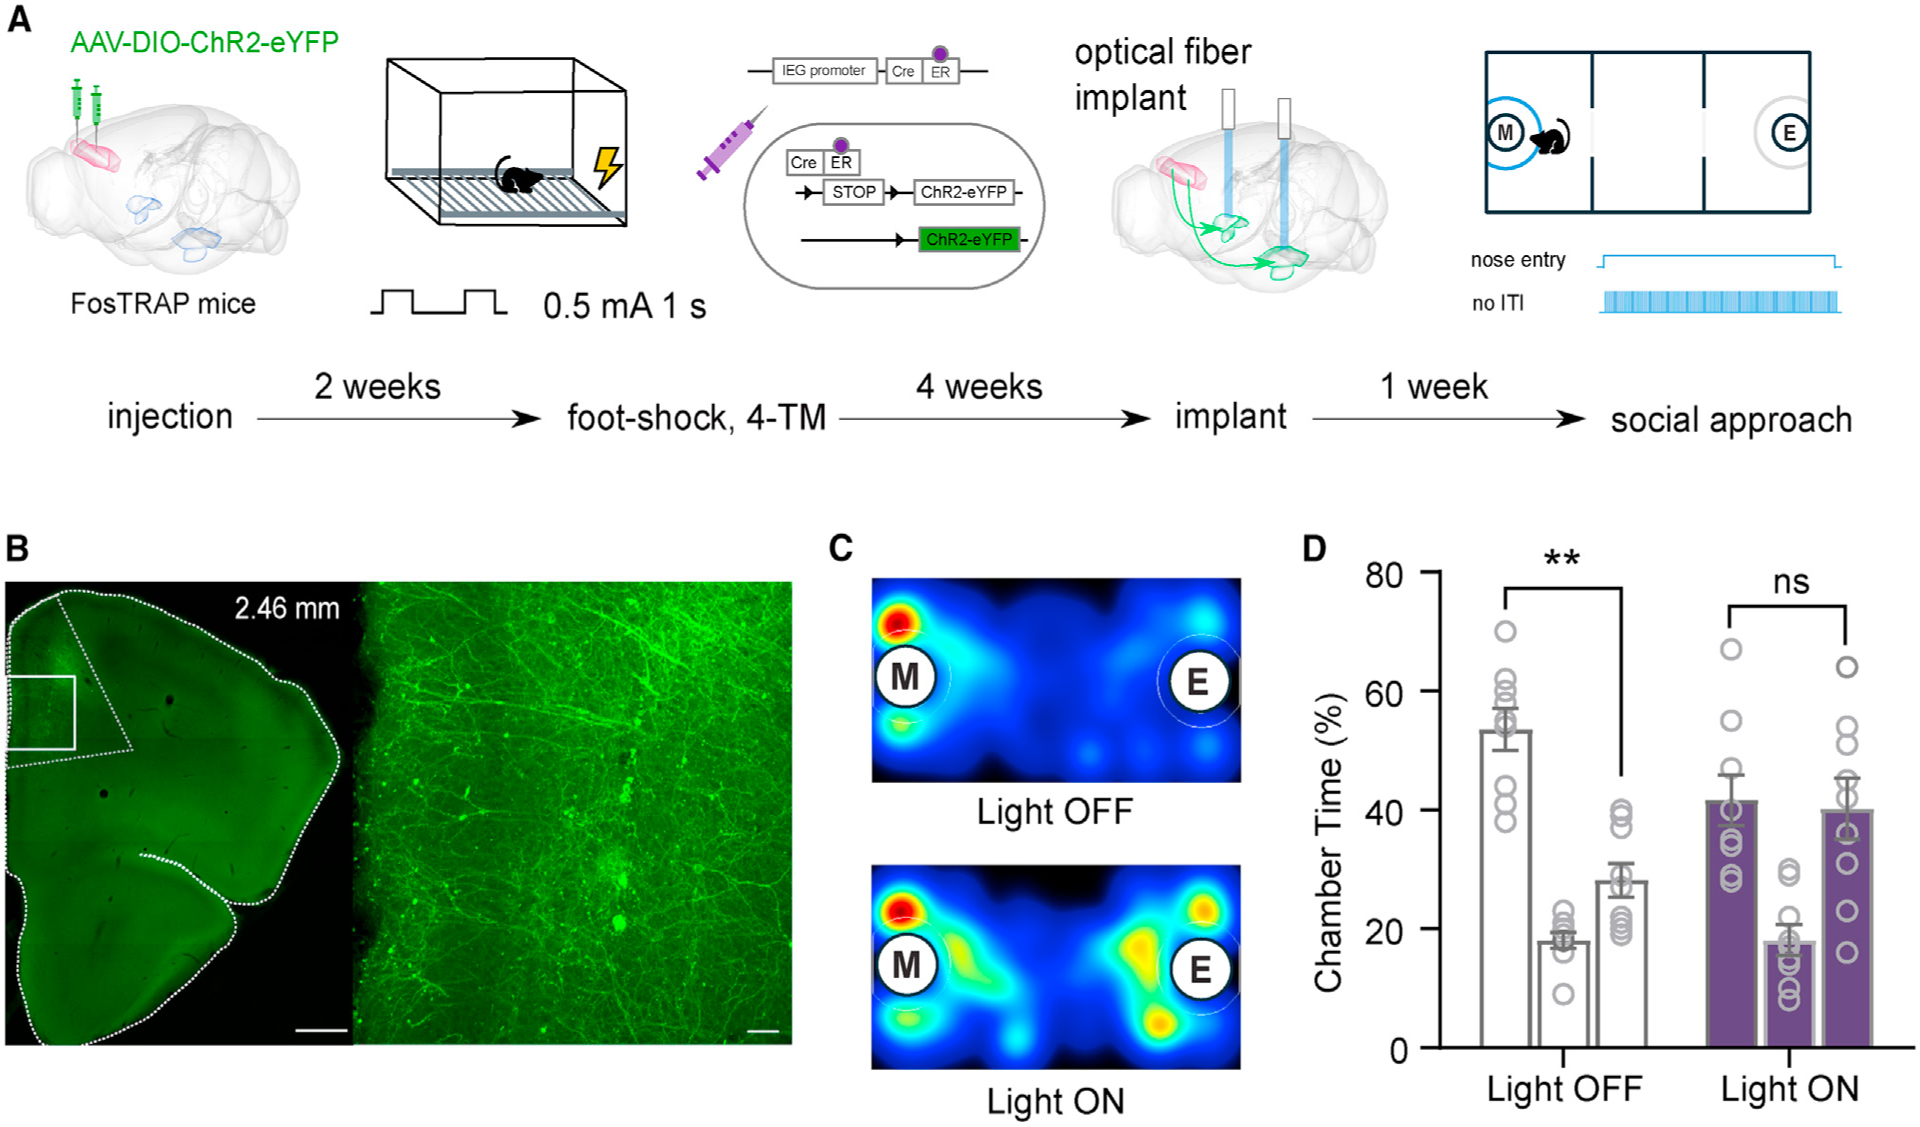
The prefrontal cortex and amygdala are anatomical substrates linked to both social information and emotional valence processing, but it is not known whether sub-circuits in the medial prefrontal cortex (mPFC) that project to the basolateral amygdala (BLA) are recruited and functionally contribute to social approach-avoidance behavior. Using retrograde labeling of mPFC projections to the BLA, we find that BLA-projecting neurons in the infralimbic cortex (IL) are preferentially activated in response to a social cue as compared with BLA-projecting neurons in the prelimbic cortex (PL). Chemogenetic interrogation of these sub-circuits shows that activation of PL-BLA or inhibition of IL-BLA circuits impairs social behavior. Sustained closed-loop optogenetic activation of PL-BLA circuitry induces social impairment, corresponding to a negative emotional state as revealed by real-time place preference behavioral avoidance. Reactivation of foot shock-responsive PL-BLA circuitry impairs social behavior. Altogether, these data suggest a circuit-level mechanism by which valence-encoding mPFC-BLA sub-circuits shape social approach-avoidance behavior.

Keywords: BLA; chemogenetics; emotional valence; infralimbic; mPFC; mPFC-BLA circuitry; optogenetics; prelimbic; social preference.


Conflict of interest statement

Declaration of Interests The authors declare no competing interests.

Figures

Figure 1.
Figure 1.. Infralimbic Cortex-to-Basolateral Amygdala Circuitry Is More Active in Response to Social Cues, and Activation of Prelimbic Cortex or Inhibition of Infralimbic Cortex-to-Basolateral Amygdala Circuitry Impairs Social Behavior
(A) Experimental design for quantification of social exposure-activated neurons in the prelimbic cortex (PL) and infralimbic cortex (IL). (B) Representative images of reporter mCherry (red) and c-Fos (green) double labeling in the PL or IL (yellow). Scale bar: 100 μm. (C) Quantification of c-Fos+ neurons in the mCherry+ neuronal population. n = 5 for PL, n = 5 for IL. (D) Schematic for DREADD activation (AAV-DIO-hM3Dq-mCherry) or inhibition (AAV-DIO-hM4Di-mCherry) of PL-basolateral amygdala (BLA) circuit. (E) Representative image and magnification of white box area of reporter (mCherry) expression in the PL. Scale bars: 500 μm and 100 μm. (F and G) Representative heatmaps and quantification of three-chamber social approach test with PL-BLA DREADDs. n = 7 for hM3Dq (F), n = 11 for hM4Di (G). (H) Schematic for DREADD activation (AAV-DIO-hM3Dq-mCherry) or inhibition (AAV-DIO-hM4Di-mCherry) of IL-BLA circuit. (I) Representative image and magnification of white box area of more than 80% of the reporter (mCherry) expression in the IL. Scale bars: 500 μm and 100 μm. See also Figure S1B for quantification. (J and K) Representative heatmaps and quantification of three-chamber social approach test with IL-BLA DREADDs. n = 5 mice in hM3Dq group (J) and n = 9 mice in hM4Di group (K). The letters M and E inside circles and inside bars indicate a stimulus mouse inside a tube and an empty tube, respectively. For heatmaps, warmer colors denote where the mice spent more time. Groups were compared using independent-samples t tests in (C), and paired-samples t tests were used to compare time spent in the chambers containing a mouse in a tube and an empty tube separately for each group in (F, G, J, and K). Data are represented as mean ± SEM. *p < 0.05 and ****p < 0.0001. See also Figures S1C–S1E for fiuorophore-only control experiments.
Figure 2.
Figure 2.. Temporally Cued Activation of PL-to-BLA Circuitry during Social Investigation Impairs Social Behavior
(A) Cartoon of recording configuration in the PL. (B) Voltage-clamp recording showing depolarized membrane potential during the presence of blue light. (C–E) Blue light-evoked action potentials recorded from putative pyramidal cells at 1 Hz (C), 20 Hz (D), and 40 Hz (E). (F) Cartoon of recording configuration in the BLA. (G) Optically evoked excitatory postsynaptic current (oEPSC) from putative principal neuron. (H) Diagram showing injection of AAV-ChR2-eYFP or control virus AAV-eYFP in the PL and optical fiber ferrule implants targeting the BLA. (I) Epifiuorescence image of injection site confirming transduction in PL. Green is ChR2-eYFP. Scale bar: 500 μm. (J) Schematic of optogenetic three-chamber apparatus. Investigation zone in blue depicts area that triggers light stimulation upon mouse nose entry. (K and L) Representative heatmaps and quantification of time spent in each chamber. (K) Intermittent light stimulation during social investigation did not affect social preference in control or ChR2 groups. n = 9 for control mice and n = 15 for ChR2-expressing mice. (L) Sustained light stimulation during social investigation abolished the social preference in ChR2-expressing mice but not in controls. n = 9 for control mice and n = 11 for ChR2-expressing mice. Paired-samples t tests were used to compare time spent in the chambers containing a mouse in a tube and an empty tube separately for each group in (K) and (L). Data are represented as mean ± SEM. *p < 0.05. See also Figure S2 relating to these experiments.
Figure 3.
Figure 3.. Optogenetic Activation of Negative-Valence PL-to-BLA Circuitry Produce Behavioral Avoidance
(A) Top: cartoon of the two-chamber real-time place preference (RTPP) apparatus where one side (in blue) is paired with optogenetic light stimulation. (B) Representative track map and box (25%, median, 75%) and whisker (maximum, minimum) plot show results for RTPP, where (+) denotes the mean. ChR2-expressing mice spent less time in the light-stimulation paired (blue) than non-stimulated paired chamber, while control mice showed no chamber preference. n = 14 for control mice and n = 21 for ChR2-expressing mice. (C) Diagram of injection to label neurons that project to the BLA and time course of activating negative-valence neurons. (D) Representative images showing CTB-488 expression (green) on the cell membrane and c-Fos (red) staining the nucleus. White arrows indicate double-labeled cells. Scale bar: 25 μm. (E) Quantification of CTB+ cells that are also c-Fos+ in PL and IL. Bar graph is represented as mean ± SEM n = 5 for PL, n = 5 for IL. Paired-samples t test was used to compare between groups. *p < 0.05 and **p < 0.01. See also Figure S3 relating to these experiments.
Figure 4.
Figure 4.. Reactivation of Negative Valence PL-to-BLA Projections Leads to a Social Deficit
(A) Diagram of experimental timeline. Cre-dependent virus was delivered to the PL of FosTRAP mice. Two weeks later, the same mice underwent a foot-shock protocol and immediately were injected with 4-hydroxy-tamoxifen (4-TM) to induce Cre-mediated expression of ChR2. Four weeks later, optical fibers were implanted targeting the BLA. One and 2 weeks afterward, social approach tests took place counterbalanced for control versus light-on conditions. (B) Representative image of the expression of ChR2 through Cre-dependent FosTRAP method. (C) Representative heatmap of control (top) and light-on (bottom) condition of three-chamber social approach assay. (D) Quantification of time spent in each chamber of the three-chamber social approach assay. Paired-samples t tests were used to compare time spent in the chambers containing a mouse in a tube and an empty tube. Data are represented as mean ± SEM. **p < 0.01. See also Figure S4 relating to these experiments.

References

    1. Adhikari A, Lerner TN, Finkelstein J, Pak S, Jennings JH, Davidson TJ, Ferenczi E, Gunaydin LA, Mirzabekov JJ, Ye L, et al. (2015). Basomedial amygdala mediates top-down control of anxiety and fear. Nature 527, 179–185. - PMC - PubMed
    1. Adolphs R (2003). Cognitive neuroscience of human social behaviour. Nat. Rev. Neurosci 4, 165–178. - PubMed
    1. Ashwin C, Baron-Cohen S, Wheelwright S, O’Riordan M, and Bullmore ET (2007). Differential activation of the amygdala and the ‘social brain’ during fearful face-processing in Asperger Syndrome. Neuropsychologia 45, 2–14. - PubMed
    1. Beyeler A, Namburi P, Glober GF, Simonnet C, Calhoon GG, Conyers GF, Luck R, Wildes CP, and Tye KM (2016). Divergent routing of positive and negative information from the amygdala during memory retrieval. Neuron 90, 348–361. - PMC - PubMed
    1. Bicks LK, Koike H, Akbarian S, and Morishita H (2015). Prefrontal cortex and social cognition in mouse and man. Front. Psychol 6, 1805. - PMC - PubMed

Publication types

LinkOut - more resources