. 2020 Jul 13;12(7):1882.
doi: 10.3390/cancers12071882.

CCR2 of Tumor Microenvironmental Cells Is a Relevant Modulator of Glioma Biology

Affiliations

CCR2 of Tumor Microenvironmental Cells Is a Relevant Modulator of Glioma Biology

Matthäus Felsenstein et al. Cancers (Basel). .

Abstract

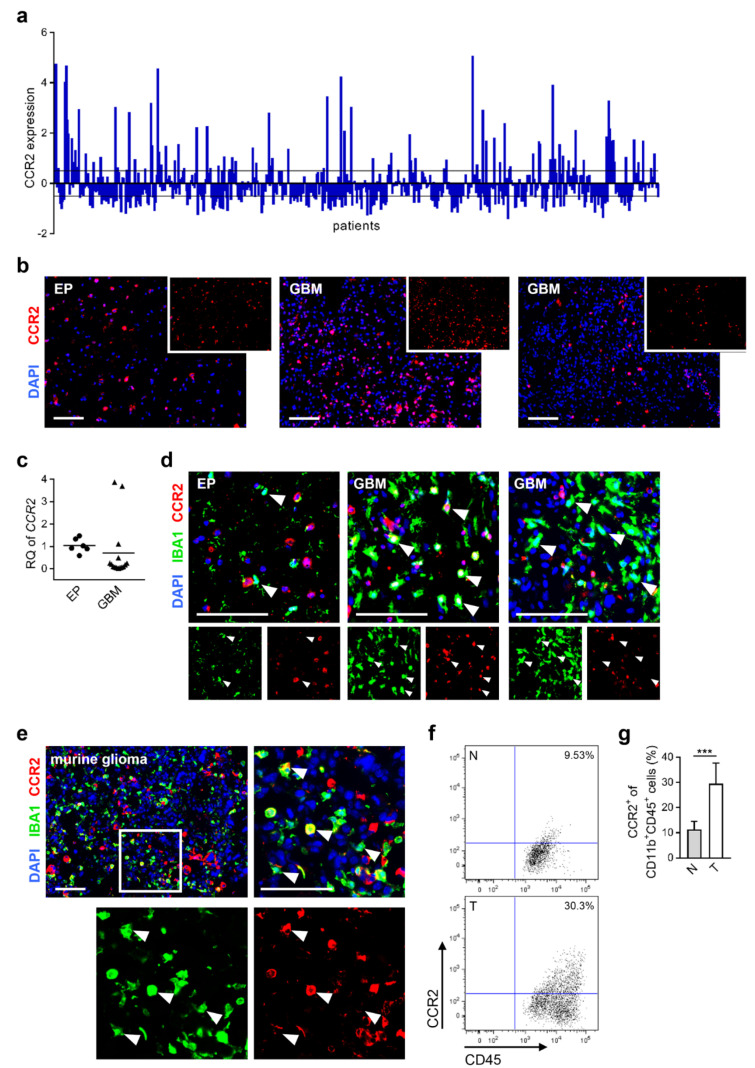
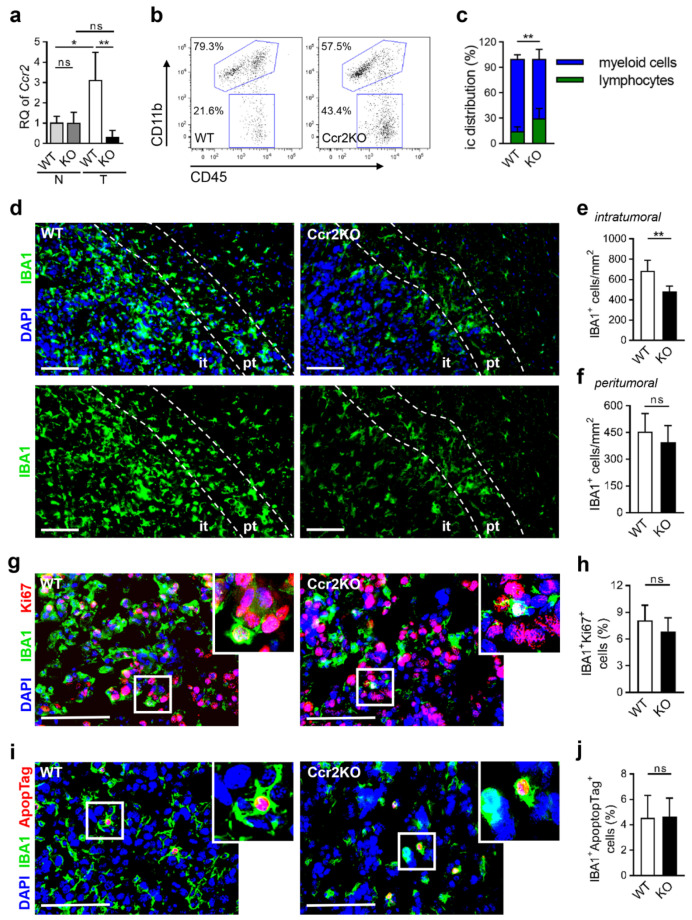
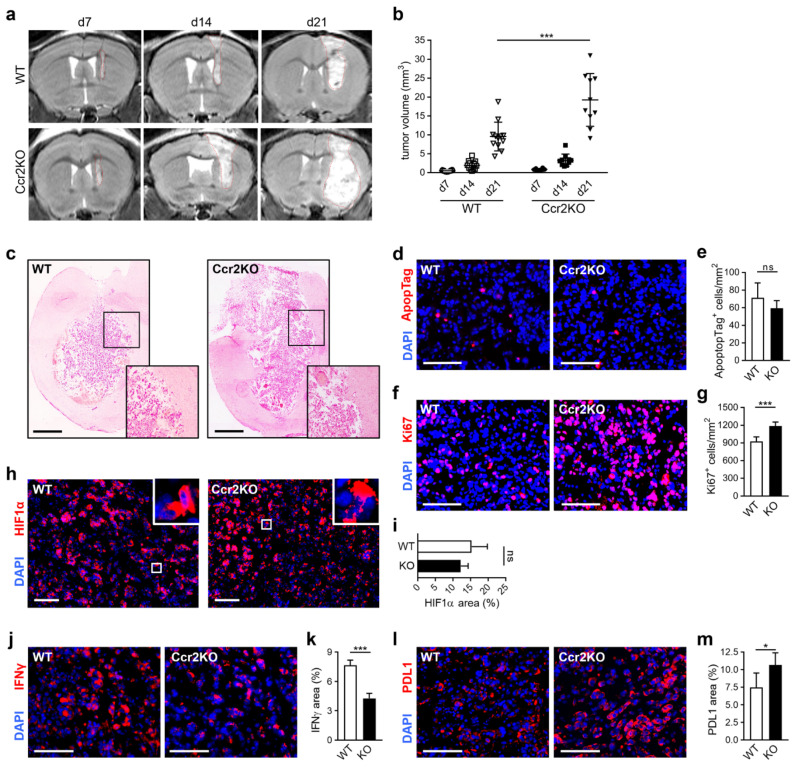
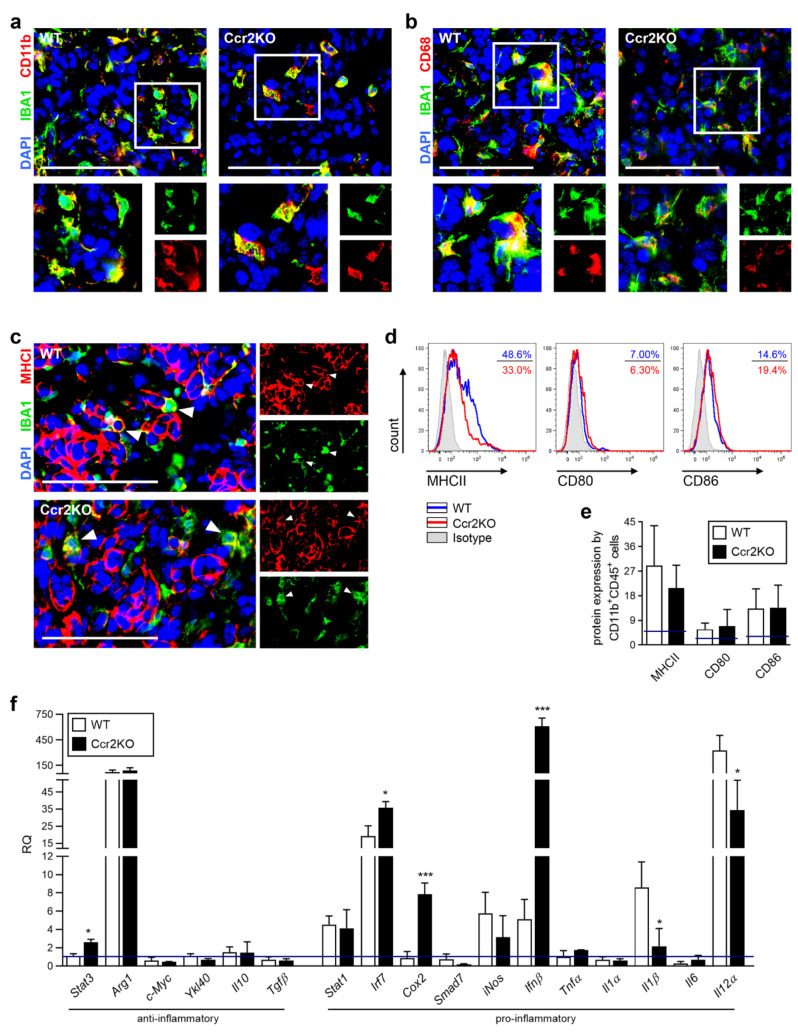
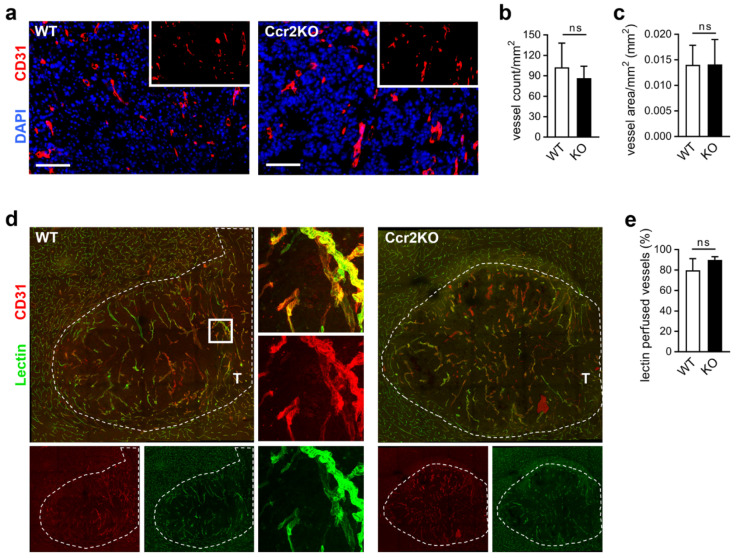
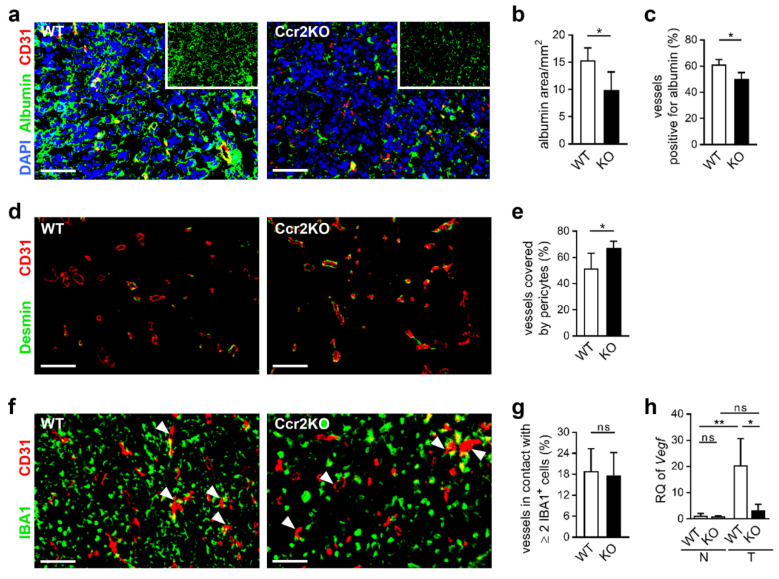
Glioblastoma multiforme (GBM) shows a high influx of tumor-associated macrophages (TAMs). The CCR2/CCL2 pathway is considered a relevant signal for the recruitment of TAMs and has been suggested as a therapeutic target in malignant gliomas. We found that TAMs of human GBM specimens and of a syngeneic glioma model express CCR2 to varying extents. Using a Ccr2-deficient strain for glioma inoculation revealed a 30% reduction of TAMs intratumorally. This diminished immune cell infiltration occurred with augmented tumor volumes likely based on increased cell proliferation. Remaining TAMs in Ccr2-/- mice showed comparable surface marker expression patterns in comparison to wildtype mice, but expression levels of inflammatory transcription factors (Stat3, Irf7, Cox2) and cytokines (Ifnβ, Il1β, Il12α) were considerably affected. Furthermore, we demonstrated an impact on blood vessel integrity, while vascularization of tumors appeared similar between mouse strains. The higher stability and attenuated leakiness of the tumor vasculature imply improved sustenance of glioma tissue in Ccr2-/- mice. Additionally, despite TAMs residing in the perivascular niche in Ccr2-/- mice, their pro-angiogenic activity was reduced by the downregulation of Vegf. In conclusion, lacking CCR2 solely on tumor microenvironmental cells leads to enhanced tumor progression, whereby high numbers of TAMs infiltrate gliomas independently of the CCR2/CCL2 signal.

Keywords: CCR2/CCL2 signaling; GBM; tumor angiogenesis; tumor-associated macrophages (TAMs), blood vessel integrity.


Conflict of interest statement

The authors declare no conflict of interest.

Figures

Figure 1
Figure 1
CCR2 is expressed within human and murine glioma tissues. (a) Expression data of CCR2 from glioblastoma patients were used from TCGA Affymetrix U133A data (528 GBM patient samples). The relative gene expression of each patient is depicted (each column represents one patient). Black lines define the z-score threshold (0.5). (b) Human epilepsy (EP) and GBM brain tissue sections stained for CCR2. Scale bars 100 µm (n = 3–6). (c) Myeloid cells (CD11b+) were isolated from freshly homogenized human brain tissues, and RNA was extracted. Realtime-PCR for CCR2 is presented (n = 6–15). (d) Representative images of frozen human brain sections stained for IBA1 and CCR2 are depicted (arrowheads define IBA1+ cells). Scale bars 100 µm (n = 3–6). (e) Murine brain tumor sections were analyzed for IBA1 and CCR2 on day 21 of glioma growth. A representative image of the intratumoral area is shown (square illustrates magnification of tumor tissue area; arrowheads define IBA1+ cells expressing CCR2). Scale bars 100 µm (n = 3). (f) Murine brain cells were stained with CD11b, CD45, and CCR2 antibodies and analyzed via flow cytometry. Dot plots represent the expression of CCR2 of CD11b+CD45+ myeloid cells within naïve (N) and tumor-bearing (T) brains. (g) Graph depicts percentage of CCR2+ cells within the CD11b+CD45+ cell fraction (n = 10–12). *** p < 0.001 (unpaired Student’s t-test).
Figure 2
Figure 2
IBA1+ cells accumulate less in tumor-bearing Ccr2-deficient mouse brains. (a) RT-PCR for Ccr2 of CD11b+ cells from naïve (N) and tumor-bearing (T; d21) brain tissues of the wildtype (WT), as well as Ccr2KO (KO) mice, is presented (n = 3–4). ** p < 0.01; * p < 0.05; ns, not significant (one-way ANOVA and Bonferroni’s multiple comparison test). (b) Tumor-bearing brains of WT and Ccr2KO mice (d21) were analyzed by flow cytometry. Representative dot plots show gates for TAMs (CD11b+CD45+) and lymphocytes (CC11b-CD45+). (c) The graph depicts the calculation of myeloid cells and lymphocytes (n = 10–11). (d) Tumors of WT and Ccr2KO brains were analyzed via immunofluorescence staining for myeloid cells (IBA1+; d21). Representative images of the tumor border are depicted. Dashed lines define the peritumoral area (pt; 100 µm region from tumor border into normal brain tissues) and surround the intratumoral area (it). Scale bars 100 µm. (e,f) The calculation for the number of IBA1+ cells within the it (e) and pt (f) area are illustrated (n = 6). (g,i) Representative images of immunofluorescence staining for IBA1 and Ki67 (g) or apoptosis (i) in the tumor area of WT and Ccr2KO mice (d21). Squares illustrate magnified areas. Scale bars 100 µm. (h,j) Graphs depict rate of proliferation (h) and calculation of apoptotic IBA1+ cells (j) (n = 6). ** p < 0.01; ns, not significant (unpaired Student’s t-test).
Figure 3
Figure 3
Glioma growth is enhanced in Ccr2-deficient mice. (a) Tumor sizes of gliomas were measured with MRI on day 7, 14, and 21 after inoculation with GL261 cells. Representative MRI images are shown for the WT (upper row) and Ccr2KO (lower row) mice. Red dashed lines define tumor borders. (b) Graph displays calculated tumor volumes (n = 10–12). *** p < 0.001 (one-way ANOVA and Bonferroni’s multiple comparison test). (c) Representative images of hematoxylin-eosin-stained tissue sections of tumor-bearing WT and Ccr2KO brains are shown for day 21 (n = 4–5). Squares indicate magnified regions of the tumor border. Scale bars 1000 µm. (d,f) Apoptosis (d) and proliferation (f) of the intratumoral area (d21) were analyzed by immunofluorescence staining of ApopTag (d) and Ki67 (f). Scale bars 100 µm. (e,g) Graphs depict the amount of apoptotic (e) and proliferative (g) cells within glioma tissues (n = 6). (h) HIF1α was stained to detect hypoxia in tumor tissues (d21). Squares indicate magnified regions. Scale bars 100 µm. (i) Calculation for area of HIF1α expression (n = 5). (jm) Tissues were stained for IFNγ (j) and PDL1 (l). Scale bars 100 µm. Positive areas of IFNγ (k) and PDL1 were calculated (m) (n = 4–5). *** p < 0.001; * p < 0.05; ns, not significant (unpaired Student’s t-test).
Figure 4
Figure 4
Tumor-associated macrophages (TAMs) of WT and Ccr2KO mice carry similar surface markers but show differences in expression of transcription factors as well as cytokines at day 21 of tumor growth. (ac) Representative images of brain tumor sections of WT and Ccr2KO mice stained for IBA1 and CD11b (a) or CD68 (b) or MHCI (c) are depicted (n = 4–5). Squares indicate magnified regions (a,b). Arrowheads define IBA1+ cells expressing MHCI (c). Scale bars 100 µm. (d) Brain tumor suspensions were analyzed by flow cytometry after staining with CD11b, CD45, and MHCII, CD80, or CD86 antibodies. Histograms represent molecule expression of CD11b+CD45+ myeloid cells within WT and Ccr2KO mice including isotype controls. (e) The graph depicts the percentage of molecule expression (n = 6–14). Blue lines define basic molecule expression in naïve mice. (f) RT-PCRs for indicated genes of CD11b+ cells from tumor-bearing brain tissues of WT as well as Ccr2KO mice are presented (n = 3–4). Blue line defines basic molecule expression in naïve WT mice. *** p < 0.001; * p < 0.05 (unpaired Student’s t-test).
Figure 5
Figure 5
Glioma vasculature is unaffected by Ccr2-deficiency. (a) Representative images of brain tumor sections of WT and Ccr2KO mice stained for CD31 are depicted (d21). Scale bars 100 µm. (b,c) Graphs indicate vessel count (b) and vascularized area (c) within the tumor tissues (n = 6). (d) Confocal microscopy of brain tumor sections from mice perfused with FITC-Lectin and stained for CD31 (overview, mosaic). Square indicates the magnified region (63×). T, tumor tissue; dashed line, tumor border. (e) The graph presents the percentage of perfused vessels (n = 3–4). ns, not significant (unpaired Student’s t-test).
Figure 6
Figure 6
Vascular integrity is improved of glioma grown in Ccr2-deficient mice. (a,d,f) Representative images of brain tumor sections of WT and Ccr2KO mice (d21) stained for CD31 and albumin (a), Desmin (d) or IBA1 (f) are depicted. Arrowheads indicate vessels in contact with IBA1+ cells (f). Scale bars 100 µm. (b,c,e,g) Graphs present area of albumin staining (b), vessels colocalized with albumin (c), pericyte-covered vessels (e) and vessels interacting with IBA1+ cells (g). * p < 0.05; ns, not significant (unpaired Student’s t-test). (h) RT-PCR for Vegf of CD11b+ cells (myeloid cells) from naïve (N) and tumor-bearing (T) brain tissues of WT as well as Ccr2KO mice is depicted (d21; n = 3–4). ** p < 0.01; * p < 0.05; ns, not significant (one-way ANOVA and Bonferroni´s multiple comparison test).

References

    1. Louis D.N., Ohgaki H., Wiestler O.D., Cavenee W.K., Burger P.C., Jouvet A., Scheithauer B.W., Kleihues P. The 2007 WHO classification of tumours of the central nervous system. Acta Neuropathol. 2007;114:97–109. doi: 10.1007/s00401-007-0243-4. - DOI - PMC - PubMed
    1. Ohgaki H., Kleihues P. Epidemiology and etiology of gliomas. Acta Neuropathol. 2005;109:93–108. doi: 10.1007/s00401-005-0991-y. - DOI - PubMed
    1. Charles N.A., Holland E.C., Gilbertson R., Glass R., Kettenmann H. The brain tumor microenvironment. Glia. 2011;59:1169–1180. doi: 10.1002/glia.21136. - DOI - PubMed
    1. Roggendorf W., Strupp S., Paulus W. Distribution and characterization of microglia/macrophages in human brain tumors. Acta Neuropathol. 1996;92:288–293. doi: 10.1007/s004010050520. - DOI - PubMed
    1. Watters J.J., Schartner J.M., Badie B. Microglia function in brain tumors. J. Neurosci. Res. 2005;81:447–455. doi: 10.1002/jnr.20485. - DOI - PubMed