. 2021 May;41(5):1145-1161.
doi: 10.1177/0271678X20934071. Epub 2020 Jul 15.

Differential contribution of excitatory and inhibitory neurons in shaping neurovascular coupling in different epileptic neural states

Affiliations

Differential contribution of excitatory and inhibitory neurons in shaping neurovascular coupling in different epileptic neural states

Hyun-Kyoung Lim et al. J Cereb Blood Flow Metab. 2021 May.

Abstract

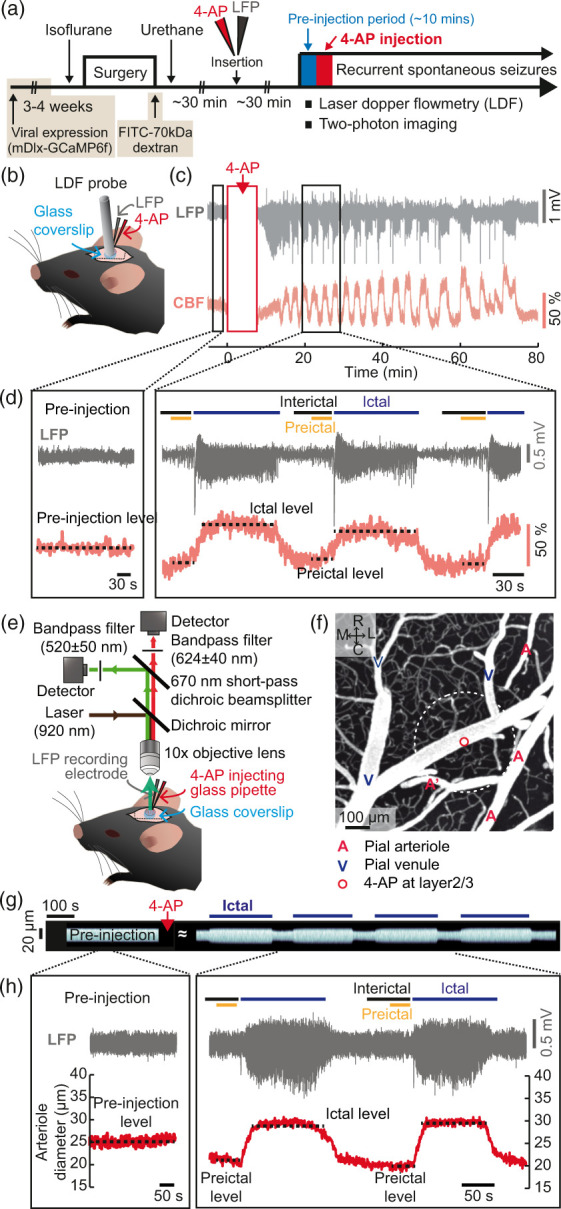
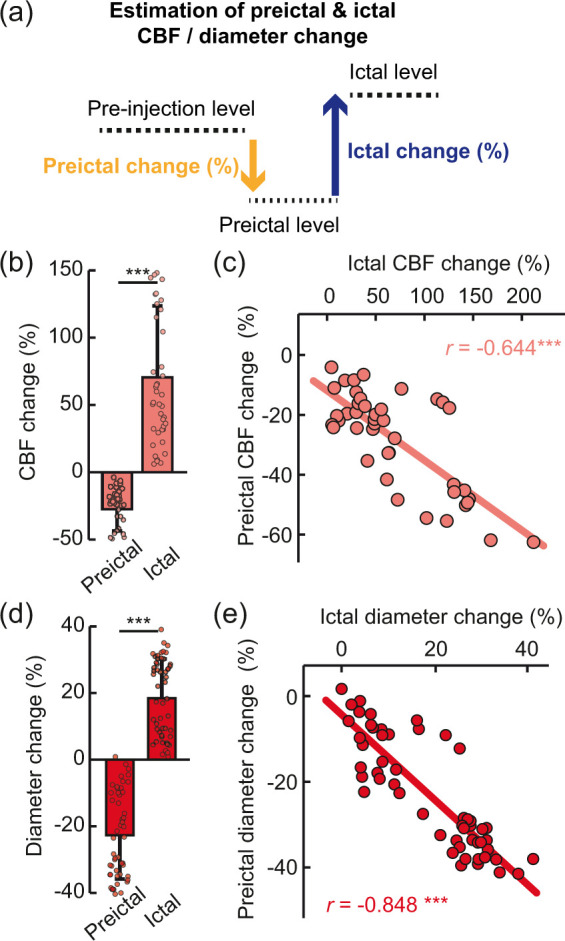
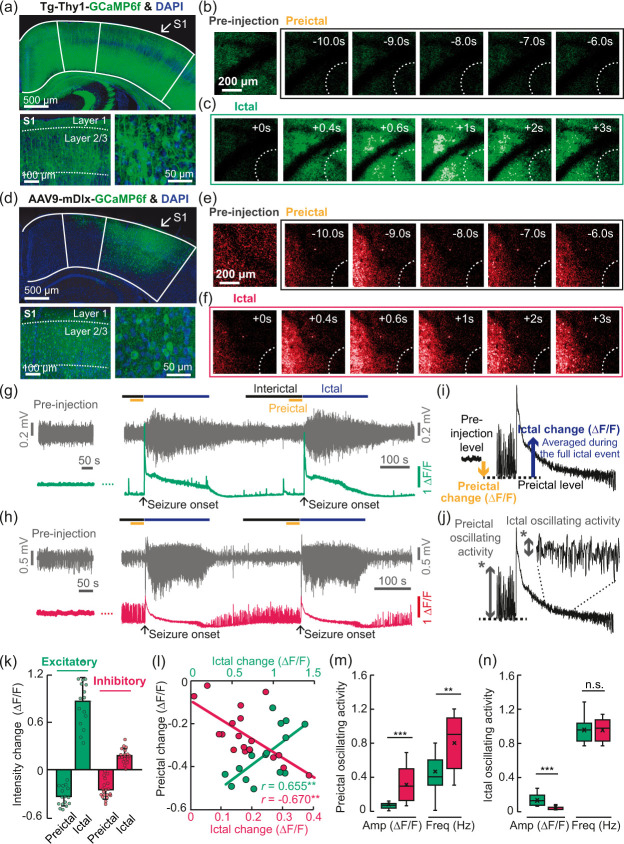
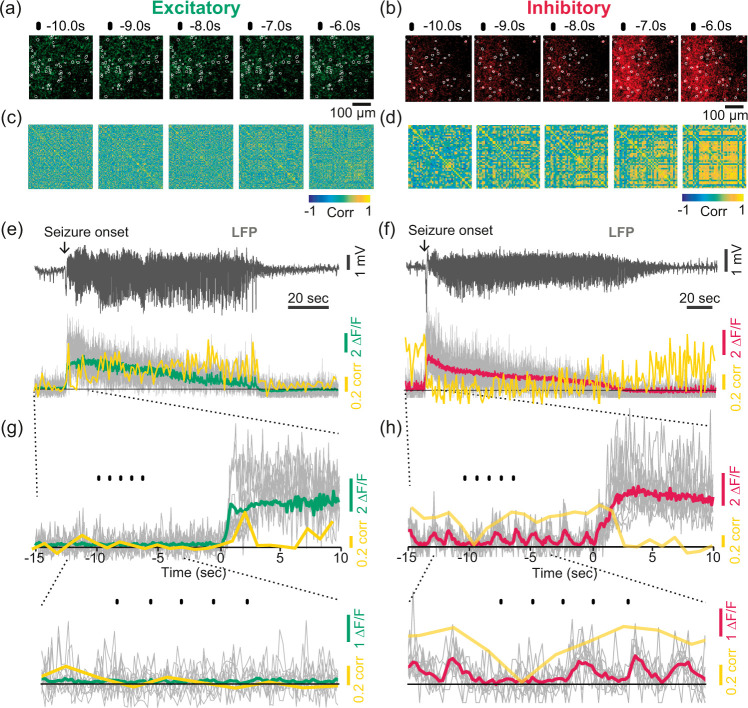
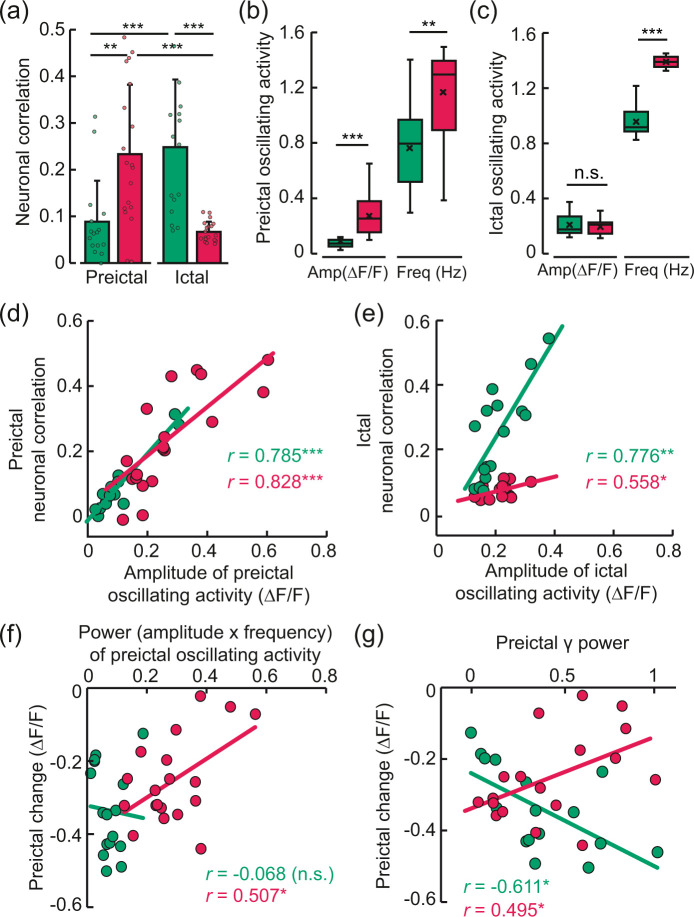
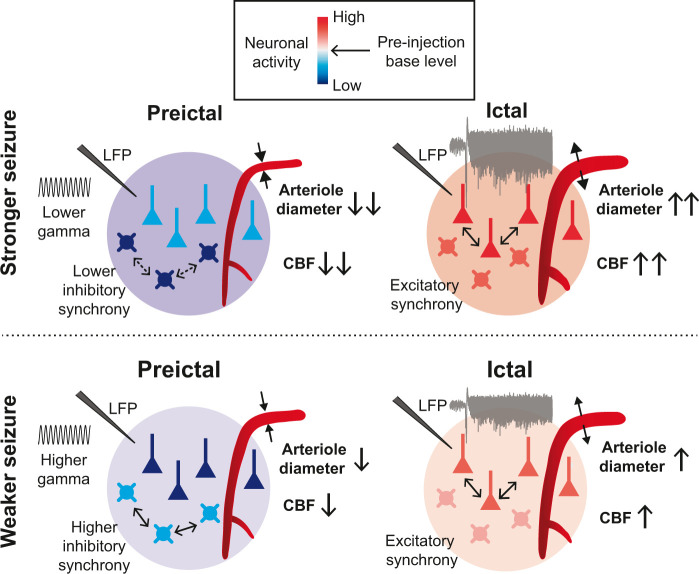
Understanding the neurovascular coupling (NVC) underlying hemodynamic changes in epilepsy is crucial to properly interpreting functional brain imaging signals associated with epileptic events. However, how excitatory and inhibitory neurons affect vascular responses in different epileptic states remains unknown. We conducted real-time in vivo measurements of cerebral blood flow (CBF), vessel diameter, and excitatory and inhibitory neuronal calcium signals during recurrent focal seizures. During preictal states, decreases in CBF and arteriole diameter were closely related to decreased γ-band local field potential (LFP) power, which was linked to relatively elevated excitatory and reduced inhibitory neuronal activity levels. Notably, this preictal condition was followed by a strengthened ictal event. In particular, the preictal inhibitory activity level was positively correlated with coherent oscillating activity specific to inhibitory neurons. In contrast, ictal states were characterized by elevated synchrony in excitatory neurons. Given these findings, we suggest that excitatory and inhibitory neurons differentially contribute to shaping the ictal and preictal neural states, respectively. Moreover, the preictal vascular activity, alongside with the γ-band, may reflect the relative levels of excitatory and inhibitory neuronal activity, and upcoming ictal activity. Our findings provide useful insights into how perfusion signals of different epileptic states are related in terms of NVC.

Keywords: Epilepsy; calcium imaging; cerebral blood flow; excitatory neuron; in vivo two-photon imaging; inhibitory neuron; neurovascular coupling.


Conflict of interest statement

Declaration of conflicting interests: The author(s) declare no potential conflicts of interest with respect to the research, authorship, and/or publication of this article.

Figures

Figure 1.
Figure 1.
Dynamics of CBF and vascular diameter during recurrent spontaneous seizures. (a) Schematic representation of the experimental procedures. Four different sets of experiments were separately conducted in different animal groups: one for LDF recording (wild-type C57BL/6 mice) and the others for two-photon microscopic imaging of cortical pial vessels (wild-type C57BL/6 mice), excitatory (C57BL/6J-Tg-Thy1GCaMP6f5.17) and inhibitory calcium activity assessment (wild-type C57BL/6 mice injected with AAV9-mDlx-GCaMP6f virus, 3–4 weeks prior to the experiment). (b) Schematic of the placement of the LDF recording probe with a glass pipette and an LFP recording probe. (c) Examples of LFP and CBF traces over time showing that seizures repeatedly occurred at intervals of several tens of seconds or several minutes for about an hour. (d) Magnified views of LFP and CBF traces during the pre-injection period and during recurrent seizures (square boxes in (c)). (e) Diagram of the two-photon imaging system. (f) Two-photon z-stack projection image up to ∼100 μm from the pial surface. A: arteriole, V: venule. R: rostral, C: caudal, M: medial and L: lateral. The tip of the glass pipette was located ∼350 μm below the pial surface, which is marked with a white dotted line. (g) Stacks of perpendicular lines over time on one branch point of the pial arteriole indicated as A′ in (f). (h) Example of LFP signals and pial arteriole diameter changes during the pre-injection period and during recurrent seizures.
Figure 2.
Figure 2.
Preictal and ictal changes in CBF and arteriole diameter. (a) Schematic of changes in CBF and vessel diameter during the pre-injection, preictal and ictal periods. To estimate preictal changes (%), each preictal level was normalized by the average pre-injection level. To estimate ictal change, the ictal level was averaged during the full ictal period, and this value was then normalized with the preceding preictal level. (b) Preictal (−27.98 ± 16.18%) and ictal (69.00 ± 52.47%) CBF changes (total number of seizures = 42, n = 5, mean ± SD, ***p <0.001 by Wilcoxon signed-rank test). (c) Relationship of the preictal CBF change with the ictal CBF change (total number of seizures = 42, n = 5, Spearmans r=−0.644, ***p <0.001, R2=0.572). (d) Preictal (−22.71 ± 13.01%) and ictal (18.47 ± 11.65%) arteriole diameter changes (total number of seizures = 53, n = 8, mean±SD, ***p <0.001 by Wilcoxon signed-rank test). (e) Relationship of the preictal arteriole change with the ictal arteriole change (total number of seizures n = 53, n = 8, Spearman’s r=−0.848, ***p <0.001, R2=0.746).
Figure 3.
Figure 3.
In vivo two-photon calcium imaging of excitatory and inhibitory neurons during the pre-injection period and during recurrent spontaneous seizures. (a) Transgenic expression of GCaMP6f under the Thy1 promoter in brain regions including the somatosensory cortex (top) and GCaMP6f expression in layer 2/3 neurons of the somatosensory cortex (bottom, left and right). (b–c) Representative images of spatiotemporal fluorescence changes in excitatory neurons during the pre-injection, preictal and ictal periods. (d) Viral expression of GCaMP6f under the mDlx promoter in the somatosensory cortex (top) and GCaMP6f expression in layer 2/3 neurons of the mouse somatosensory cortex (bottom, left and right). (e–f) Representative images of spatiotemporal fluorescence changes in excitatory and inhibitory neurons during the pre-injection, preictal and ictal periods. (g,h) Examples of LFP signals and GCaMP6f intensity changes (averaged from all the pixels within a range of 200–700 μm from the location of a glass pipette tip) in excitatory (green) and inhibitory (red) neurons. (i,j) Schematic explanation of the calculation of preictal and ictal changes in the GCaMP6f signals. (k) Bar plot of the preictal fluorescence intensity changes in the preictal period (excitatory: −0.34 ± 0.12 ΔF/F, mean ± SD; inhibitory: −0.25 ± 0.12 ΔF/F, mean ± SD) and ictal period (excitatory: 0.87 ± 0.30 ΔF/F, mean ± SD; inhibitory: 0.18 ± 0.09 ΔF/F, mean ± SD). Excitatory: total number of seizures = 16, n = 5; inhibitory: total number of seizures = 19, n = 4. (l) Relationships between preictal basal excitatory and inhibitory activity levels and the following ictal changes (excitatory: Pearsons r =0.655, **p =0.008, R2=0.428; inhibitory: Pearsons, r=−0.670, **p =0.002, R2=0.448. (m,n) Box-whisker diagrams of the amplitudes (Amp) and frequencies (Freq) of the preictal and ictal oscillating activity. Preictal, amplitude, ***p <0.01 by Mann-Whitney U test; preictal, frequency, **p <0.001 by independent t-test; ictal, amplitude: ***p <0.001 by independent t-test; ictal, frequency: n.s. (no statistical significance) by independent t-test.
Figure 4.
Figure 4.
Neuronal synchrony of excitatory and inhibitory activity. (a, b) Examples of magnified images showing spatiotemporal activity of excitatory and inhibitory neurons overlaid with the registered neuron ROIs (white contours) for 10.0–6.0 s prior to the seizure onset shown in (e–f). (c, d) Example correlation matrices showing the Pearsons correlation coefficients of all registered neuron ROIs (excitatory: 118 cells, inhibitory: 52 cells) in the same seizure trial shown in (a) and (b). The scale bar indicates the coefficient value between −1 and 1. (e–f) Examples of LFPs and the associated excitatory/inhibitory activity (green or red) overlaid with the correlation coefficients over time (yellow). The correlation values were calculated by averaging the values from all individual pairs of neuron ROIs (cell soma within the range of 200–700 μm range), over time (window: 1 s, step:1 s). The gray lines indicate individual traces of 10 neuron ROIs that were randomly chosen within the range. (g–h) Magnified traces. The yellow line shows the correlation coefficient values calculated in every 1 s window. The black dots above the traces indicate the same time points shown in (a, c) and (b, d).
Figure 5.
Figure 5.
Preictal and ictal neuronal synchrony and their relationships with oscillating activity. (a) Correlation coefficients between all pairs of registered neuron ROIs (cell soma within the range of 200–700 μm) during the preictal and ictal periods. Preictal, excitatory: 0.09 ± 0.09; preictal, inhibitory: 0.23 ± 0.15; ictal, excitatory: 0.25 ± 0.14; ictal, inhibitory: 0.07 ± 0.02 (mean ± SD; preictal excitatory & inhibitory, **p =0.001 by Mann-Whitney U test; ictal excitatory & inhibitory, ***p <0.001 by independent t-test; excitatory preictal & ictal, ***p <0.001 by Wilcoxon signed-rank test; inhibitory preictal & ictal, ***p <0.001 by paired t-test). Excitatory: total number of seizures = 16, n = 5, total number of cells = 2345, average number of cells in each seizure trial = 146.56 ± 23.75. Inhibitory: total number of seizures = 19, n = 4, total number of cells = 1070, average number of cells in each seizure trial = 48.64 ± 18.94. (b, c) Box-whisker diagrams of the amplitudes (ΔF/F) and frequencies (Hz) of preictal and ictal oscillating activity in excitatory and inhibitory neurons. The boxes represent the 25th–75th percentiles, and the horizontal lines inside the boxes display the median amplitudes (assessed by Mann-Whitney U test) and frequencies (**p <0.001, ***p <0.001, by Mann-Whitney U test; n.s. indicates no statistical significance). (d, e) Relationships between the correlation coefficients (neuronal correlation) and the amplitudes of the oscillating activity during the preictal (excitatory: Spearman’s r = 0.785, ***p <0.001, R2=0.915; inhibitory: Spearman’s r = 0.828, ***p <0.001, R2=0.603) and ictal (excitatory: Spearman’s r =0.776, **p =0.001, R2=0.626; inhibitory: Pearson’s r =0.558, *p =0.013, R2=0.311) states. (f) Relationship of the preictal basal level (shown in Figure 3(k) and (l)) with the power (amplitude x frequency) of the preictal oscillating activity (excitatory: Pearson’s r= −0.068, n.s., R2=0.005; inhibitory: Pearson’s r= 0.507, *p =0.027, R2=0.258). (g) Relationship between the preictal basal level and the normalized preictal LFP γ power, in excitatory (Pearson’s r=−0.611, *p =0.01, R2=0.374) and inhibitory neurons (Pearson’s r =0.495, *p =0.03, R2=0.245).
Figure 6.
Figure 6.
Schematic summary showing the relationships between neuronal activity and vascular activity, within and between the preictal and ictal states. Basal CBF, arteriole diameter, and excitatory and inhibitory neuronal activity are altered during the preictal state and are differently correlated with LFP γ-band activity. A lower γ-band during the preictal state is associated with greater reductions in the basal arteriole diameter and the basal inhibitory activity, which are related to lower oscillating and synchronized inhibitory activity. On the other hand, during the preictal state, excitatory oscillating activity is not apparent, and the basal excitatory activity is less reduced. In these cases, the following ictal magnitude is greater, and the ictal state is characterized by higher synchronized activity of excitatory neurons.

References

    1. Yoo RE, Yun TJ, Yoon BW, et al.. Identification of cerebral perfusion using arterial spin labeling in patients with seizures in acute settings. PLoS One 2017; 12: e0173538. - PMC - PubMed
    1. Oishi M, Ishida G, Morii K, et al.. Ictal focal hyperperfusion demonstrated by arterial spin-labeling perfusion MRI in partial epilepsy status. Neuroradiology 2012; 54: 653–656. - PubMed
    1. Toledo M, Munuera J, Salas-Puig X, et al.. Localisation value of ictal arterial spin-labelled sequences in partial seizures. Epileptic Disord 2011; 13: 336–339. - PubMed
    1. Kim S, Mountz JM.SPECT imaging of epilepsy: an overview and comparison with F-18 FDG PET. Int J Mol Imag 2011; 2011: 813028. - PMC - PubMed
    1. Pizzini F, Farace P, Zanoni T, et al.. Pulsed-arterial-spin-labeling perfusion 3T MRI following single seizure: a first case report study. Epilepsy Res 2008; 81: 225–227. - PubMed

Publication types

MeSH terms