Observational Study
. 2020 Sep 4;369(6508):eabc8511.
doi: 10.1126/science.abc8511. Epub 2020 Jul 15.

Deep immune profiling of COVID-19 patients reveals distinct immunotypes with therapeutic implications

Collaborators, Affiliations
Observational Study

Deep immune profiling of COVID-19 patients reveals distinct immunotypes with therapeutic implications

Divij Mathew et al. Science. .

Abstract

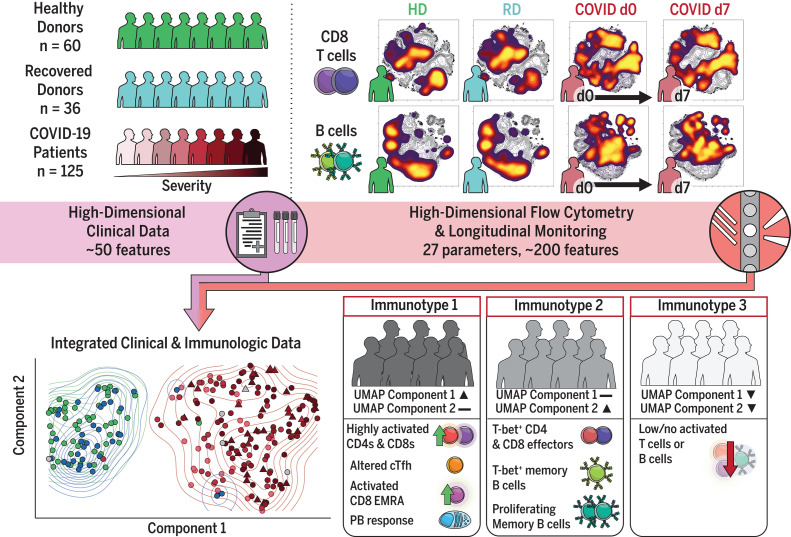
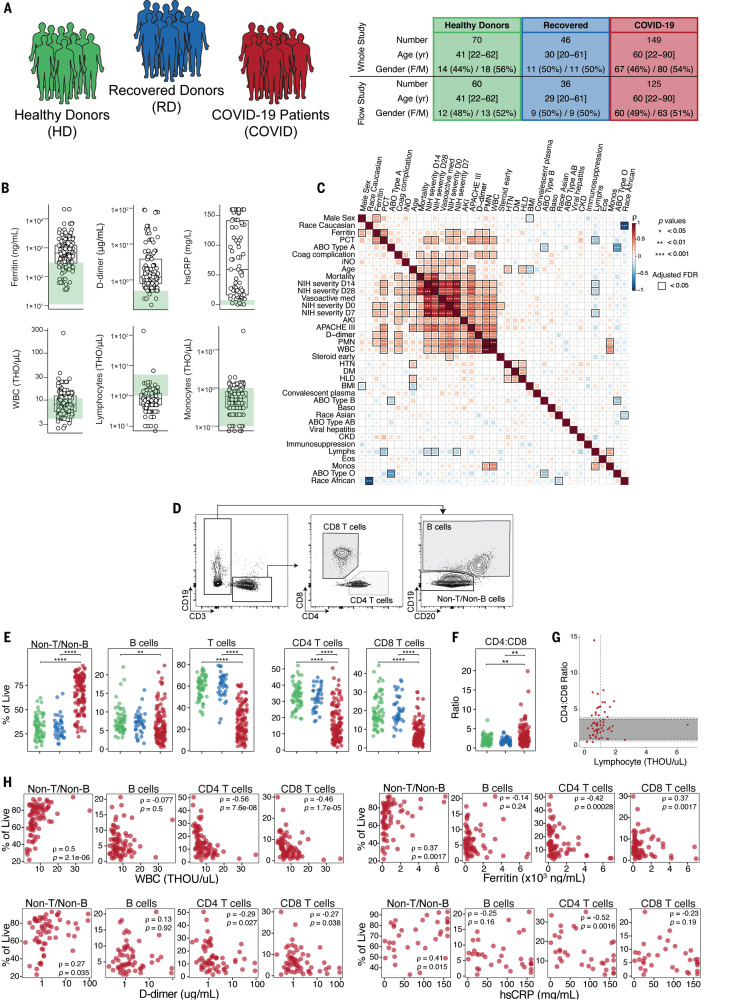
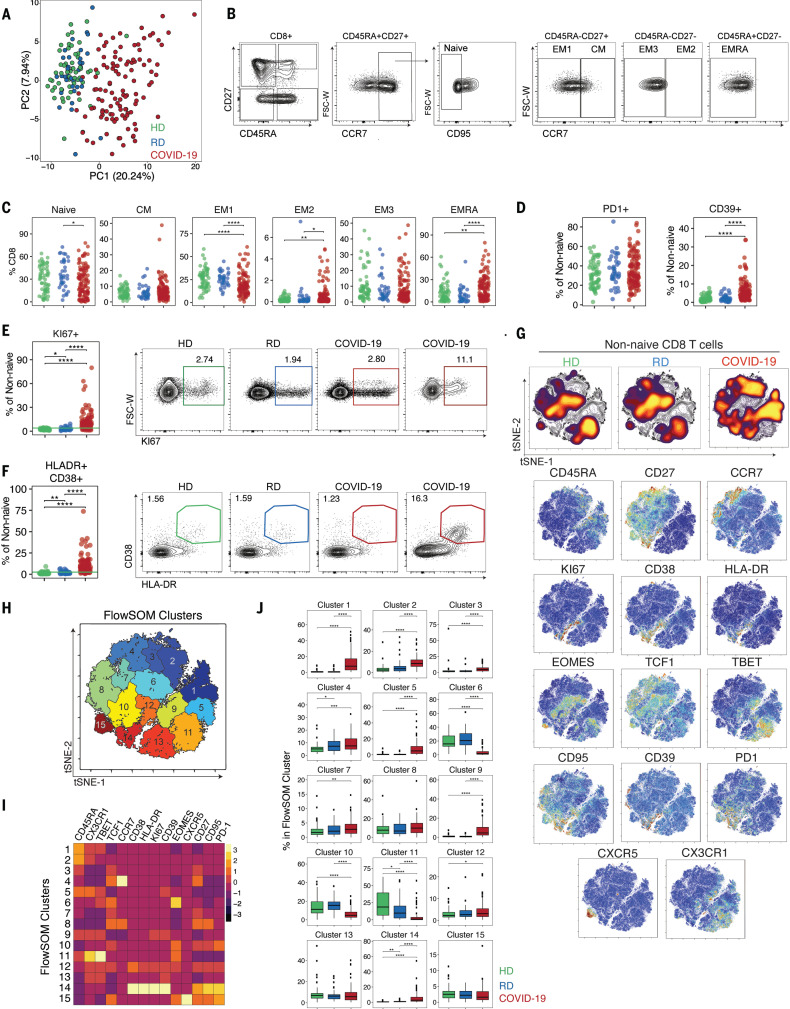
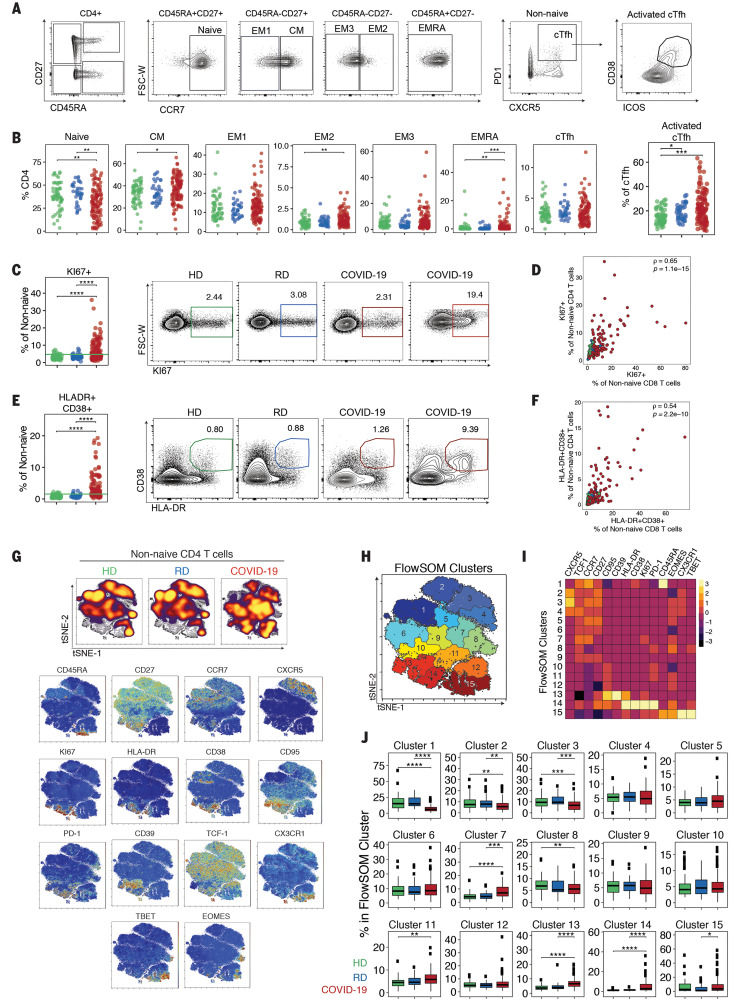
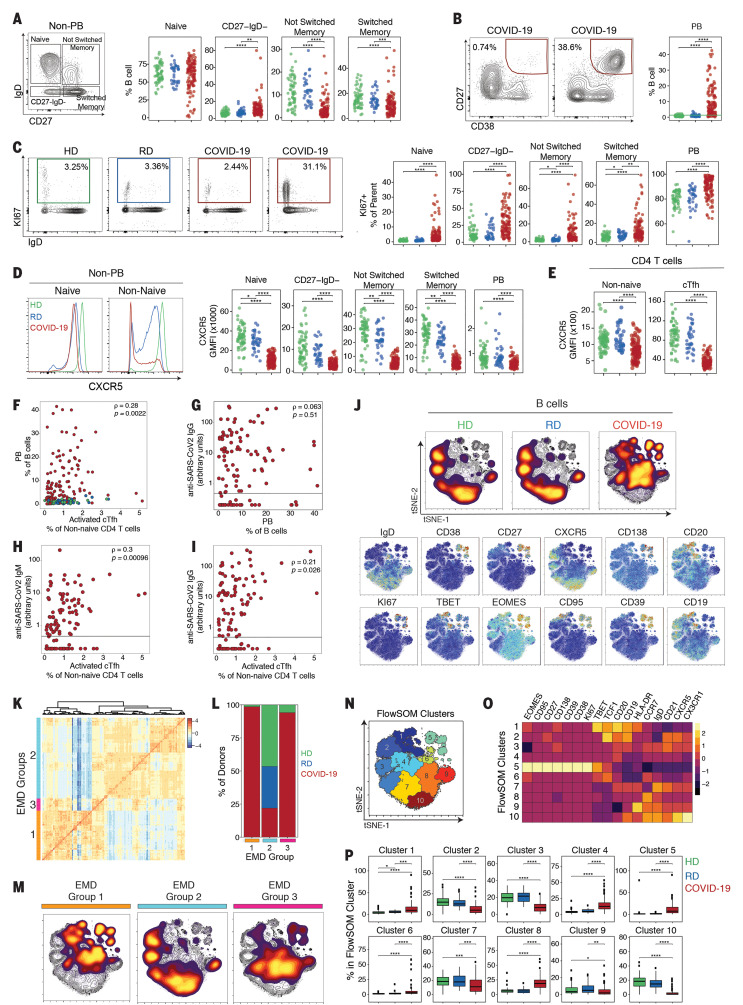
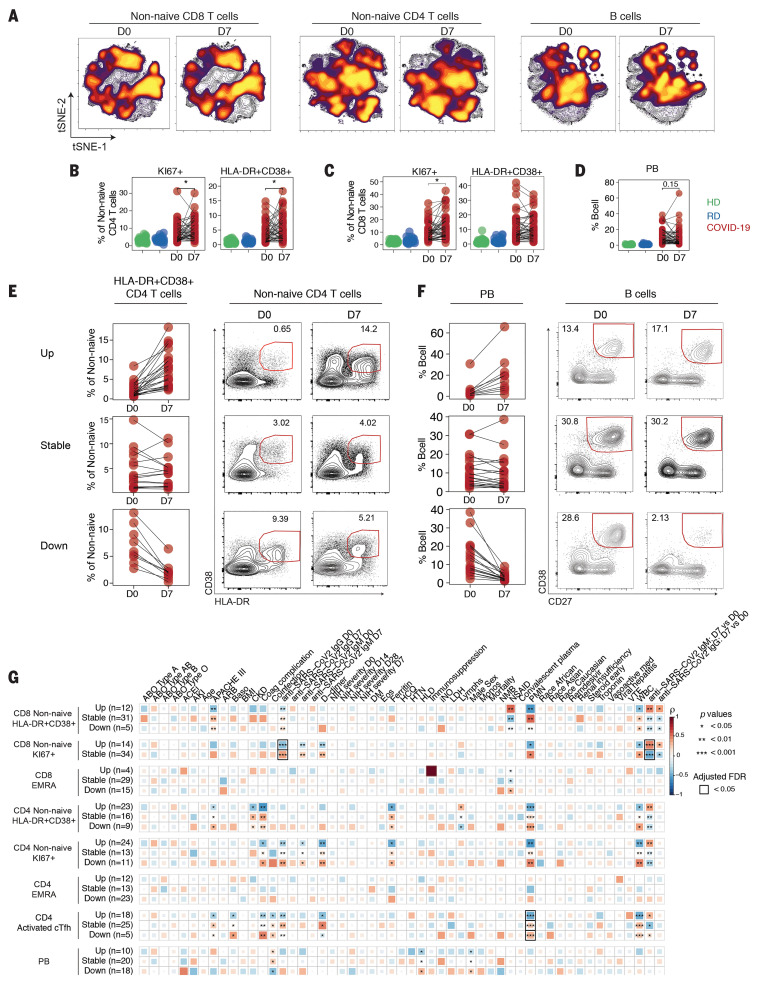
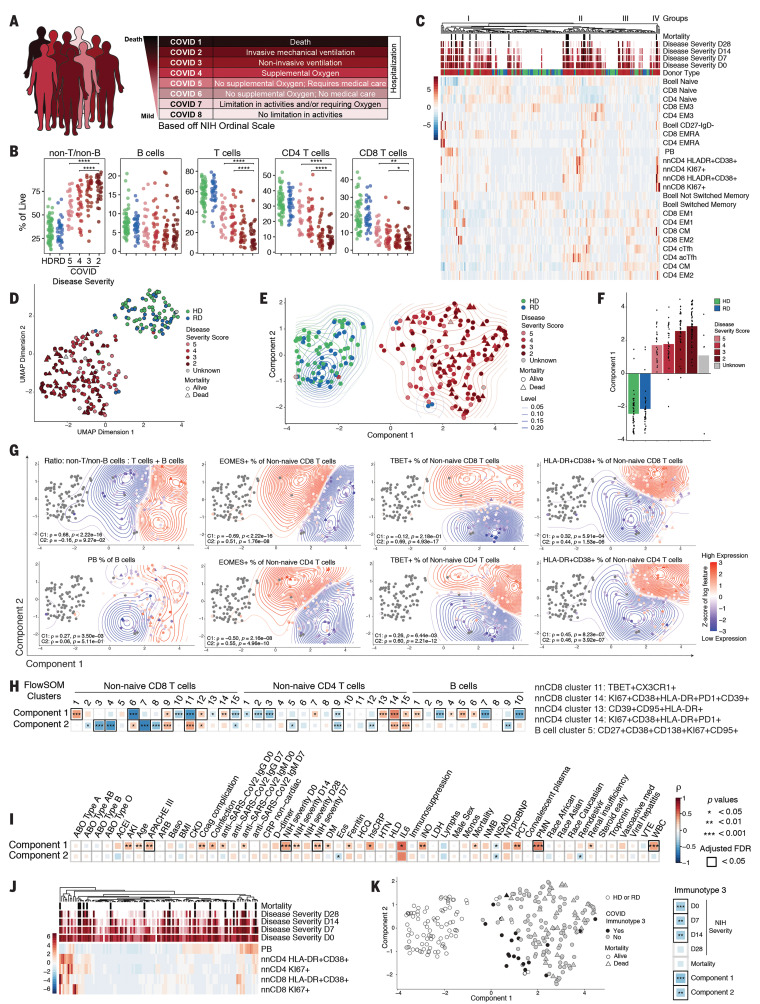
Coronavirus disease 2019 (COVID-19) is currently a global pandemic, but human immune responses to the virus remain poorly understood. We used high-dimensional cytometry to analyze 125 COVID-19 patients and compare them with recovered and healthy individuals. Integrated analysis of ~200 immune and ~50 clinical features revealed activation of T cell and B cell subsets in a proportion of patients. A subgroup of patients had T cell activation characteristic of acute viral infection and plasmablast responses reaching >30% of circulating B cells. However, another subgroup had lymphocyte activation comparable with that in uninfected individuals. Stable versus dynamic immunological signatures were identified and linked to trajectories of disease severity change. Our analyses identified three immunotypes associated with poor clinical trajectories versus improving health. These immunotypes may have implications for the design of therapeutics and vaccines for COVID-19.


Figures

None
High-dimensional immune response analysis of COVID-19 patients identifies three immunotypes.
Peripheral blood mononuclear cell immune profiling and clinical data were collected from 60 healthy donors (HDs), 36 recovered donors (RDs), and 125 hospitalized COVID-19 patients. High-dimensional flow cytometry and longitudinal analysis highlighted stability and fluctuations in the response. UMAP visualization distilled ~200 immune features into two dimensions and identified three immunotypes associated with clinical outcomes. cTfh, circulating T follicular helper cells; EMRA, a subset of effector memory T cells reexpressing CD45RA; d0, day 0.
Fig. 1
Fig. 1. Clinical characterization of patient cohorts, inflammatory markers, and quantification of major immune subsets.
(A) Overview of patient cohorts in our study, including HDs, RDs, and COVID-19 patients. (B) Quantification of key clinical parameters in COVID-19 patients. Each dot represents a COVID-19 patient; HD ranges are indicated in green. THO, ×1000. (C) Spearman correlation and hierarchical clustering of indicated features for COVID-19 patients. (D) Representative flow cytometry plots and (E) frequencies of major immune subsets. (F) Ratio of CD4 to CD8 T cells. (G) Spearman correlation of CD4:CD8 ratio and clinical lymphocyte count per patient. Dark and light gray shaded regions represent the clinical normal range and normal range based on study HDs, respectively. The vertical dashed line indicates the clinical threshold for lymphopenia. (H) Spearman correlations of indicated subsets with various clinical features. (E and F) Each dot represents an individual HDs (green), RDs (blue), or COVID-19 patient (red). Significance was determined by unpaired Wilcoxon test with Benjamini-Hochberg (BH) correction: *P < 0.05, **P < 0.01, ***P < 0.001, and ****P < 0.0001.
Fig. 2
Fig. 2. CD8 T cell subset skewing and activation patterns in COVID-19 patients and potential links to T cell–driven cytokines.
(A) PCA of aggregated flow cytometry data. (B) Representative flow cytometry plots of the gating strategy for CD8 T cell subsets. (C) Frequencies of CD8 T cell subsets as indicated. (D) Frequencies of PD-1+ and CD39+ cells. Frequencies of (E) KI67+ and (F) HLA-DR+CD38+ cells and representative flow cytometry plots. The green line in the left panels denotes the upper decile of HDs. (G) (Top) Global viSNE projection of non-naïve CD8 T cells for all participants pooled, with non-naïve CD8 T cells from HDs, RDs, and COVID-19 patients concatenated and overlaid. (Bottom) viSNE projections of expression of the indicated proteins. (H) viSNE projection of non-naïve CD8 T cell clusters identified by FlowSOM clustering. (I) Mean fluorescence intensity (MFI) as indicated (column-scaled z-scores). (J) Percentage of non-naïve CD8 T cells from each cohort in each FlowSOM cluster. Boxes represent interquartile ranges (IQRs). (C, D, E, F, and J) Each dot represents an individual HDs (green), RDs (blue), or COVID-19 patient (red). Significance was determined by unpaired Wilcoxon test with BH correction: *P < 0.05, **P < 0.01, ***P < 0.001, and ****P < 0.0001.
Fig. 3
Fig. 3. CD4 T cell activation in a subset of COVID-19 patients is associated with distinct CD4 T cell subsets.
(A) Representative flow cytometry plots of the gating strategy for CD4 T cell subsets. (B) Frequencies of CD4 T cell subsets, as indicated. (C) Frequencies of KI67+ cells. The green line in the left panel denotes the upper decile of HDs. Representative flow cytometry plots are shown at right. (D) KI67+ cells from non-naïve CD4 T cells versus non-naïve CD8 T cells. Spearman correlation of COVID-19 patients is shown. (E) Frequencies of HLA-DR+CD38+ cells. The green line in the left panel denotes the upper decile of HDs. Representative flow cytometry plots are shown at right. (F) HLA-DR+CD38+ cells from non-naïve CD4 versus non-naïve CD8 T cells, Spearman correlation of COVID-19 patients is shown. (G) (Top) Global viSNE projection of non-naïve CD4 T cells for all participants pooled, with non-naïve CD4 T cells from HDs, RDs, and COVID-19 patients concatenated and overlaid. (Bottom) viSNE projections of indicated protein expression. (H) viSNE projection of non-naïve CD4 T cell clusters identified by FlowSOM clustering. (I) MFI as indicated (column-scaled z-scores). (J) Percentage of non-naïve CD4 T cells from each cohort in each FlowSOM cluster. Boxes represent IQRs. (B, C, E, and J) Each dot represents an individual HDs (green), RDs (blue), or COVID-19 patient (red). Significance was determined by unpaired Wilcoxon test with BH correction: *P < 0.05, **P < 0.01, ***P < 0.001, and ****P < 0.0001.
Fig. 4
Fig. 4. Deep profiling of COVID-19 patient B cell populations reveals robust PB populations and other B cell alterations.
(A) Gating strategy and frequencies of non-PB B cell subsets. (B) Representative flow cytometry plots and frequencies of PBs. The green line in the right panel denotes the upper decile of HDs. (C) Representative flow cytometry plots and frequencies of KI67+ B cells. (D) (Left) Representative histograms of CXCR5 expression; (right) CXCR5 geometric MFI (GMFI) of B cell subsets. (E) CXCR5 GMFI of non-naïve CD4 T cells and cTFH cells. (F) Spearman correlation between PBs and activated cTFH cells. (G) Spearman correlation between PBs and anti–SARS-CoV-2 IgG. (H and I) Spearman correlation between activated cTFH cells and anti–SARS-CoV-2 (H) IgM and (I) IgG. (J) (Top) Global viSNE projection of B cells for all participants pooled, with B cell populations of each cohort concatenated and overlaid. (Bottom) viSNE projections of expression of the indicated proteins. (K) Hierarchical clustering of EMD using Pearson correlation, calculated pairwise for B cell populations for all participants (row-scaled z-scores). (L) Percentage of cohort in each EMD group. (M) Global viSNE projection of B cells for all participants pooled, with EMD groups 1 to 3 concatenated and overlaid. (N) B cell clusters identified by FlowSOM clustering. (O) MFI as indicated (column-scaled z-scores). (P) Percentage of B cells from each cohort in each FlowSOM cluster. Boxes represent IQRs. (A to F and P) Dots represent individual HDs (green), RDs (blue), or COVID-19 (red) participants. (A to E and P) Significance was determined by unpaired Wilcoxon test with BH correction: *P < 0.05, **P < 0.01, ***P < 0.001, and ****P < 0.0001. (G to I) The black horizontal line represents the positive threshold.
Fig. 5
Fig. 5. Temporal relationships between immune responses and disease manifestation.
(A) Global viSNE projection of non-naïve CD8 T cells, non-naïve CD4 T cells, and B cells for all participants pooled, with cells from COVID-19 patients at D0 and D7 concatenated and overlaid. Frequencies of (B) KI67+ and HLA-DR+CD38+ CD4 T cells, (C) KI67+ and HLA-DR+CD38+ CD8 T cells, or (D) PBs as indicated for HDs (green), RDs (blue), or COVID-19 patients (red), with paired samples at D0 and D7 indicated by connecting lines. Significance was determined by paired Wilcoxon test: *P < 0.05, **P < 0.01, ***P < 0.001, and ****P < 0.0001. Longitudinal patterns (see Materials and methods) of (E) HLA-DR+CD38+ CD4 T cells or (F) PBs in COVID-19 patients shown as frequency and representative flow cytometry plots. (G) Spearman correlations of clinical parameters with longitudinal fold changes in immune populations.
Fig. 6
Fig. 6. High-dimensional analysis of immune phenotypes with clinical data reveals distinct COVID-19 patient immunotypes.
(A) NIH ordinal scale for COVID-19 clinical severity. (B) Frequencies of major immune subsets. Significance was determined by unpaired Wilcoxon test with BH correction: *P < 0.05, **P < 0.01, ***P < 0.001, and ****P < 0.0001. (C) Heatmap of indicated immune parameters by row; donor type, disease severity, and mortality are indicated across the top. (D) UMAP projection of aggregated flow cytometry data. (E) Transformed UMAP projection. Density contours were drawn separately for HDs, RDs, and COVID-19 patients (see Materials and methods). (F) Bars represent mean of UMAP component 1. Dots represent individual participants; bars are color-coded by participant group and/or severity score. (G) Density contour plots indicating variation of specified immune features across UMAP component coordinates. Relative expression (according to heat scale) is shown for both individual patients (points) and overall density (contours). Spearman’s rank correlation coefficient (ρ) and P value for each feature versus component 1 (C1) and component 2 (C2) are shown. (H) (Left) Spearman correlation between UMAP components 1 and 2 and FlowSOM clusters. (Right) Select FlowSOM clusters and their protein expression. (I) Spearman correlation between UMAP components 1 and 2 and clinical metadata. (J) Heatmap of immune parameters used to define immunotype 3 indicated by row; disease severity and mortality are indicated across the top. (K) (Left) Transformed UMAP projection; patient status for immunotype 3 indicated by color. (Right) Spearman correlation between immunotype 3 and disease severity, mortality, and UMAP components.

Update of

References

    1. E. Iype, S. Gulati, Understanding the asymmetric spread and case fatality rate (CFR) for COVID-19 among countries. medRxiv 20073791 [Preprint]. 26 April 2020. 10.1101/2020.04.21.20073791 - DOI
    1. Moore J. B., June C. H., Cytokine release syndrome in severe COVID-19. Science 368, 473–474 (2020). 10.1126/science.abb8925 - DOI - PubMed
    1. Shi Y., Wang Y., Shao C., Huang J., Gan J., Huang X., Bucci E., Piacentini M., Ippolito G., Melino G., COVID-19 infection: The perspectives on immune responses. Cell Death Differ. 27, 1451–1454 (2020). 10.1038/s41418-020-0530-3 - DOI - PMC - PubMed
    1. Vabret N., Britton G. J., Gruber C., Hegde S., Kim J., Kuksin M., Levantovsky R., Malle L., Moreira A., Park M. D., Pia L., Risson E., Saffern M., Salomé B., Esai Selvan M., Spindler M. P., Tan J., van der Heide V., Gregory J. K., Alexandropoulos K., Bhardwaj N., Brown B. D., Greenbaum B., Gümüş Z. H., Homann D., Horowitz A., Kamphorst A. O., Curotto de Lafaille M. A., Mehandru S., Merad M., Samstein R. M.; Sinai Immunology Review Project , Immunology of COVID-19: Current state of the science. Immunity 52, 910–941 (2020). 10.1016/j.immuni.2020.05.002 - DOI - PMC - PubMed
    1. D. Weiskopf, K. S. Schmitz, M. P. Raadsen, A. Grifoni, N. M. A. Okba, H. Endeman, J. P. C. van den Akker, R. Molenkamp, M. P. G. Koopmans, E. C. M. van Gorp, B. L. Haagmans, R. L. de Swart, A. Sette, R. D. de Vries, Phenotype of SARS-CoV-2-specific T-cells in COVID-19 patients with acute respiratory distress syndrome. medRxiv 20062349 [Preprint]. 29 May 2020. 10.1101/2020.04.11.20062349 - DOI - PMC - PubMed

Publication types

MeSH terms