. 2020 Jul 15;7(5):e829.
doi: 10.1212/NXI.0000000000000829. Print 2020 Sep.

Motor cortex transcriptome reveals microglial key events in amyotrophic lateral sclerosis

Affiliations

Motor cortex transcriptome reveals microglial key events in amyotrophic lateral sclerosis

Oriol Dols-Icardo et al. Neurol Neuroimmunol Neuroinflamm. .

Abstract

Objective: To identify transcriptomic changes, neuropathologic correlates, and cellular subpopulations in the motor cortex of sporadic amyotrophic lateral sclerosis (ALS).

Methods: We performed massive RNA sequencing of the motor cortex of patients with ALS (n = 11) and healthy controls (HCs; n = 8) and analyzed gene expression alterations, differential isoform usage, and gene coexpression networks. Furthermore, we used cell type deconvolution algorithms with human single-nucleus RNA sequencing data as reference to identify perturbations in cell type composition associated with ALS. We performed immunohistochemical techniques to evaluate neuropathologic changes in this brain region.

Results: We report extensive RNA expression alterations at gene and isoform levels, characterized by the enrichment of neuroinflammatory and synaptic-related pathways. The assembly of gene coexpression modules confirmed the involvement of these 2 major transcriptomic changes, which also showed opposite directions related to the disease. Cell type deconvolution revealed an overrepresentation of microglial cells in ALS compared with HC. Notably, microgliosis was driven by a subcellular population presenting a gene expression signature overlapping with the recently described disease-associated microglia (DAM). Using immunohistochemistry, we further evidenced that this microglial subpopulation is overrepresented in ALS and that the density of pTDP43 aggregates negatively correlates with the proportion of microglial cells.

Conclusions: DAM has a central role in microglia-related neuroinflammatory changes in the motor cortex of patients with ALS, and these alterations are coupled with a reduced expression of postsynaptic transcripts.


Figures

Figure 1
Figure 1. Differential regulation of gene expression in ALS and HC
(A) Volcano plot displaying differentially expressed genes between the ALS and the HC motor cortex. The vertical axis (y-axis) corresponds to the −log10 adjusted p value, and the horizontal axis (x-axis) represents the log2 fold change value obtained when comparing ALS with HC gene expression. Significantly differential expressed genes are depicted with blue circles (adjusted p value <0.05), whereas gray circles display the nonsignificant genes. Gene names are shown for the 10 genes selected for qPCR validation. (B) Box plot showing the relative RNA expression values in ALS and HC obtained through qPCR for the 10 genes selected for validation. Dashed line corresponds to reference relative gene expression. *p < 0.05; **p < 0.01. (C) Top 5 gene ontology and KEGG pathway enrichment analyses obtained from the list of genes showing a significant differential expression. ALS = amyotrophic lateral sclerosis; HC = healthy control.
Figure 2
Figure 2. Cell type composition in the ALS and HC motor cortex
Box plot showing major cell type and Mic1 proportions for HC and ALS estimated by MuSiC using the ROSMAP human single-nucleus RNAseq data. *p < 0.05; **p < 0.01. ALS = amyotrophic lateral sclerosis; HC = healthy control; MuSiC = Multi-Subject Single Cell deconvolution; ROSMAP = Religious Orders Study and Memory and Aging Project.
Figure 3
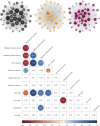
Figure 3. WGCNA visualization and correlation map constructed with WGCNA module eigengenes and cell type proportions
Network diagrams showing the 50 most connected genes for each of the 3 modules associated with ALS (MEblack, MEyellow, and MEpink) are depicted on the top of the figure. Node darkness and size are proportional to the number of connections within the module. Correlation matrix showing the correlation coefficients between cell type proportions is depicted for the 6 major cell types and the Mic1 (DAM) cell subtype. The 3 significant modules (MEblack, MEyellow, and MEpink), each of one sharing unique groups of coexpressed genes that are differentially expressed between patients with ALS and controls, are also included in the correlogram. Only significant correlations are depicted with a colored circle (blue for direct and red for inverse correlations). The size of the circle is proportional to the correlation significance. The plot indicates the high correlation between the 3 modules and how these modules are related to the proportion of specific cell types. ALS = amyotrophic lateral sclerosis; DAM = disease-associated microglia; HC = healthy control; WGGNA = weighted gene coexpression correlation network analyses.
Figure 4
Figure 4. Immunohistochemistry of Mic1 markers
Immunohistochemistry with anti-IBA1 (red) and anti-MHC class II (green) antibodies in the ALS and HC motor cortex. Scale bar corresponds to 50 µm. ALS = amyotrophic lateral sclerosis; HC = healthy control.

References

    1. Brettschneider J, Del Tredici K, Toledo JB, et al. . Stages of pTDP-43 pathology in amyotrophic lateral sclerosis. Ann Neurol 2013;74:20–38. - PMC - PubMed
    1. Liu J, Wang F. Role of neuroinflammation in amyotrophic lateral sclerosis: cellular mechanisms and therapeutic implications. Front Immunol 2017;8:1005. - PMC - PubMed
    1. Prinz M, Jung S, Priller J. Microglia biology: one century of evolving concepts. Cell 2019;179:292–311. - PubMed
    1. Keren-Shaul H, Spinrad A, Weiner A, et al. . A unique microglia type Associated with restricting development of Alzheimer's disease. Cell 2017;169:1276–1290. - PubMed
    1. Steinacker P, Verde F, Fang L, et al. . Chitotriosidase (CHIT1) is increased in microglia and macrophages in spinal cord of amyotrophic lateral sclerosis and cerebrospinal fluid levels correlate with disease severity and progression. J Neurol Neurosurg Psychiatry 2018;89:239–247. - PubMed

Publication types