

Combination of CD8β Depletion and Interleukin-15 Superagonist N-803 Induces Virus Reactivation in Simian-Human Immunodeficiency Virus-Infected, Long-Term ART-Treated Rhesus Macaques
- PMID: 32669328
- PMCID: PMC7495383
- DOI: 10.1128/JVI.00755-20
Combination of CD8β Depletion and Interleukin-15 Superagonist N-803 Induces Virus Reactivation in Simian-Human Immunodeficiency Virus-Infected, Long-Term ART-Treated Rhesus Macaques
Abstract
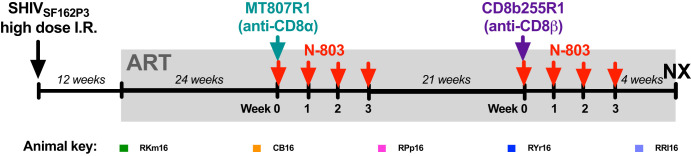
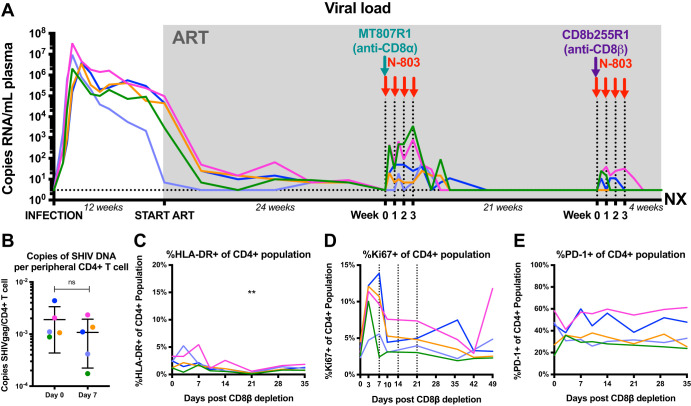
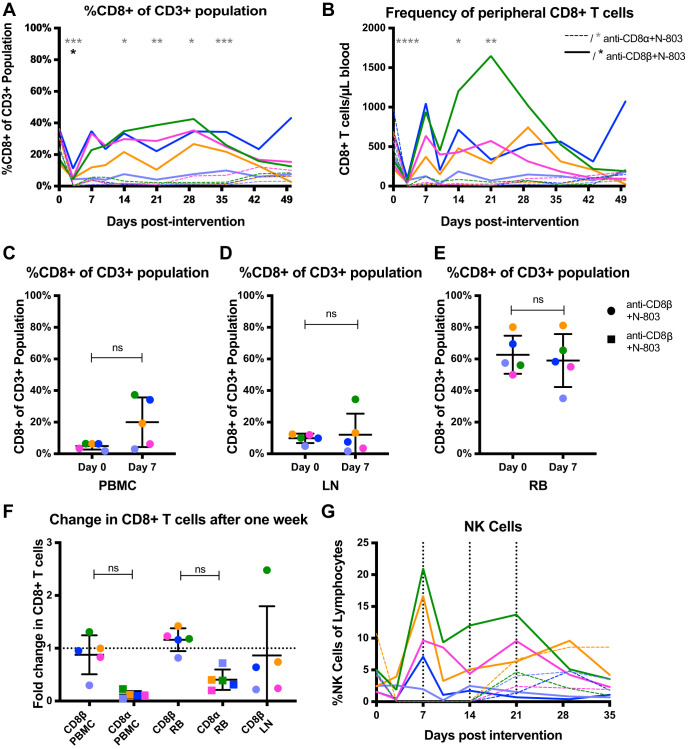
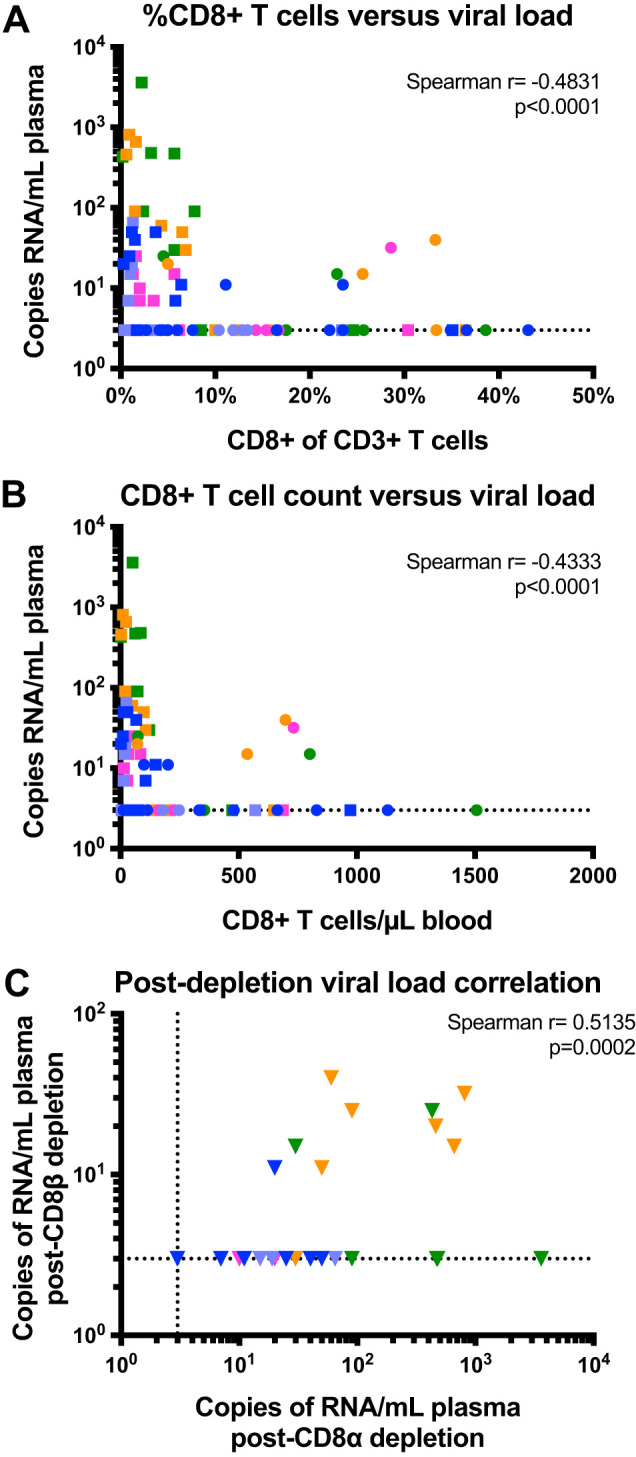
The "shock and kill" strategy predicates that virus reactivation in latently infected cells is required to eliminate the human immunodeficiency virus (HIV) reservoir. In a recent study, we showed robust and persistent induction of plasma viremia in antiretroviral therapy (ART)-treated simian immunodeficiency virus-infected rhesus macaques (RMs) undergoing CD8α depletion and treated with the interleukin-15 (IL-15) superagonist N-803 (J. B. McBrien et al., Nature 578:154-159, 2020, https://doi.org/10.1038/s41586-020-1946-0). Of note, in that study we used an antibody targeting CD8α, thereby depleting NK cells, NKT cells, and γδ T cells, in addition to CD8+ T cells. In the current proof-of-concept study, we tested whether virus reactivation can be induced by administration of N-803 to simian-human chimeric immunodeficiency virus-infected, ART-treated RMs that are selectively depleted of CD8+ T cells via the CD8β-targeting antibody CD8b255R1. CD8β depletion was performed in five SHIVSF162P3-infected RMs treated with ART for 12 months and with plasma viremia consistently below 3 copies/ml. All animals received four weekly doses of N-803 starting at the time of CD8b255R1 administration. The induction of detectable plasma viremia was observed in three out of five RMs, with the level of virus reactivation seemingly correlated with the frequency of CD8+ T cells following CD8β depletion as well as the level of virus reactivation observed when the same animals underwent CD8α depletion and N-803 administration after 24 weeks of ART. These data indicate that CD8β depletion and N-803 administration can induce virus reactivation in SHIVSF162P3-infected RMs despite suboptimal depletion of CD8+ T cells and profound ART-induced suppression of virus replication, confirming a critical role for these cells in suppressing virus production and/or reactivation in vivo under ART.IMPORTANCE The "shock and kill" HIV cure strategy attempts to reverse and eliminate the latent viral infection that prevents eradication of the virus. Latency-reversing agents tested in clinical trials to date have failed to affect the HIV viral reservoir. IL-15 superagonist N-803, currently involved in a clinical trial for HIV cure, was recently shown by our laboratory to induce robust and persistent induction of plasma viremia during ART in three in vivo animal models of HIV infection. These results suggest a substantial role for CD8+ lymphocytes in suppressing the latency reversal effect of N-803 by promoting the maintenance of viral latency. In this study, we tested whether the use of a CD8β-targeting antibody, which would specifically deplete CD8+ T cells, would yield similar levels of virus reactivation. We observed the induction of plasma viremia, which correlated with the efficacy of the CD8 depletion strategy.
Keywords: AIDS; HIV; IL-15; N-803; SHIV; SIV; depletion; immunology; latency; reservoir.
Copyright © 2020 McBrien et al.
Figures
Similar articles
-
SMAC Mimetic Plus Triple-Combination Bispecific HIVxCD3 Retargeting Molecules in SHIV.C.CH505-Infected, Antiretroviral Therapy-Suppressed Rhesus Macaques.J Virol. 2020 Oct 14;94(21):e00793-20. doi: 10.1128/JVI.00793-20. Print 2020 Oct 14. J Virol. 2020. PMID: 32817214 Free PMC article.
-
Antibody-Mediated CD4 Depletion Induces Homeostatic CD4+ T Cell Proliferation without Detectable Virus Reactivation in Antiretroviral Therapy-Treated Simian Immunodeficiency Virus-Infected Macaques.J Virol. 2018 Oct 29;92(22):e01235-18. doi: 10.1128/JVI.01235-18. Print 2018 Nov 15. J Virol. 2018. PMID: 30185596 Free PMC article.
-
The human IL-15 superagonist N-803 promotes migration of virus-specific CD8+ T and NK cells to B cell follicles but does not reverse latency in ART-suppressed, SHIV-infected macaques.PLoS Pathog. 2020 Mar 12;16(3):e1008339. doi: 10.1371/journal.ppat.1008339. eCollection 2020 Mar. PLoS Pathog. 2020. PMID: 32163523 Free PMC article.
-
Mechanisms of CD8+ T cell-mediated suppression of HIV/SIV replication.Eur J Immunol. 2018 Jun;48(6):898-914. doi: 10.1002/eji.201747172. Epub 2018 Mar 26. Eur J Immunol. 2018. PMID: 29427516 Free PMC article. Review.
-
Brain macrophages harbor latent, infectious simian immunodeficiency virus.AIDS. 2019 Dec 1;33 Suppl 2(Suppl 2):S181-S188. doi: 10.1097/QAD.0000000000002269. AIDS. 2019. PMID: 31789817 Free PMC article. Review.
Cited by
-
HIV Reservoirs: Modeling, Quantification, and Approaches to a Cure.Methods Mol Biol. 2022;2407:215-228. doi: 10.1007/978-1-0716-1871-4_16. Methods Mol Biol. 2022. PMID: 34985668
-
Reduction of CD8 T Cell Functionality but Not Inhibitory Capacity by Integrase Inhibitors.J Virol. 2022 Mar 9;96(5):e0173021. doi: 10.1128/JVI.01730-21. Epub 2022 Jan 12. J Virol. 2022. PMID: 35019724 Free PMC article.
-
Multimeric immunotherapeutic complexes activating natural killer cells towards HIV-1 cure.J Transl Med. 2023 Nov 7;21(1):791. doi: 10.1186/s12967-023-04669-4. J Transl Med. 2023. PMID: 37936122 Free PMC article.
-
CD8+ T cells promote HIV latency by remodeling CD4+ T cell metabolism to enhance their survival, quiescence, and stemness.Immunity. 2023 May 9;56(5):1132-1147.e6. doi: 10.1016/j.immuni.2023.03.010. Epub 2023 Apr 7. Immunity. 2023. PMID: 37030290 Free PMC article.
-
Transient T Cell Expansion, Activation, and Proliferation in Therapeutically Vaccinated Simian Immunodeficiency Virus-Positive Macaques Treated with N-803.J Virol. 2022 Dec 14;96(23):e0142422. doi: 10.1128/jvi.01424-22. Epub 2022 Nov 15. J Virol. 2022. PMID: 36377872 Free PMC article.
References
-
- Barré-Sinoussi F, Chermann JC, Rey F, Nugeyre MT, Chamaret S, Gruest J, Dauguet C, Axler-Blin C, Vézinet-Brun F, Rouzioux C, Rozenbaum W, Montagnier L. 1983. Isolation of a T-lymphotropic retrovirus from a patient at risk for acquired immune deficiency syndrome (AIDS). Science 220:868–871. doi:10.1126/science.6189183. - DOI - PubMed
-
- UNAIDS. 2017. UNAIDS data 2017. Joint United Nations Program on HIV/AIDS, Geneva, Switzerland.
-
- Finzi D, Hermankova M, Pierson T, Carruth LM, Buck C, Chaisson RE, Quinn TC, Chadwick K, Margolick J, Brookmeyer R, Gallant J, Markowitz M, Ho DD, Richman DD, Siliciano RF. 1997. Identification of a reservoir for HIV-1 in patients on highly active antiretroviral therapy. Science 278:1295–1300. doi:10.1126/science.278.5341.1295. - DOI - PubMed
Publication types
MeSH terms
Substances
Grants and funding
LinkOut - more resources
Full Text Sources
Medical
Research Materials
