. 2020 Jul 15;11(1):3532.
doi: 10.1038/s41467-020-17306-1.

Co-option of Plasmodium falciparum PP1 for egress from host erythrocytes

Affiliations

Co-option of Plasmodium falciparum PP1 for egress from host erythrocytes

Aditya S Paul et al. Nat Commun. .

Abstract

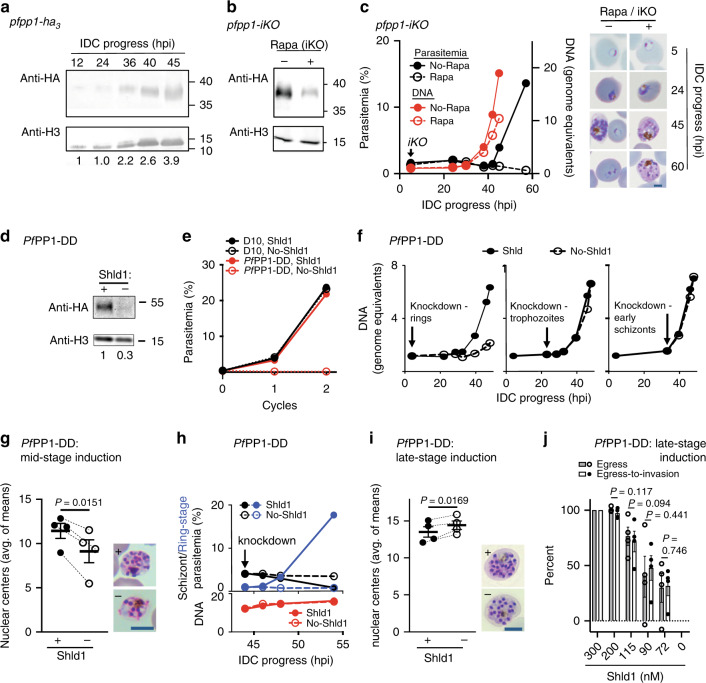
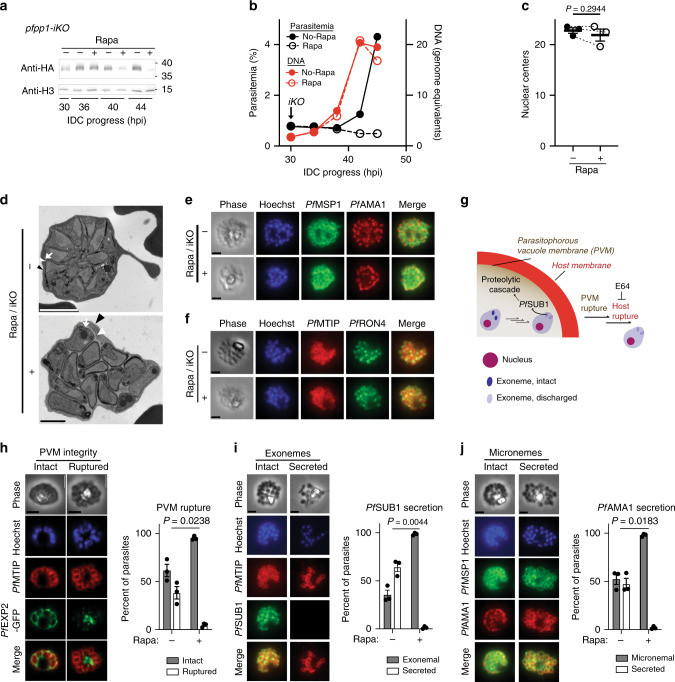
Asexual proliferation of the Plasmodium parasites that cause malaria follows a developmental program that alternates non-canonical intraerythrocytic replication with dissemination to new host cells. We carried out a functional analysis of the Plasmodium falciparum homolog of Protein Phosphatase 1 (PfPP1), a universally conserved cell cycle factor in eukaryotes, to investigate regulation of parasite proliferation. PfPP1 is indeed required for efficient replication, but is absolutely essential for egress of parasites from host red blood cells. By phosphoproteomic and chemical-genetic analysis, we isolate two functional targets of PfPP1 for egress: a HECT E3 protein-ubiquitin ligase; and GCα, a fusion protein composed of a guanylyl cyclase and a phospholipid transporter domain. We hypothesize that PfPP1 regulates lipid sensing by GCα and find that phosphatidylcholine stimulates PfPP1-dependent egress. PfPP1 acts as a key regulator that integrates multiple cell-intrinsic pathways with external signals to direct parasite egress from host cells.


Conflict of interest statement

The authors declare no competing interests.

Figures

Fig. 1
Fig. 1. Isolating an essential PfPP1 function late in the intraerythrocytic developmental cycle.
a PfPP1-HA3 expression during intraerythrocytic development (hours post-invasion, hpi), assessed by immunoblot. Relative PfPP1 levels (below lanes) are normalized to histone H3. Representative of 3 experiments. Molecular mass in kDa. b iKO of pfpp1 was initiated at 5 hpi with rapamycin (Rapa) and protein levels were assessed by immunoblot at 30 hpi (sample processing control on separate gel). Representative of 2 experiments. Molecular mass in kDa. c Left: Parasitemia and DNA synthesis over the IDC following +/−Rapa-treatment at 5 hpi in pfpp1-iKO parasites, monitored by flow-cytometry. Mean of 3 technical replicates. Representative of 4 experiments. Right: Images of parasites along the IDC, following +/−Rapa-treatment at 5-hpi. Scale bar: 2 µm. d HA-tagged PfPP1-DD protein from schizont-stage parasites (~48 hpi) grown +/−Shld1 for 6 h, assessed by immunoblot. Molecular mass in kDa. Representative of 1 experiment. e Proliferation of PfPP1-DD and parental D10 parasites (wild type), +/−Shld1, monitored by flow-cytometry. Knockdown was induced in cycle-zero. Mean of 2 technical replicates. Representative of 2 experiments. f DNA replication in PfPP1-DD parasites following knockdown at the indicated timepoints, monitored by flow-cytometry. Mean of 2 technical replicates. Representative of 4 experiments for ring-stage induction, 2 experiments for trophozoite-stage induction, and 2 experiments for early schizont-stage induction. g Left: Nuclear centers in terminally developed PfPP1-DD parasites, assessed by light microscopy. Knockdown induced at 22-30 hpi. Mean ± s.e.m.; n = 4 experiments; two-tailed t test. Right: Representative images of terminal parasites +/−Shld1. Scale bar: 5 µm. h Top: Schizont and ring-stage parasites monitored by flow-cytometry following induction of PfPP1-DD knockdown (+/−Shld1) late in the IDC. Bottom: DNA content in the parallel samples, with addition of E64 (50 µM). Mean of 2 technical replicates. Representative of 2 experiments. i Nuclear centers following PfPP1-DD knockdown at 44 hpi, as in g. Mean ± s.e.m.; n = 4 experiments; two-tailed t test. Scale bar: 5 µm. j Egress and egress-to-invasion following induction of partial PfPP1-DD knockdown at sublethal doses of Shld1. Mean ± s.e.m.; n = 4 experiments; two-tailed t test. Source data are provided as a Source Data file.
Fig. 2
Fig. 2. PfPP1 function at an early step of parasite egress from erythrocytes.
a PfPP1-HA3 expression +/− Rapa-mediated iKO of pfpp1 at 30 hpi, assessed by immunoblot. Representative of 2 experiments. Molecular mass in kDa. b Parasitemia and DNA synthesis following iKO of pfpp1 at 30 hpi, as in Fig. 1c. Mean of 3 technical replicates. Representative of 4 experiments. c Nuclear centers in terminally developed parasites following Rapa-mediated iKO of pfpp1 at 30 hpi, as in Fig. 1. Mean ± s.e.m.; n = 3 experiments; two-tailed t test. d Electron microscopy of terminally developed pfpp1-iKO parasites treated +/−Rapa at 30-hpi. In both images, the different membranes are indicated as follows: erythrocyte (black arrowhead), PV (white arrowhead), and parasite (white arrow). Representative of 2 experiments. Scale bars: 2 µm (top), 1 µm (bottom). e, f Immunofluorescence analysis of the microneme antigen PfAMA1 e or the rhoptry-neck antigen PfRON4 f in terminally developed parasites +/−iKO of pfpp1 at 30 hpi. The images also show the parasite plasma membrane marker PfMSP1 e and the inner membrane complex marker PfMTIP f. Scale bar: 2 µm. For both panels, representative of 2 experiments. g In a mature parasite, regulated secretion of PfSUB1 from exonemes stimulates a proteolytic cascade leading to sequential rupture of the PVM and the erythrocyte host membranes. h PVM rupture at 45 hpi in pfpp1-iKO / PfEXP2-GFP parasites treated +/− Rapa at 30 hpi. Left: immunofluorescence images of parasites with intact or ruptured PVMs. Right: Proportion of infected cells exhibiting PVM rupture. For hj, mean ± s.e.m.; n = 3 experiments; two-tailed t test. In hj, parasites were treated with E64 (50 µM) at 41 hpi; the completion of cytokinesis was assessed with the inner membrane complex marker PfMTIP or the parasite plasma membrane marker PfMSP1. Scale bars (hj): 2 µm. i With +/− Rapa-treatment at 30 hpi in pfpp1-iKO parasites, quantification of PfSUB1 secretion from exonemal compartments (loss of punctate fluorescence in images at left), as in h. j Assessment of PfAMA1 secretion from micronemes, as in h and i. Source data are provided as a Source Data file.
Fig. 3
Fig. 3. PfPP1 regulation of a HECT E3 protein-ubiquitin ligase for egress.
a Chemical-genetics of PfPP1-DD. We assessed functional interactions between inhibitor-sensitive processes and PfPP1 from shifts in chemical sensitivity induced by knockdown of the phosphatase. b The sensitivities (IC50s) of PfPP1-mediated egress-to-invasion to calyculin A and dihydroartemisinin (DHA) at 200 or 90 nM Shld1. Mean ± s.e.m.; n = 4 experiments; two-tailed t test. c Scheme for phosphoproteomic analysis of PfPP1-DD knockdown late in the IDC, with samples obtained at 48- and 55-hpi. d Left: At 48 hpi, signal intensities of individual proteins and shifts with PfPP1-knockdown. PfI2 and PfLRR1 are indicated in red, with the top 5% of upregulated proteins indicated in black. Right: For all phosphopeptides detected in late-stage parasites, a plot of changes in levels with PfPP1-DD knockdown at 48-hpi (y-axis) versus changes with development from 48 to 55-hpi in parasites on-Shld1 (x-axis). Thresholds for twofold increased and decreased phosphorylation (log2 = 1, y-axis) with knockdown are indicated. Upregulated phosphopeptides from gene products increased in transcription at the schizont-stage are colored; phosphopeptides in the upper-right quadrant (developmental progression threshold: median value, x-axis) least likely to be affected by secondary, developmental-progression defects (Supplementary Note 1) are indicated with filled circles. The phosphorylation site from PfHistone H3 is purple; the sites from PfHECT1 and PfGCα are in red. Representative of 1 experiment. e Schematic of the predicted domains of PfHECT1 protein. We show all phosphosites detected in our study with magnitude of change with PfPP1-DD knockdown at 48 hpi as in d. The most increased (Ser-6138) and decreased phosphorylation sites (Tyr-9244) are indicated with symbols [*] and [**], respectively. f Sensitivity of PfPP1-DD parasites on-Shld1 (0.5 µM) to heclin administered at the midpoint (24 hpi) or late in the IDC (44 hpi), determined from erythrocyte re-invasion. Mean ± s.e.m.; n = 3 experiments; two-tailed t test. Representative images of parasites at 55-hpi +/− heclin administration (100 µM) at 44 hpi, are shown. Scale bar: 5 µm. g The sensitivity of PfPP1-mediated egress-to-invasion to heclin, as in b. Mean ± s.e.m.; n = 4 experiments; two-tailed t test. Source data are provided as a Source Data file.
Fig. 4
Fig. 4. PfPP1 regulation of cGMP and signaling by extrinsic phosphatidylcholine.
a PfPP1-regulated phosphorylation and cGMP-based signal transduction initiated by PfGCα. We indicate PfPP1-regulated sites (red) and signature sequences for phospholipid transporter (PLT) activity (purple), Ile-396 and Asp-756 (Supplementary Fig. 6a). cGMP-phosphodiesterase (PDE) and PfPKG, as well as inhibitors of both targets, are depicted. b Relative cGMP at 47.5 hpi in PfPP1-DD-intact (0.5 µM Shld1) or knockdown parasites. Mean ± s.e.m.; n = 3 experiments; two-tailed t test. c The sensitivity of PfPP1-mediated egress-to-invasion to zaprinast (left) or Cpd1 (right). Mean ± s.e.m.; n = 4 experiments; two-tailed t test. d Top: Phospholipids at the parasite plasma membrane with potential routes of interconversion. Extracellular LPC crosses the plasma membrane, providing substrate for endogenous biosynthesis of PC via the Kennedy Pathway, . Bottom: Stimulation of egress (left) or egress-to-invasion (right) by supplemented lipids in late IDC PfPP1-DD parasites with partial destabilization (100 nM Shld1), expressed in terms of fold-change relative to no-lipid conditions (mean ± s.e.m., number of experiments indicated in plot). e Labeling of the parasites by PC. Left: Representative images of late-stage PfPP1-DD-infected erythrocytes (0.5 µM Shld1 and 50 µM E64, 54 hpi) labeled by TF-PC at the erythrocyte membrane or at the plasma membranes of internal parasites. Nuclei are indicated by Hoechst. Scale bar: 5 µm. Right: The proportion of infected erythrocytes with labeled parasites at the indicated timepoints, ±E64. Mean ± s.e.m.; n = 3 experiments; two-tailed t test. f Stimulation of PfPP1-mediated egress with supplementation of choline, as in d. Mean ± s.e.m.; n = 4 experiments. g Modulation of PfPP1-regulated cellular processes by supplemented choline. The fold-change in IC50 with additional choline in PfPP1-DD parasites in 150 nM Shld1 is indicated. Mean ± s.e.m.; n = 3 experiments; multiple two-tailed t tests (false discovery rate, 1%). h A model for the function of PfPP1. Following regulation of growth during development, PfPP1 is essential for the egress program upstream of cGMP-activated PfPKG and disintegration of the PVM. PC enters host cells following natural permeabilization of the erythrocyte membrane, acting on exposed parasites to stimulate egress. Source data are provided as a Source Data file.

References

    1. Gerald N, Mahajan B, Kumar S. Mitosis in the human malaria parasite Plasmodium falciparum. Eukaryot. Cell. 2011;10:474–482. - PMC - PubMed
    1. Arnot DE, Ronander E, Bengtsson DC. The progression of the intra-erythrocytic cell cycle of Plasmodium falciparum and the role of the centriolar plaques in asynchronous mitotic division during schizogony. Int. J. Parasitol. 2011;41:71–80. - PubMed
    1. Pease BN, et al. Global analysis of protein expression and phosphorylation of three stages of Plasmodium falciparum intraerythrocytic development. J. Proteome Res. 2013;12:4028–4045. - PMC - PubMed
    1. Bushell E, et al. Functional profiling of a Plasmodium genome reveals an abundance of essential genes. Cell. 2017;170:260–272. - PMC - PubMed
    1. Zhang M, et al. Uncovering the essential genes of the human malaria parasite Plasmodium falciparum by saturation mutagenesis. Science. 2018;360:eaap7847–30. - PMC - PubMed

Publication types